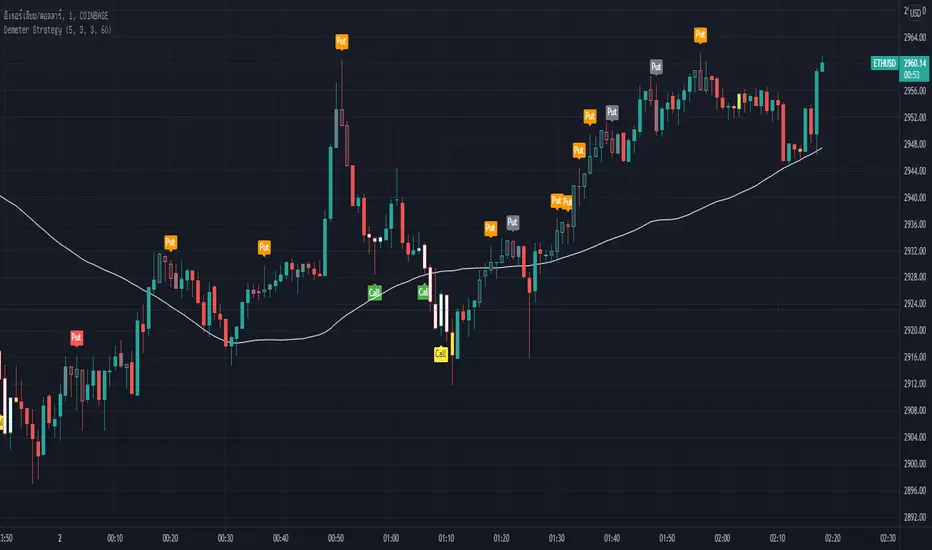
Demeter StrategyDemeter Strategy is Stochastic oscillator (5 3 3) and SMA (60) system with small modification.
This strategy has 6 signals.
(These 6 signals can be used in every market.)
Main signals :
Green Call : Call (Buy)
Reg Put : Put (Sell)
Secondary signal :
Yellow Call : Call (Buy)
Orange Put : Put (Sell)
Fast signal :
White Call : Call (Buy)
Gray Put : Put (Sell)
In trading, any signal can be used.
Media mobile semplice (SMA)
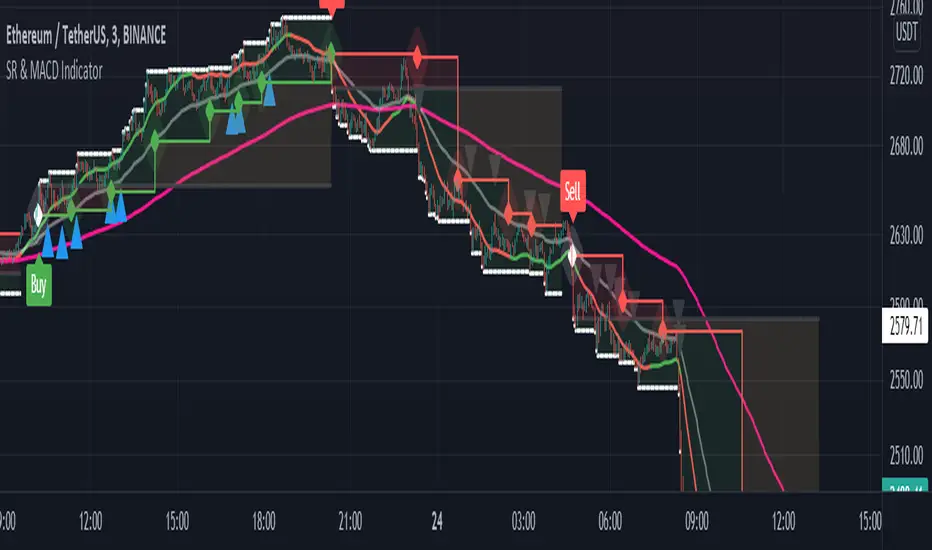
Support and Resistance with MACD IndicatorOriginal script from ©akpaswaniitk. I just added MACD to filter out bad trades and alert function so that we get notified whenever indicator gives us an entry signal. Most of the false breakout has been removed but the remaining ones only pop up during consolidation, so it's wait for the retest before entry. Works better in continuous market. Also look at the color of EMA for further confirmation, only focus on buy side when EMA is green and sell when EMA is red or when after the buy signal EMA changes color from red to green. These are the highly profitable setups I've found with this indicator.
Signals
Red or Green solid line with diamond are trailing stoploses
dotted black line is entry level
dotted white line is optimal exit
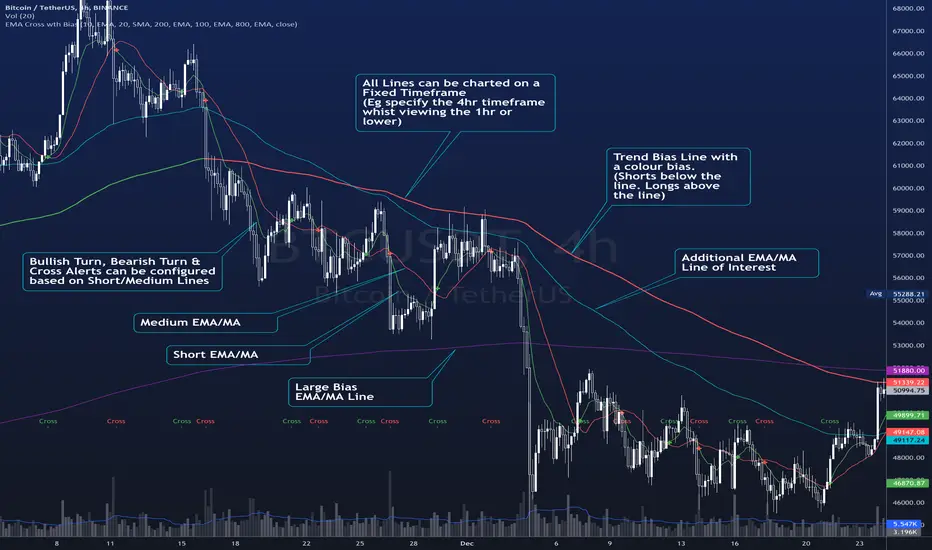
EMA Cross wth BiasThe Script plots 4 Moving averages.
1. Short Moving Average
2. Medium Moving Average
2. Trend Bias (Usually a much slower Moving Average) - Plots in Green when price action is above the line and Red for when price action is below the line.
3. Alerts are triggered when the short MA/ EMA turns. Can be used for Early Entry signals and Exits.
4. Alerts are triggered for Crosses of the Short and Medium MA
Each Moving average line can be confirmed to be a Simple MA or and EMA
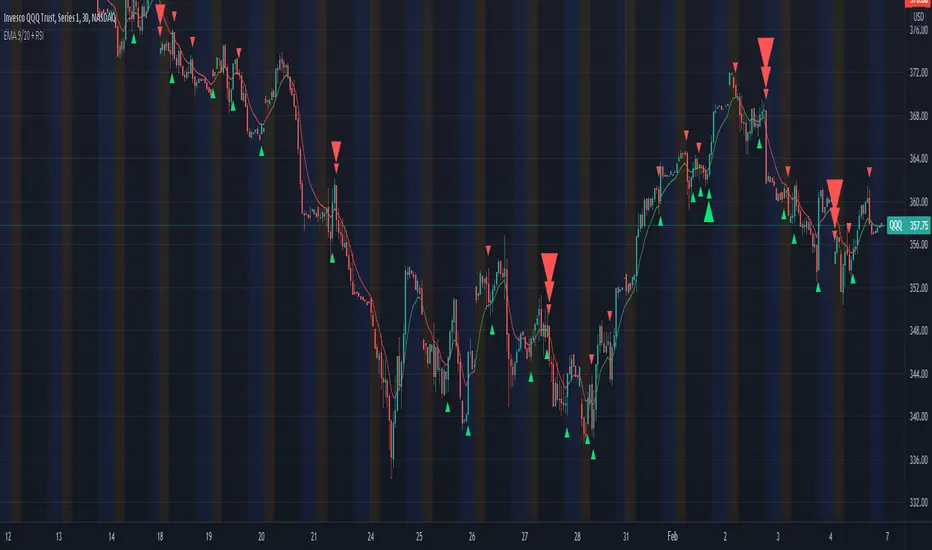
Multiple Timeframe continuity with Crossover Alerts█ OVERVIEW
This Indicator calculates the EMA 9/20 and the RSI with its SMA on multiple timeframes and indicates their crossings. In addition this script alerts the user when crossings appear.
█ USAGE
Use the checkboxes to activate different timeframes. With the dropdown menu you can select the timeframe in minutes.
Furthermroie use the checkboxes to activate different crossovers. At the end of the settings you can find the same options for the RSI.
You can also let the script indicate only the overlapping of both indicator crossovers by using the combination option.
█ KNOWLEDGE
EMA: The ema function returns the exponentially weighted moving average. In ema weighting factors decrease exponentially. It calculates by using a formula: EMA = alpha * source + (1 - alpha) * EMA , where alpha = 2 / (length + 1).
SMA: The sma function returns the moving average, that is the sum of last y values of x, divided by y.
RSI: The RSI is classified as a momentum oscillator, measuring the velocity and magnitude of price movements. Momentum is the rate of the rise or fall in price. The RSI computes momentum as the ratio of higher closes to lower closes: stocks which have had more or stronger positive changes have a higher RSI than stocks which have had more or stronger negative changes.
RMA: Moving average used in RSI. It is the exponentially weighted moving average with alpha = 1 / length.
(Source: TradingView PineScript reference & en.wikipedia.org)
█ Credits
Thanks to @KhanPhelan with his EMA 9/20 trading idea
Credits to TradingView for their RSI function
█ Disclaimer
This is my first Script, any feedback is welcome.
Forex Dogs Moving Averages with Distance TableThis is an indicator based on the book【Forex】ForexDog’s Vacuum Zone Trading 2021: Trading Strategy to “not lose” based on Experience and Logic written by Forex Dog (yes, this is his author name on Amazon; he is a trader popular mostly in Japan). It consists of simple moving averages which should somewhat correspond to the higher timeframes moving averages. The original was traded on a 15m chart and the periods are as follows: 5, 20, 40, 50, 80, 100, 200, 400, 640, 1600, 1920, 3200.
Then, there is a big table with a distances overview. This should give you an idea of how far each average is in ticks. The minus in front of the ticks_total signifies direction.
I expect some feedback on this because I don't think the user convenience is very with tables being so bright. My goal is to create a system that limits the number of "noodles" on the chart but still carries the information via the tables on the side.
Moving Average Length is not adjustable by design. The book says to use these quite explicitly, although the logic would work just fine with some other levels, it would not be the original strategy.
Good luck!

MACD_STO-SAMI This indicator depends on the trend. You must first determine the general trend and then wait for the signals that indicate buying in the bullish direction and the signals that indicate selling in the bearish direction, which is the green signal is considered buying and the red signal is considered selling
Also, this indicator differs from the rest of the indicators that the signal is prior to the movement of hair, meaning that it is predictive and is strong.

Moving Average CombinationsThis moving average indicator is used to plot either EMA or SMA as per users choice. User also has the options to choose different type of sources for each of the moving average lines like high, low, close etc. Again, flexibility is added to plot moving averages of different timeframe than the current timeframe of the chart. By doing so in daily chart user can plot averages of different timeframe like hourly, weekly or monthly and vice versa. Length is also as per the choice of the user.
So for a example, in a daily timeframe chart you can plot 9SMA High Daily, 200EMA Close 1Hr, 200EMA Close 2Hr, 200EMA Close Daily, 9SMA High Weekly and so on. This will help in play moving average crossovers and contractions.
Label for each moving average line is also added.

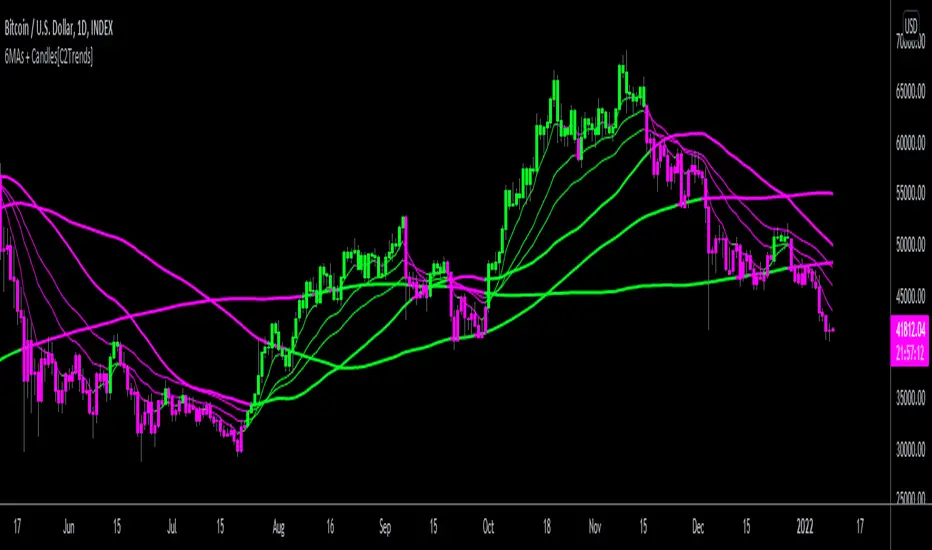
3 EMA/SMA + Colored Candles[C2Trends]// Indicator Features:
// 1) 3 Exponential Moving Averages and 3 Simple Moving Averages.
// 2) Additional EMA input for colored candles(EMA is hidden from chart, input used for coloring of candles only)
// 3) Turn colored candles on/off from main input tab of indicator settings.
// 4) Turn SMA's and EMA's on/off from main input tab of indicator settings.
// 5) Select single color or 2 color EMA and SMA lines from main input tab of indicator settings.
// Indicator Notes:
// 1) 'Candle EMA' input is the trend lookback period for the price candle colors. When price is above desired Candle EMA, price candles will color green. When price is below the Candle EMA, price candles will color fuchsia.
// 2) If you are using another indicator that colors the price candles it may overlap the candle colors applied by this indicator. Trying hiding or removing other indicators to troubleshoot if having candle color issues.
// 3) Using 2-color price moving averages: when price is above an average the average will color green, when price is below an average the average will color fuchsia.
Stage AnalysisThis indicator helps in identification of stage cycle of a stock. Only to be analysed on Weekly and Daily timeframe.
Stages
Stage 1 - Accumulation phase of a stock
Stage 2 - Uptrend phase
Stage 3 - Distribution phase
Stage 4 - Downtrend
As shown in the chart, each stock go through its stage cycle. Below points confirms the uptrend of a stock
This will give idea of when to buy a stock
Wait for first green label up bar to appear which is confirmation for stage 1 completion
Another green label appears which will indicate stage 2 is starting
Finally yellow label up appears which confirms the stage 2 uptrend
Once the yellow bar appears, Wait for a base to be formed then go for buy.
credits: Inspired from @BigBitsIO tutorials and @finallynitin

EMA/MA Cross + BB + Alerts Short hand notes - I made this for friend and I. Unsure how to share it with him so made it public.
u/ tmyerskerry for the math on slope and look back period (look back period isn't perfect for slope calculation as 200ma is slow moving so some signals are goign to be strong instead of weak and visa versa. If you know a better way than i'm all ears!
Can set mutliple EMA's and MA's.
Default BB built in. Couldn't figure out how to set default shadow transparency so you will have to turn it down.
Added red and green lines that indicate when price has gone above and below the BB shadow.
Added arrows for when EMA1 crosses EMA2. Right now set for 9 + 32. And depending on MA200 color changes if its with the trend or against.
Alerts in the works. (please don't ask for them as i'm doing this part time and don't know pinescript)

Moving Averages Different Type & SourceThis is a indicator to plot moving averages. User has the option to choose whether to plot SMA (simple moving average) or EMA (exponential moving average). Length of the averages also can be changed by user. The main feature also is use of different source for different length of MAs. Like you can plot 9SMA High with 20EMA Close etc. So, you can plot different types of combinations with type of MA (sma and ema) and Source type (high, low, open, close etc.).
A table also added in the right top to show the values of MA in selected timeframe. The red color indicate current price is below that ma and green color indicate current price is above that ma. Same feature added in plot of ma line by checking toggle color feature option on. It will show green color ma when price is above it and red color ma lines when price is below it.

R950S- MehmetAltun
hello, it allows you to see both rsi and ma and ema values on the same screen. You can set the levels you want in the Aarlar section. You can make the coloring you want.

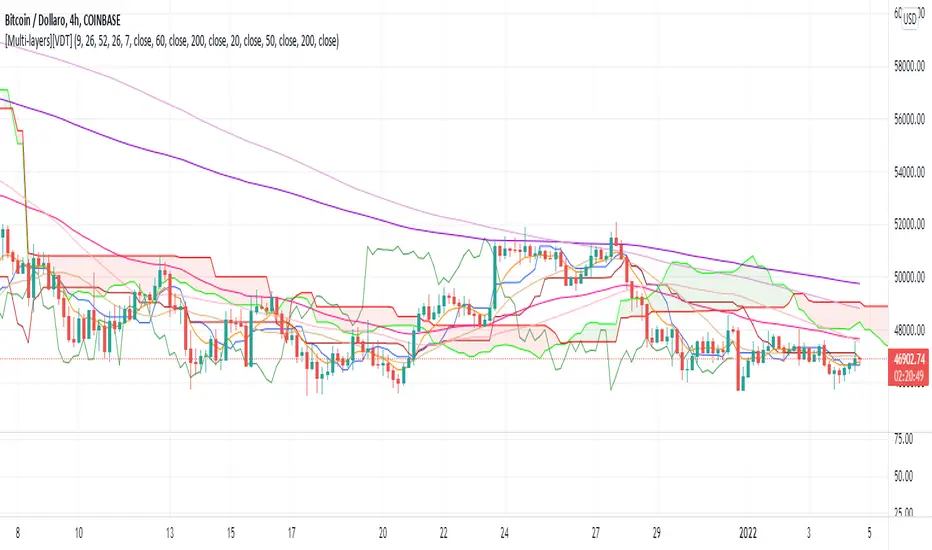
[Multi-layers][VDT]New multi-indicator to merge together three of the most popular indicators used by traders in technical analysis:
1) Ichimoku Cloud, with parameters editable by the trader. Default parameters are: 9-26-52-26
2) 3X Simple Moving Average (SMA), with periods editable by the trader. Default periods are: 20-50-200
3) 3X Exponential Moving Average (EMA), with periods editable by the trader. Default periods are: 7-60-200
Traders can decide whether to print or to hide each indicators separately in the graph, creating three different overlays.
Time Locked Moving AverageSuccinct Description
Generates moving average that stays locked to users desired time preference.
Verbose Description
The default moving average indicator does not stay locked to the chart timeframe. Meaning, if you want to see a 1 day SMA on a 15 minute chart, you have to do math and adjust the moving average length to 96.
Needing to do this constantly (especially while flipping through multiple time frames) was really annoying, so I codded up this script to do it for me... and now it can for you too!
Error Handling
If you receive a 'study error' that says, "function sma references too many candles in history".
Go to the Time Locked Moving Average settings and increase the timeframe interval until error goes away.
Furthermore, UNCHECK gaps, to show real-time approximated moving average values.
Enjoy :)

Intraday MAs for Regular/Extended SessionThis indicator will allow you to show multiple EMA/SMAs for different timeframes on your chart. In addition, it can show you indicators calculated from regular and extended sessions, independently of the session type you have selected for your chart.

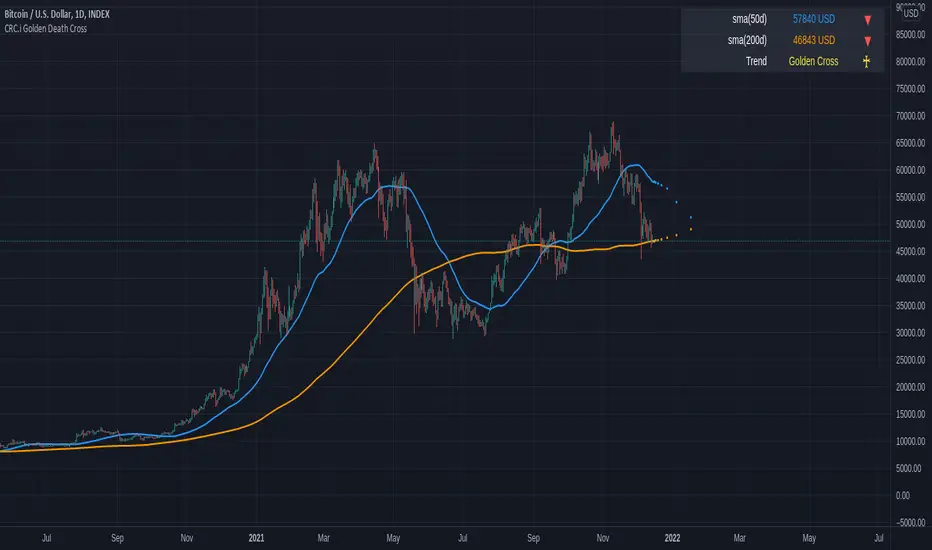
CRC.i Golden Death CrossThis is a simple reproduction of a common indicator used for analyzing the current momentum trend.
Golden Cross => 50 day simple moving average (sma) crosses over the 200 sma
Death Cross => 50 day simple moving average (sma) crosses under the 200 sma
Forecasting used in this indicator is a simple moving average, considering the price sma with length of (sma period - future bar count).
More articles at
mirror.xyz
medium.com
High-Low IndexHello All,
High-Low Index is a breadth indicator based on Record High Percent (RHP). RHP is based on new 52-week highs and new 52-week lows. RHP => 100 * (new highs) / (new highs + new lows). High-Low Index is a 10-day Simple Moving Average of the RHP, which makes it a smoothed version of RHP. You can find many articles about High-Low Index on the net.
High-Low Index above 50 indicates that there are more new highs than new lows, and considered as Bullish.
High-Low Index below 50 indicates that there are more new lows than new highs, and considered as Bearish.
High-Low Index = 0 indicates there is no new highs (0% new highs).
High-Low Index = 100 indicates that there is at least 1 new high and no new lows.
and High-Low Index = 50 indicates that new highs and new lows is equal.
by default 40 cryptos are used in the script and shows High-Low Index for these cryptos. but you can change them as you wish. for example you can set all of them as stocks and see High-Low Index for these stocks.
You can set " Time frame " and the " Length " using the options. For example; if you set " Time frame " = 1 Week and the " Length " = 52 then it finds High-Low Index for 52weeks .
or another example; if you set " Time frame " = 1 Day and the " Length " = 22 the High-Low Indexn it finds High-Low Index for 22days.
You can enable/disable Record High Percent or Simple Moving Average of High-Low Index. Some traders use High-Low Index with its SMA, for example; High-Low Index generates a buy signal when it crosses above its moving average, and a sell signal when it crosses below its moving average.
Optionally you can see the securities in a table on the left bottom, you can change table size by usşng the options.
In the Table, for each security/cell;
=> if background is green then it has New High
=> if background is red then it has New Low
=> if background is gray then no New High, no New Low
=> if background is back then Data is not available for the security
As you can see in the screenshot below, the securities were changed and stocks are used instead of cryptos, so it calculates & shows High-Low Index for these stocks.
you can also find explanation in this screenshot:
Enjoy!

UK Sectors Comparison SMAProvides a chart showing SMA of UK equity indexes from CBOE www.cboe.com
Shows either percentage change from baseline, or absolute index values.
All configurable (including selected symbols), but the defaults are:
SMA 100,
Show Absolute Values = true
Baseline is set to CBOEEU:BUKAC
Sector indexes are:
UK Consumer Cyclicals = CBOEEU:BUKCONC
UK Mining and Minerals = CBOEEU:BUKMINP
UK Finance = CBOEEU:BUKFIN
UK Technology = CBOEEU:BUKTEC
UK Telecoms = CBOEEU:BUKTEL
UK Consumer Services = CBOEEU:BUKCONS
UK Healthcare = CBOEEU:BUKHLTH
UK Energy = CBOEEU:BUKENGY
UK Utilities = CBOEEU:BUKUTL
UK Business Services = CBOEEU:BUKBUS
UK Consumer Non-Cyclicals = CBOEEU:BUKCNC
UK Industrials = CBOEEU:BUKIND
UK Non-Energy Minerals = CBOEEU:BUKNIM
NOTE: takes a few seconds to load as it needs to request all the data
Check the tooltips in the settings for detailed help.

Williams % + SMAThe indicator is based on finding the price relative to the moving average (SMA). The Williams Percentage Range indicator (%R) is used to filter the signals.
В основе индикатора лежит нахождение цены относительно скользящей средней (SMA). Для фильтрации сигналов используется индикатор "процентный диапазон Вильямса" (%R).

JC blended MAs v3The best, simplest moving averages you'll find.
Well not really. But it does have SMA, WMA, and EMA in one place. Plus an additional one that averages those, that might give you a leg up because it's not really a standard thing and you won't create a massive worldwide machine-driven feedback loop that crashes the markets (instead profit from them). Or something like that.
Each moving average has their own definable averaging length.
The master time resolution is also definable, or you can use the chart's. (The latter which is not very useful for moving averages, yet so many of them on trading view don't let you specify otherwise.)
For example you can set the master resolution to 5 minutes, 1 hour, 1 day, etc. (Default is 1 hour.) The graphs don't change, only the resolution.
Note: There are a few rare, extreme edge cases where the graphs won't render, which are obvious. In which case all you need to do is choose a more sane resolution. This is more about the limits of Trading View than specific script bugs.

Cloud Ribbon ++ by [JohnnySnow]Inspired by my favorite EMA ribbon - "EMA Ribbon " by fskrypt.
This Ribbon ADD the option to choose the avarage algorithm of the ribbon .
Created also to be more friendly to read along with trendlines and Fibonacci retracements.
For those like me that NOT use this ribbon to find exact price action but instead, to have a grasp of possible Support/Resistance strenght ahead.
High transparency lines and a configurable color palette for filling the background give the ribbon a look of support/ Resistance cloud Strenght.
Each MA length, line, and background color can be easily configured.

RM Moving averageIt is the first version of the crossover function which returns an arrow with the text "LONG"
