MA Divergence 2060Show the divergence between two moving averages.
If there is a cross between 20 and 60, it is a significant short-term trend change.
Look at the color of the area.
I can see the main trend at the moment.
The center of the change is the intersection of the two MA
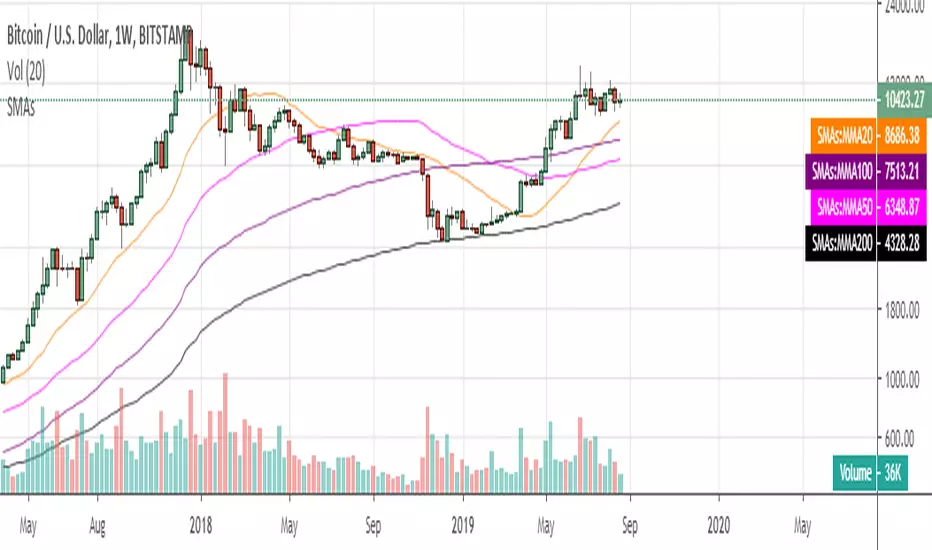
Media mobile semplice (SMA)

Triple MA 5-period forecast [Siem]This script calculates 3 MAs and forecasts where these MAs will be in the next 5 future periods.
Automatic mode - price will be based on current price ("flat") or an X-period linear regression ("linreg").
Manual mode - enter your own value('s): let's see where the MA's will be when your favourite equity all of a sudden hits 1 million tomorrow!
based on Triple MA Forecast by yatrader2 , idea by anthnyl


Multi EMA/SMA with Bollinger Bands Combo 1.0This script provides:
5 regular EMAs
5 regular SMAs
3 multiple time frame EMAs
3 multiple time frame SMAs
Bollinger Bands
All features can be turned on/off and customized regarding color, lines, etc.
Excellent for TradingView users with limited or free accounts.

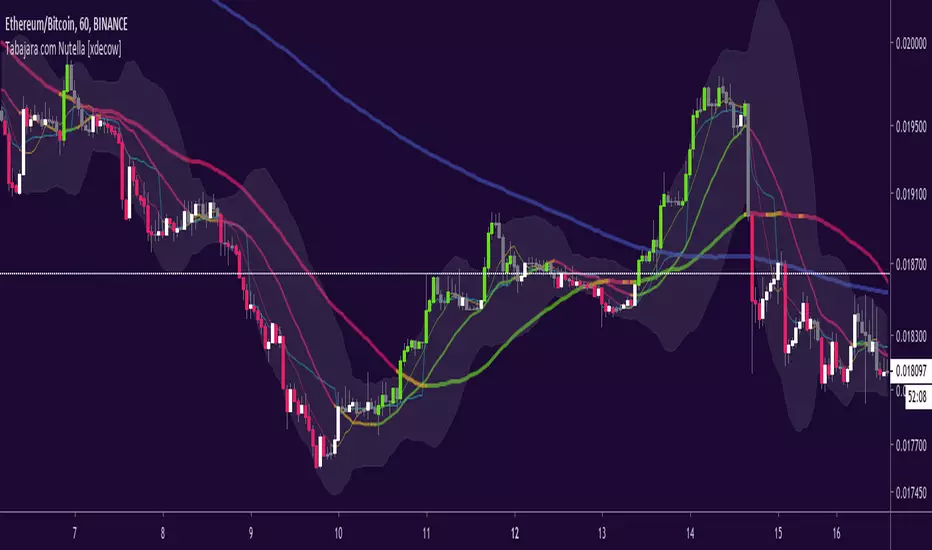
Tabajara com Nutella [xdecow]Tabajara setup from André Machado
-ma 8
-ma 20
-ma 50
-ma 200 (blue)
-vwap (aqua)
-bollinger bands
-barcolor based on tabajara rules
Yield Curve Version 2.55.2Welcome to Yield Curve Version 2.55.2
US10Y-US02Y
* Please read description to help understand the information displayed.
* NOTE - This script requires 1 real time update before accurate information is displayed, therefore WILL NOT display the correct information if the Bond Market is Closed over the Weekend.
* NOTE - When values are changed Via Input setting they do take a bit to display based off all the information that is required to display this script.
**FEATURES**
* Input Features let you view the information the way YOU like via Input Settings
* Displays Current Version Title - Toggleable On/Off via Input Settings - Default On
* Plots the Yield Curve of the Bonds listed (Middle Green and Red Line)
* Displays the Spread for each Bond (Top Green and Red Labels) - Toggleable On/Off via Input Settings - Change Size via Input Settings - Default On
* Displays the current Yield for each Bond (Bottom Green and Red Labels) - Toggleable On/Off via Input Settings - Change Size via Input Settings - Default On - Large Size
* Plots the Average of the Entire Yield Curve (BLUE Line within the Yield Curve) - Toggleable On/Off via Input Settings - Default On
* Displays messages based off Yield Inversions (Orange Text) - Toggleable On/Off via Input Settings - Default On if Applicable
* Displays 2 10 Inversion Warning Message (Orange Text) - Toggleable On/Off via Input Settings - Default On if Applicable
* Plots Column Data at the Bottom that tries to help determine the Stability of the Yield Curve (More information Below about Stability) - Toggleable On/Off via Input Settings - Default On
* Plots the 7,20 and 100 SMA of the STABILITY MAX OVERLOAD (More information Below about Stability Max Overload) - Toggleable On/Off via Input Settings - Default On for 100 SMA , 20 SMA and 7 SMA
* Ability to Display Indicator Name and Value via Input Settings - Default On - Displays Stability Max Overload SMA Labels. Toggleable to Non SMA Values. See Below.
**Bottom Columns are all about STABILITY**
* I have tried to come up with an algorithm that helps understand the Stability of the Yield Curve. There are 3 Sections to the Bottom Columns.
* Section 1 - STABILITY (Displayed as the lightest Green or Red Column) Values range from 0 to 1 where 1 equals the MOST UNSTABLE Curve and 0 equals the MOST STABLE Curve
* Section 2 - STABILITY OVERLOAD (Displayed just above the Stability Column a shade darker Green or Red Column)
* Section 3 - STABILITY MAX OVERLOAD (Displayed just above the Stability Overload Column a shade darker Green or Red Column)
What this section tries to do is help understand the Stability of the Curve based on the inversions data. Lower values represent a MORE STABLE curve. If the Yield Curve currently has 0 Inversions all Stability factors should equal 0 and therefore not plot any lower columns. As the Yield Curve becomes more inverted each section represents a value based off that data. GREEN columns represent a MORE Stable Curve from the resolution prior and vise versa.
(S SO SMO)
STABILITY - tests the current Stability of the Curve itself again ranging from 0 to 1 where 0 equals the MOST Stable Curve and 1 equals the MOST Unstable Curve.
STABILIY OVERLOAD - adds a value to STABLITY based off STABILITY itself.
STABILITY MAX OVERLOAD - adds the Entire value to STABILITY derived again from STABILITY.
This section also allows us to see the 7,20 and 100 SMA of the STABILITY MAX OVERLOAD which should always be the GREATEST of ALL STABILTY VALUES.
*Indicator Labels How to use*
Indicator Labels by default are turned On and will display Name and Value Labels for Stability Max Overload SMA values. To switch to (S SO SMO) Labels, toggle "Indicator Labels / SMO SMA Labels", via Input Settings. This button allows you to switch between the two Indicator Label Display options. You must have "Indicators" turned On to view the Labels and therefore is turned On by Default. To turn all of the Indicator Labels Off, simply disable "Indicators" via Input Settings.
Remember - All information displayed can be tuned On or Off besides the Curve itself. There are also other Features Accessible Via the Input Settings.
I will continue to update this script as there is more information I would like to gather and display!
I hope you enjoy,
OpptionsOnly

Yield Curve Version 2.41Welcome to Yield Curve Version 2.41
* Please read description to help understand the information displayed.
* NOTE - This script requires 1 real time update before accurate information is displayed, therefore WILL NOT display the correct information if the Bond Market is Closed over the Weekend.
* NOTE - When values are changed Via Input setting they do take a bit to display based off all the information that is required to display this script.
**FEATURES**
* Input Features let you view the information the way YOU like via Input Settings
* Displays Current Version Title - Toggleable On/Off via Input Settings - Default On
* Plots the Yield Curve of the Bonds listed (Middle Green and Red Line)
* Displays the Spread for each Bond (Top Green and Red Labels) - Toggleable On/Off via Input Settings - Change Size via Input Settings - Default On
* Displays the current Yield for each Bond (Bottom Green and Red Labels) - Toggleable On/Off via Input Settings - Change Size via Input Settings - Default On - Large Size
* Plots the Average of the Entire Yield Curve (BLUE Line within the Yield Curve) - Toggleable On/Off via Input Settings - Default On
* Displays messages based off Yield Inversions (Orange Text) - Toggleable On/Off via Input Settings - Default On if Applicable
* Displays 2 10 Inversion Warning Message (Orange Text) - Toggleable On/Off via Input Settings - Default On if Applicable
* Plots Column Data at the Bottom that tries to help determine the Stability of the Yield Curve (More information Below about Stability) - Toggleable On/Off via Input Settings - Default On
* Plots the 7,20 and 100 SMA of the STABILITY MAX OVERLOAD (More information Below about Stability Max Overload) - Toggleable On/Off via Input Settings - Default On for 100SMA Off for 7 and 20 SMA
**Bottom Columns are all about STABILITY**
* I have tried to come up with an algorithm that helps understand the Stability of the Yield Curve. There are 3 Sections to the Bottom Columns.
* Section 1 - STABILITY (Displayed as the lightest Green or Red Column) Values range from 0 to 1 where 1 equals the MOST UNSTABLE Curve and 0 equals the MOST STABLE Curve
* Section 2 - STABILITY OVERLOAD (Displayed just above the Stability Column a shade darker Green or Red Column)
* Section 3 - STABILITY MAX OVERLOAD (Displayed just above the Stability Overload Column a shade darker Green or Red Column)
What this section tries to do is help understand the Stability of the Curve based on the inversions data. Lower values represent a MORE STABLE curve. If the Yield Curve currently has 0 Inversions all Stability factors should equal 0 and therefore not plot any lower columns. As the Yield Curve becomes more inverted each section represents a value based off that data. GREEN columns represent a MORE Stable Curve from the resolution prior and vise versa.
STABILITY tests the current Stability of the Curve itself again ranging from 0 to 1 where 0 equals the MOST Stable Curve and 1 equals the MOST Unstable Curve.
STABILIY OVERLOAD adds a value to STABLITY based off STABILITY itself.
STABILITY MAX OVERLOAD adds the Entire value to STABILITY derived again from STABILITY.
This section also allows us to see the 7,20 and 100 SMA of the STABILITY MAX OVERLOAD which should always be the GREATEST of ALL STABILTY COLUMNS.
Remember - All information displayed can be tuned On or Off besides the Curve itself. There are also other Features Accessible Via the Input Settings.
I will continue to update this script as there is more information I would like to gather and display!
I hope you enjoy,
OpptionsOnly

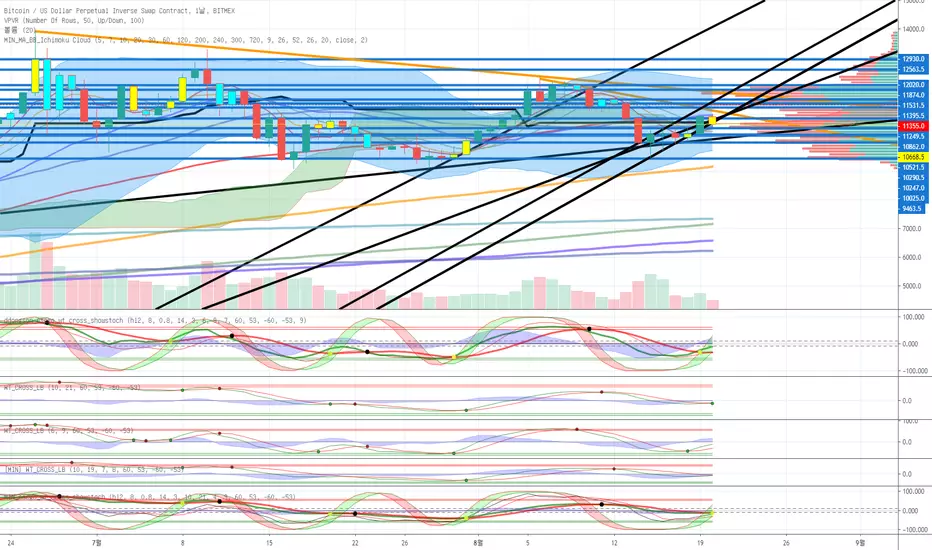
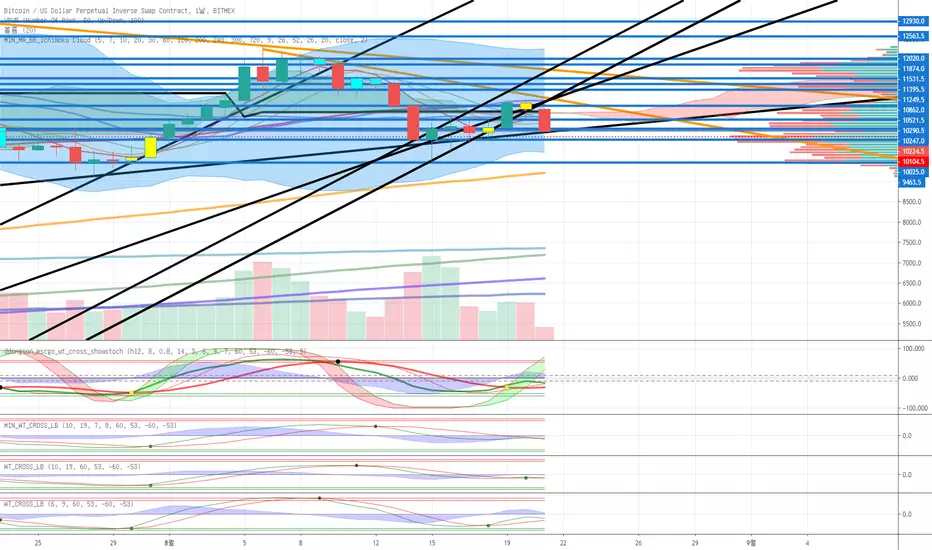
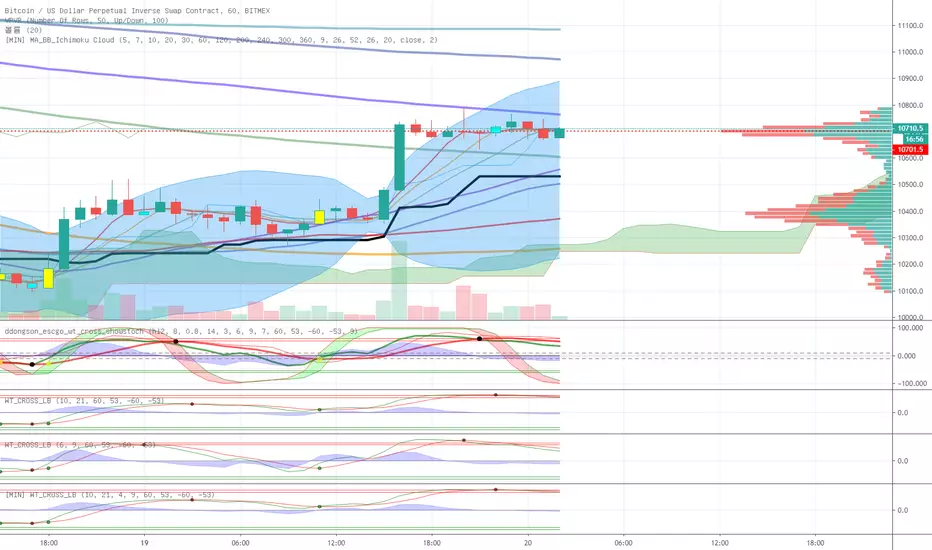
MIN_escgo_wt_cross_showstochehlers stochastic CG oscillator
wavetrend with crosses
slow stochastic
3가지 통합지표입니다.
원지않는 지표는 끌수있습니다.

Leeloo Quadruple (4x) Simple Moving AverageOne-stop shop for all of the simple moving averages because editing separately is annoying.

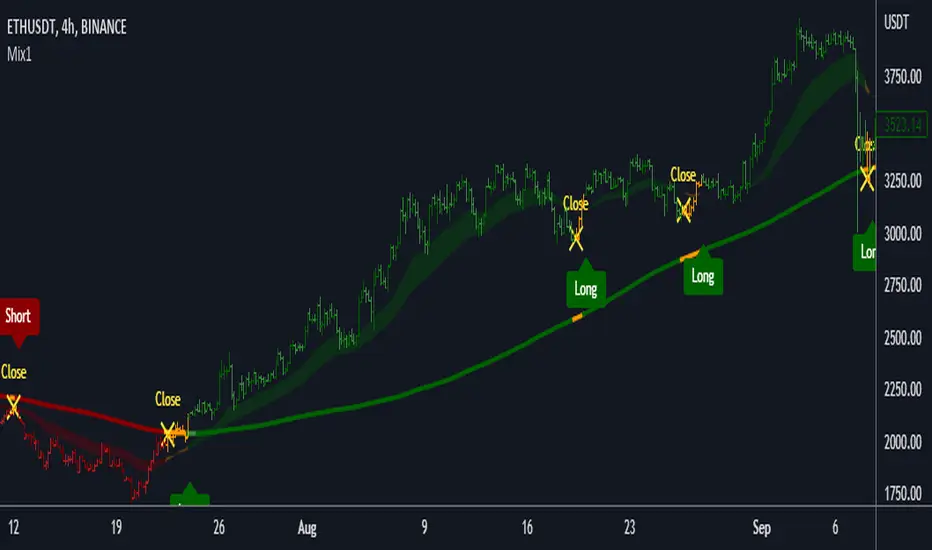
Mix1 : Ema Cross + Trend Channel [Gu5]Based on Trend Channel
Ema-crossover is added
Crossing alerts, only on trend
Basado en mi anterior indicador, Trend Channel
Se agrega Cruce de Medias Moviles (Ema-crossover)
Las alertas solo son en favor a la tendencia
El valor de SMA Range es arbitrario (No Backtesting). Cambia la amplitud de canal que determina cuando es rango (barras amarillas por estar muy cerca del SMA200, sin tendencia definida)
Range Multiplier adapta el indicador a distintos mercados
//Setting recommended for SMA Range
//BTCUSD = 100
//EURUSD = 1000
//SPX = 100
//ETHUSD = 10
Si te fue útil este indicador, puedes comprarme una cerveza ;)

M&Ms - Multiple Moving AveragesThe (M&Ms) Multiple Moving Average Crossing allows the investor identify trends in different time frames and indicates when to entry short or long.

Golden Cross by -Westy-Quick Guide
- Yellow cross and green MA on top = Potential uptrend
- Yellow cross and red MA on top = Potential downtrend
A simple golden cross indicator of the green 50 and red 200 SMA with a yellow cross for ease of visibility and backtesting.
Generally, longer time frames more powerful signals but are less frequent. I typically use it on the 4 hour, daily and weekly.

Trend Channel [Gu5]SMA 200 determines the trend
Bullish trend, green candles. Down trend, red candles.
If the market value is narrow to the SMA200 channel, yellow candles.
Setting recommended for SMA Range
BTCUSD = 100
EURUSD = 1000
SPX = 100
ETHUSD = 10

Triple Moving Average HeatmapHi everyone
I didn't publish on Friday because I was working on an Expert Advisor in MT4. The day I don't publish, some scripts spamming guys published many (not useful) scripts the same to kick me out of the TOP #1 ranking.
So what I'm going to do about it? crying or sharing more quality scripts than before? :)
I guess you know the answer :) I'm gonna share a few quality scripts that I have in my library. I noticed that you guys tend to like more the scripts useful for your trading actually making you money rather than a copy-paste (of another copy-paste)
Alright, enough for the trolling now let's introduce the Three MA heatmap which is an upgrade of that script : MA-heatmap-Double-cross-edition/
The challenge was to keep the heatmap not rolling and to make it match with the MA cross. I did it using this
```
since_ma_buy = barssince(macrossover)
since_ma_sell = barssince(macrossunder)
heatmap_color() =>
since_ma_buy < since_ma_sell ? color.new(color.green, 20) : since_ma_buy > since_ma_sell ? color.new(color.red, 20) : na
```
This is a technique that I found after drinking three glasses of red wine (#french) to keep the heatmap stable and not rolling.
To get what I'm saying I invite you to replace the piece of code above by what everyone would normally do
```
heatmap_color() =>
macrossunder() ? color.new(color.green, 20) : macrossover() ? color.new(color.red, 20) : na
```
Ah and I'm not done sharing for the day, a few scripts are coming also after that one and tonight !!!!! I want to live in a world where you guys can enjoy quality scripts (mostly) :)
PS
____________________________________________________________
Feel free to hit the thumbs up as it shows me that I'm not doing this for nothing and will motivate to deliver more quality content in the future.
- I'm an officially approved PineEditor/LUA/MT4 approved mentor on codementor. You can request a coaching with me if you want and I'll teach you how to build kick-ass indicators and strategies
Jump on a 1 to 1 coaching with me
- You can also hire for a custom dev of your indicator/strategy/bot/chrome extension/python

Triple Moving Average & Elder ImpulseThis is an updated version of my previous Triple Moving average script.
This one plots 3 moving averages + Elder impulse system.
The user has an option to choose from EMA or SMA.
User can also choose the length and source for moving averages.
The user also has an option to turn ON/OFF the use of the Elder impulse system.
All this utilizing the space for a single indicator. This is especially helpful for free users with a limit of only 3 indicators per chart.
This way you can add the 4 above + 2 more indicators of your choice.
Hope it helps.
