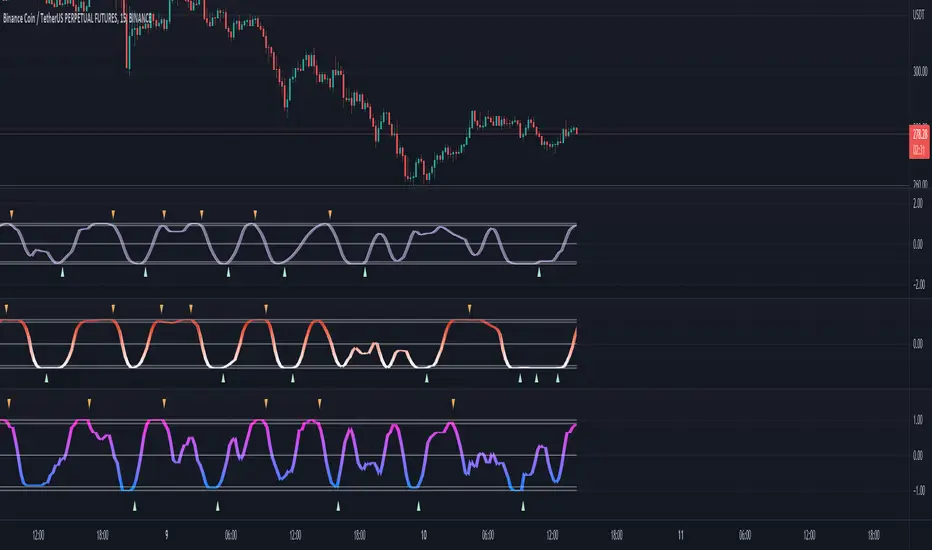
Smooth Stochastic and RSI ComboA lot of people run both stochastic and rsi on one chart so I figured I would make something that combines the two. This script takes both the rsi and the stochastic, smooths them both and then plots them both on top of each other. I have filled it to make an error range and I colored it with the direction of its mean. I hope this frees up some room on your screen! Enjoy!
ps this is not stochastic rsi, its both stochastic and rsi.
Oscillatore stocastico
Vector ScalerVector Scaler is like Stochastic but it uses a different method to scale the input. The method is very similar to vector normalization but instead of keeping the "vector" we just sum the three points and average them. The blue line is the signal line and the orange line is the smoothed signal line. I have added the "J" line from the KDJ indicator to help spot divergences. Differential mode uses the delta of the input for the calculations. Here are some pictures to help illustrate how this works relative to other popular indicators.
Vector Scaler vs Stochastic
Vector Scaler vs Smooth Stochastic RSI
average set to 100
average set to 200

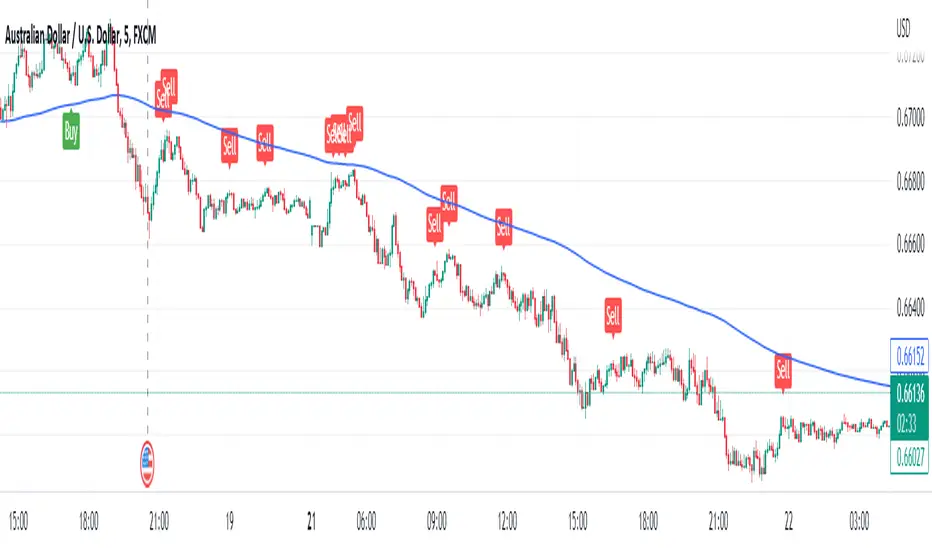
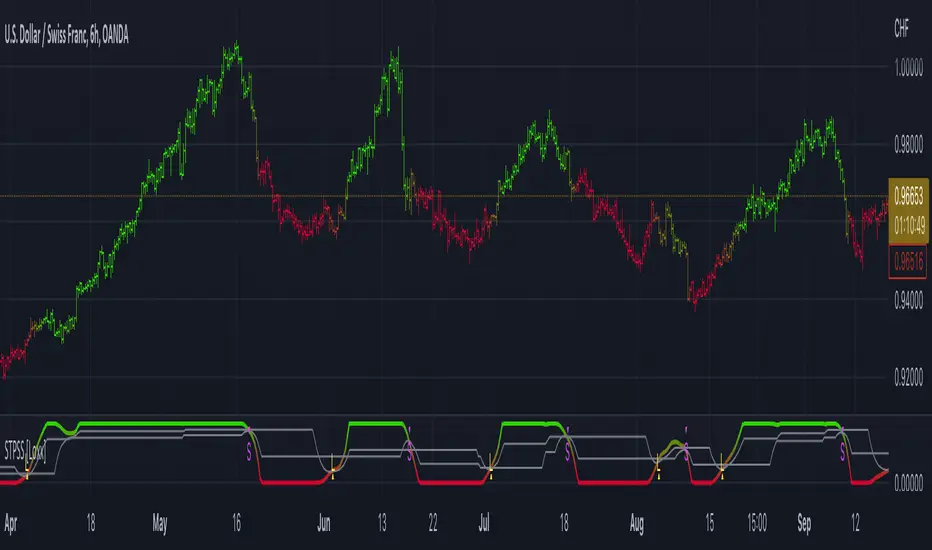
Stochastic Buy Sell with EMA TrendStochastic Buy Sell with EMA Trend is combination of two indicators only.
The Stochastic Oscillator ( STOCH ) is a range bound momentum oscillator. The Stochastic indicator is designed to display the location of the close compared to the high/low range over a user defined number of periods. Typically, the Stochastic Oscillator is used for three things; Identifying overbought and oversold levels, spotting divergences and also identifying bull and bear set ups or signals.
The Exponential Moving Average (EMA) is a specific type of moving average that points towards the importance of the most recent data and information from the market.
1) Stochastic - It is giving signal whenever cross happen in oversold or overbought zone.
2) EMA 200 - EMA 200 is used to identify market trend.
Long :
If stochastic giving buy signal and price is over 200 EMA.
Short :
If stochastic giving sell signal and price is below 200 EMA.
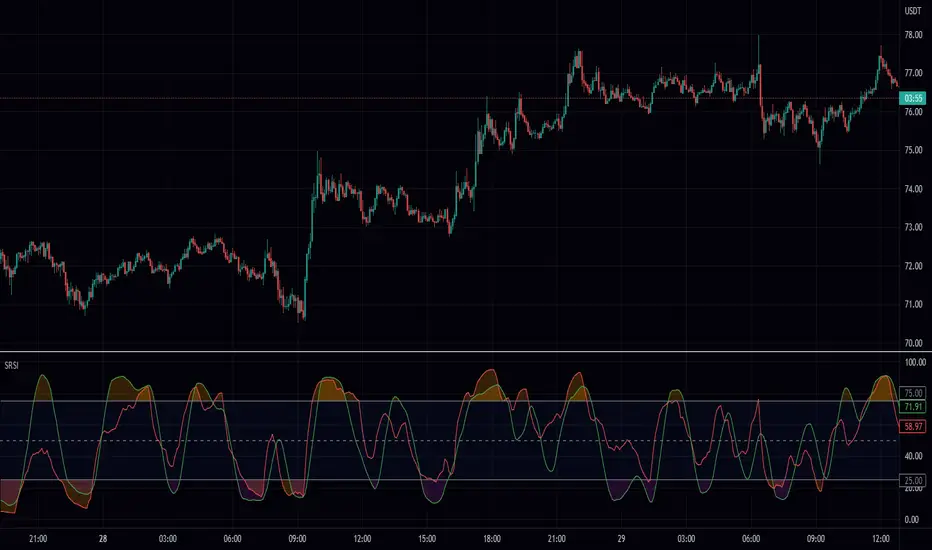
Stochastic Smooth Relative Strength Index (SSRSI)This is Stochastic RSI but it uses smoothed RSI instead. You use it the same as any other Stochastic RSI :)
The features in this scripts are: RSI Length, Extra Smoothing, Extra Smooth RSI Filter, Stochastic Length, and K and D.
I hope you find this release useful!
The Stochastic RSI indicator ( Stoch RSI ) is essentially an indicator of an indicator. It is used in technical analysis to provide a stochastic calculation to the RSI indicator. This means that it is a measure of RSI relative to its own high/low range over a user defined period of time. The Stochastic RSI is an oscillator that calculates a value between 0 and 1 which is then plotted as a line. This indicator is primarily used for identifying overbought and oversold conditions.

Delta StochasticThis is the Stochastic Oscillator but now instead of reading it raw we sum the stochastic over a window and then take the cumulative sum of the difference. This allows us to have a much smoother representation of the stochastic while seeing the true momentum relative to it. I hope you can find this useful!
Refresher on Stochastic: Stochastics are range bound momentum oscillators. They calculate values between 0 and 1 which are usually plotted as 2 lines. These indicators are primarily used for identifying overbought and oversold conditions, line crossovers, divergences and increases in buying or selling pressure.

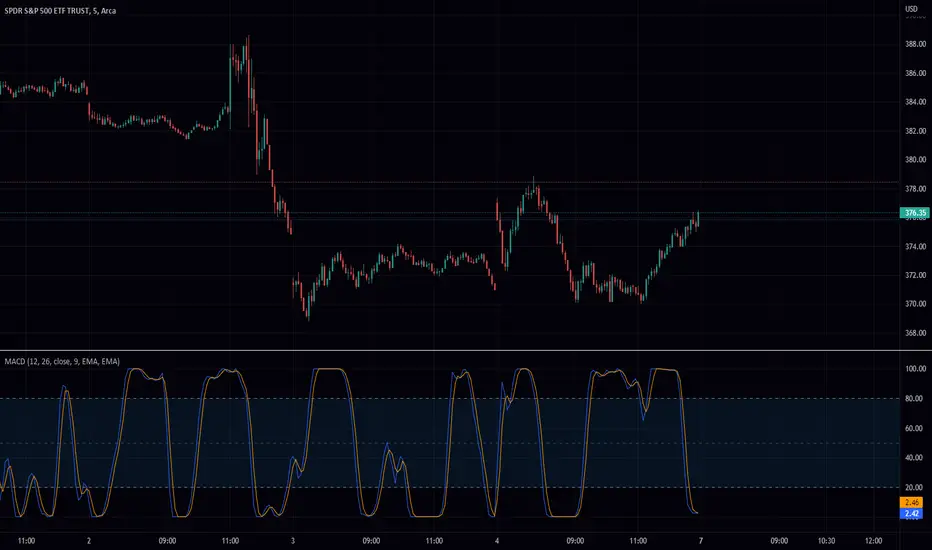
Stochastic Moving Average Convergence Divergence (SMACD)This is my attempt at making a Stochastic MACD indicator. To get this to work I have introduced a DC offset to the MACD histogram output. I figured that if theirs a Stochastic RSI their might as well be a Stochastic everything else! lmao enjoy. Honestly, from what I can tell it's even faster than Stochastic Smooth RSI.
The Stochastic Oscillator (STOCH) is a range bound momentum oscillator. The Stochastic indicator is designed to display the location of the close compared to the high/low range over a user defined number of periods. Typically, the Stochastic Oscillator is used for three things; Identifying overbought and oversold levels, spotting divergences and also identifying bull and bear set ups or signals
MACD is an extremely popular indicator used in technical analysis. MACD can be used to identify aspects of a security's overall trend. Most notably these aspects are momentum, as well as trend direction and duration. What makes MACD so informative is that it is actually the combination of two different types of indicators. First, MACD employs two Moving Averages of varying lengths (which are lagging indicators) to identify trend direction and duration. Then, MACD takes the difference in values between those two Moving Averages (MACD Line) and an EMA of those Moving Averages (Signal Line) and plots that difference between the two lines as a histogram which oscillates above and below a center Zero Line. The histogram is used as a good indication of a security's momentum
Stochastic CandlesIn this indicator I have transformed the %K line into adjustable candles. Because of this I have increased the length of the %D line to be more useful in this context. It is worth noting that you get the same momentum indication as %D set to 4 just because of the default candle transform setting. Incase you need to brush up on how stoch works here is the built in summery.
The Stochastic Oscillator (STOCH) is a range bound momentum oscillator. The Stochastic indicator is designed to display the location of the close compared to the high/low range over a user defined number of periods. Typically, the Stochastic Oscillator is used for three things; Identifying overbought and oversold levels, spotting divergences and also identifying bull and bear set ups or signals.

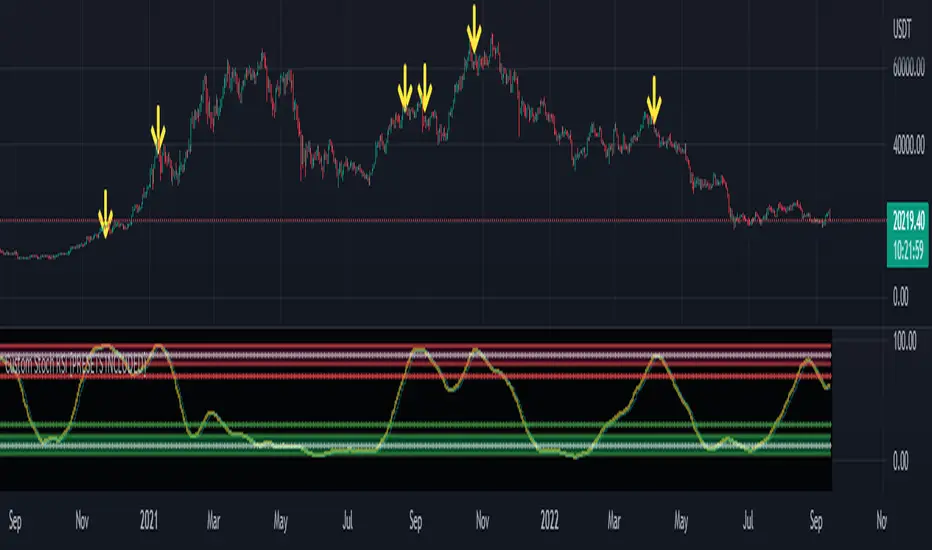
Global & local RSI / Flowly IndicatorsAs the terms global and local imply, global RSI describes broad relative strength, whereas local RSI describes local relative strength within the broad moves. A macro and micro view of relative strength so to speak. Global and local RSI are simply regular RSI and stochastic RSI. Local RSI extremes ( stochastic RSI oversold/overbought) often mark a pivot in RSI which naturally reflects to price. Local RSI extremes are visualized inside the global RSI bands (upper band for overbought, lower band for oversold) in a "heat map" style.
By default:
Stochastic RSI >= 75 = yellow
Stochastic RSI >= 87 = orange
Stochastic RSI >= 100 = pink
Users also have the ability smooth the RSI with their preferred smoothing method ( SMA , EMA , HMA , RMA, WMA ) and length. This leads to different behavior in RSI, rendering the typical RSI extremes (> 70 or < 30) suboptimal or even useless. By enabling adaptive bands, the extremes are readjusted based on typical RSI pivot points (median pivots ), which gives much more relevant reference points for oversold/overbought conditions in both global and local RSI. This feature can be used without smoothing, but it rarely provides a meaningful difference, unless the RSI calculation length is messed with.
Global RSI can be plotted as candles, bars or a line. Candles and bars can be useful for detecting rejections (wicks) in relative strength, the same you would with OHLC data. Sometimes there are "hidden rejections" that are visible in relative strength but not on OHLC data, which naturally gives an advantage. All colors can be adjusted in the input menu. You also have a real-time view of the current RSI states in top right corner. Available alerts are the following: global RSI overbought, global RSI oversold, local RSI overbought and local RSI oversold.

Multi-Indicator Divergence ScreenerHere is a new screener for everyone.
I have applied my Better Divergence On Any Indicator logic to scan 3 different indicators and up to 6 different assets at one time. Shoutout to LonesomeTheBlue and QuantNomad for their respective work on divergence and scanner scripts. I've implemented similar logic to put together this scanner.
So far, I have added support for RSI, OBV, MACD, MFI, Stochastic, and FSR, though I'm happy to add more by request. Please note, for simplicity, I have removed the logic to filter for only overbought/oversold divergences. Because this can scan both centered oscillators and non-centered indicators, overbought/oversold does not apply to all of them. I may try to find a way to work in back in later, as time allows.
Personally, I like to find confluences different types of indicators. For instance, agreeable divergence with a centered strength oscillator like RSI and a volume based indicator like OBV gives me more confidence that there will be follow-through.
Like in the Better Divergence script, you can opt to scan for confirmed divergences, potential divergences, or both.
You have the option to show or hide a table that will tell you exactly which assets have divergence, on which indicator they were found, and how many points of divergence were identified. By default, bull divergences will be green, bear will be red, but you can change these base colors to your liking. Confirmed divergences are shown with a solid background, while potentials (if selected) are shown with transparent background. If all 3 of your chosen indicators have divergence in the same direction, the asset name will show in the bull or bear color to highlight the confluence.
Alerts have also been set up to fire on bar close. The message will essentially tell you the same thing the table does, but in condensed format.
You can choose to have alerts fire any time there is any divergence detected across all assets, only when there are divergences on at least 2 of the chosen indicators for a given asset, or limit them to only when all 3 indicators show divergence in agreement.

Adaptive Fisherized Stochastic Center of GravityIntroduction
I modified the script "Fisher Stochastic Center of Gravity" of @DasanC for this indicator.
I added inverse Fisher transform, cycle period adaptiveness mode (Ehlers) and smoothing to it.
Moreover, I added buy and sell and beautified some stuff.
Lastly, it is also non-repainting!
Usage
This indicator can be used like a normal stochastic, but I don't recommend divergence analysis on it.
That fisherization stuff seems to make the graphs unuseable for that because it tries.
It works well on every timeframe I would say, but lower timeframes are recommended, because of the fast nature of stochastic.
Usually it does a good job on entry confirmation for reversals and trend continuation trades.
Recommended indicator to combine with this indicator is RSI cyclic smoothed v2 .
This is the best RSI version I know. In trending market it is recommended to look more on the inner bands and in flat market it is recommended to look more on the outer bands.
When RSI shows oversold and this indicator shows a crossover of the Center of Gravity plot through the bottom line -> Long entry is confirmed
When RSI shows overbought and this indicator shows a crossunder of the Center of Gravity plot through the top line -> Short entry is confirmed
Settings
The adaptive mode is enabled by default to give you straight the whole indicator experience.
The default settings are optimized, but should be changed depending on the market.
An example:
Market has a low volatility and a high momentum -> I want a slower/higher length to catch the slower new highs and lows.
Market has higher volatility and a low momentum, -> I want a faster/lower length to catch the faster new highs and lows
Signals
Crossover
Buy -> cog crossover signalLine
Sell -> cog crossunder signalLine
Overbought/Oversold Crossover
Buy -> cog crossover lowerBand
Sell -> cog crossunder lowerBand
I use this indicator a lot, because I don't know a better stochastic on this community here.
@DasanC did an awesome work with his version I used as base for this script.
Enjoy this indicator and let the profit roll! 🔥
MTF Fantastic Stochastic (FS+)MTF Fantastic Stochastic (FS+) + Alerts
This chart overlay indicator can signal multiple triple-timeframe Stochastic RSI overbought and oversold confluences directly onto your chart, intended for use as a confluence either for reversal trade entries, or potential trade exits, indicating where price may be probable to reverse.
Features include:
- Primary set of fully configurable triple-timeframe overbought and oversold signals, indicating where 3 selected timeframes are all overbought or all oversold at the same time. Enabled by default.
- Secondary set of fully configurable triple-timeframe overbought and oversold signals, indicating where 3 selected timeframes are all overbought or all oversold at the same time, with alert option. Enabled by default.
- Also includes standard configurable Stoch RSI options, including k length, d length, RSI length, Stochastic length, etc.
- The default primary MTF #1 timeframes are set to 1minute, 5minute and 15minute. These are highly suitable for low timeframe scalpers trading on charts less than 5 minutes, and can often pin point price reversals.
- The default Secondary MTF #2 timeframes are set to 15minute, 30minute and 60minute. These are suitable for both low timeframe scalpers and considerably higher timeframe traders.
- Optional drawing of background colours and/or ribbon seen at bottom of the chart.
- Fully configurable timeframes, as well as overbought and oversold threshold levels for each individual timeframe. Overbought and oversold thresholds are set to the factory 80 and 20 levels respectively for all timeframes by default.
- Alert features for both MTF #1 and MTF #2 triple-timeframe confluences, including options for alerting overbought and oversold individually, as well as an option for alerting either overbought or oversold in a single alert.
Note: THe features listed above are accurate at the time of publishing but maybe updated or added to in future.
The Stochastic RSI
The popular oscillator has been described as follows:
“The Stochastic RSI is an indicator used in technical analysis that ranges between zero and one (or zero and 100 on some charting platforms) and is created by applying the Stochastic oscillator formula to a set of relative strength index ( RSI ) values rather than to standard price data. Using RSI values within the Stochastic formula gives traders an idea of whether the current RSI value is overbought or oversold. The Stochastic RSI oscillator was developed to take advantage of both momentum indicators in order to create a more sensitive indicator that is attuned to a specific security's historical performance rather than a generalized analysis of price change.”
How do traders use overbought and oversold levels in their trading?
The oversold level, that is when the Stochastic RSI is above the 80 level is typically interpreted as being 'overbought', and below the 20 level is typically considered 'oversold'. Traders will often use the Stochastic RSI at an overbought level as a confluence for entry into a short position, and the Stochastic RSI at an oversold level as a confluence for an entry into a long position. These levels do not mean that price will necessarily reverse at those levels in a reliable way, however. This is why this version of the Stoch RSI employs the triple timeframe overbought and oversold confluence, in an attempt to add a more confluence and reliability to this usage of the Stoch RSI.
This indicator was originally built as one of a many features included in the RF+ Divergence Scalping System and has been separated into it's own standalone indicator here for traders who do not want the many other features bundled into the original indicator. A number of features that exist in the original were intensive, and also quite niche. Therefore this lightweight single purpose chart overlay indicator offers this versatile feature of the ever popular Stochastic RSI to a wider audience of traders who may add it to various strategies.

RF+ Divergence Scalping SystemRF+ Divergence Scalping System + Custom Signals + Alerts.
This chart overlay indicator has been developed for the low timeframe divergence scalper.
Built upon the realtime divergence drawing code from the Divergence for Many indicator originally authored by Lonsometheblue, this chart overlay indicator bundles several additional unique features and modifications to serve as an all-in-one divergence scalping system. The current key features at the time of publishing are listed below (features are optional and can be enabled or disabled):
- Fully configurable realtime divergence drawing and alerting feature that can draw divergences directly on the chart using data sourced from up to 11 oscillators selected by the user, which have been included specifically for their ability to detect divergences, including oscillators not presently included in the original Divergence for Many indicator, such as the Ultimate Oscillator and TSI.
- Optional on chart table showing a summary of key statuses of various indicators, and nearby divergences.
- 2 x Range Filters with custom settings used for low timeframe trend detection.
- 3 x configurable multi-timeframe Stochastic RSI overbought and oversold signals with presentation options.
- On-chart pivot points drawn automatically.
- Automatically adjusted pivot period for up to 4 configurable time frames to fine tune divergences drawn for optimal divergence detection.
- Real-price line for use with Heikin Ashi candles, with styling options.
- Real-price close dots for use with Heikin Ashi candles, with styling options.
- A selection of custom signals that can be printed on-chart and alerted.
- Sessions indicator for the London, New York, Tokyo and Sydney trading sessions, including daylight savings toggle, and unique ‘invert background color’ option, which colours the entire chart - except the trading session you have selected, leaving your chart clear of distracting background color.
- Up to 4 fully configurable moving averages.
- Additional configurable settings for numerous built in indicators, allowing you to alter the lengths and source types, including the UO, TSI, MFI, TSV, 2 x Range Filters.
- Configurable RSI Trend detection signal filter used in a number of the signals, which filters buy signals where the RSI is over the RSI moving average, and only prints sell signals where RSI is under the moving average.
- Customisable on-chart watermark, with inputs for a custom title, subtitle, and also an optional symbol | timeframe | date feature.
The Oscillators able to be selected for use in drawing divergences at the time of publishing are as follows:
- Ultimate Oscillator (UO)
- True Strength Indicator (TSI)
- Money Flow Index (MFI)
- Cumulative Delta Volume (CDV)
- Time Segmented Volume (TSV)
- Commodity Channel Index (CCI)
- Awesome Oscillator
- Relative Strength Index (RSI)
- Stochastic
- On Balance Volume (OBV)
- MACD Histogram
What are divergences?
Divergence is when the price of an asset is moving in the opposite direction of a technical indicator, such as an oscillator, or is moving contrary to other data. Divergence warns that the current price trend may be weakening, and in some cases may lead to the price changing direction.
There are 4 main types of divergence, which are split into 2 categories;
regular divergences and hidden divergences. Regular divergences indicate possible trend reversals, and hidden divergences indicate possible trend continuation.
Regular bullish divergence: An indication of a potential trend reversal, from the current downtrend, to an uptrend.
Regular bearish divergence: An indication of a potential trend reversal, from the current uptrend, to a downtrend.
Hidden bullish divergence: An indication of a potential uptrend continuation.
Hidden bearish divergence: An indication of a potential downtrend continuation.
Setting alerts.
With this indicator you can set alerts to notify you when any/all of the above types of divergences occur, on any chart timeframe you choose, also when the triple timeframe Stochastic RSI overbought and oversold confluences occur, as well as when custom signals are printed.
Configurable pivot period values.
You can adjust the default pivot period values to suit your prefered trading style and timeframe. If you like to trade a shorter time frame, lowering the default lookback values will make the divergences drawn more sensitive to short term price action. By default, this indicator has enabled the automatic adjustment of the pivot periods for 4 configurable time frames, in a bid to optimize the divergences drawn when the indicator is loaded onto any of the 4 time frames selected. These time frames and their associated pivot periods can be fully reconfigured within the settings menu. By default, these have been further optimized for the low timeframe scalper trading on the 1-15 minute time frames.
How do traders use divergences in their trading?
A divergence is considered a leading indicator in technical analysis , meaning it has the ability to indicate a potential price move in the short term future.
Hidden bullish and hidden bearish divergences, which indicate a potential continuation of the current trend are sometimes considered a good place for traders to begin, since trend continuation occurs more frequently than reversals, or trend changes.
When trading regular bullish divergences and regular bearish divergences, which are indications of a trend reversal, the probability of it doing so may increase when these occur at a strong support or resistance level . A common mistake new traders make is to get into a regular divergence trade too early, assuming it will immediately reverse, but these can continue to form for some time before the trend eventually changes, by using forms of support or resistance as an added confluence, such as when price reaches a moving average, the success rate when trading these patterns may increase.
Typically, traders will manually draw lines across the swing highs and swing lows of both the price chart and the oscillator to see whether they appear to present a divergence, this indicator will draw them for you, quickly and clearly, and can notify you when they occur.
How do traders use overbought and oversold levels in their trading?
The oversold level is when the Stochastic RSI is above the 80 level is typically interpreted as being 'overbought', and below the 20 level is typically considered 'oversold'. Traders will often use the Stochastic RSI at, or crossing down from an overbought level as a confluence for entry into a short position, and the Stochastic RSI at, or crossing up from an oversold level as a confluence for an entry into a long position. These levels do not mean that price will necessarily reverse at those levels in a reliable way, however. This is why this version of the Stoch RSI employs the triple timeframe overbought and oversold confluence, in an attempt to add a more confluence and reliability to this usage of the Stoch RSI.
This indicator is intended for use in conjunction with related panel indicators including the TSI+ (True Strength Indicator + Realtime Divergences), UO+ (Ultimate Oscillator + Realtime Divergences), and optionally the STRSI+ (MTF Stochastic RSI + Realtime Divergences) and MFI+ (Money Flow Index + Realtime Divergences) available via this authors’ Tradingview profile, under the scripts section. The realtime divergence drawing code will not identify all divergences, so it is suggested that you also have panel indicators to observe. Each panel indicator also offers additional means of entry confirmation into divergence trades, for example, the Stochastic can indicate when it is crossing down from overbought or up from oversold, the TSi can indicate when the 2 TSI bands cross over one another upward or downward, and the UO and MFI can indicate an entry confluence when they are nearing, or crossing their centerlines, for more confidence in your divergence trade entries.
Additional information on the settings for this indicator can be found via the tooltips within the settings menu itself. Further information on feature updates, and usage tips & tricks will be added to the comments section below in due course.
Disclaimer: This indicator uses code adapted from the Divergence for Many v4 indicator authored by Lonesometheblue, and several stock indicators authored by Tradingview. With many thanks.

MTF Stoch RSI + Realtime DivergencesMulti-timeframe Stochastic RSI + Realtime Divergences + Alerts + Pivot lookback periods.
This version of the Stochastic RSI adds the following additional features to the stock UO by Tradingview:
- Optional 3 x Multiple-timeframe overbought and oversold signals, indicating where 3 selected timeframes are all overbought (>80) or all oversold (<20) at the same time, with alert option.
- Optional divergence lines drawn directly onto the oscillator in realtime, with alert options.
- Configurable lookback periods to fine tune the divergences drawn in order to suit different trading styles and timeframes, including the ability to enable automatic adjustment of pivot period per chart timeframe.
- Alternate timeframe feature allows you to configure the oscillator to use data from a different timeframe than the chart it is loaded on.
- Indications where the Stoch RSI is crossing down from above the overbought threshold (<80) and crossing above the oversold threshold (>20) levels on a given user selected timeframe, by printing gold dots on the indicator.
- Also includes standard configurable Stoch RSI options, including k length, d length, RSI length, Stochastic length, and source type (close, hl2, etc)
While this version of the Stochastic RSI has the ability to draw divergences in realtime along with related settings and alerts so you can be notified as divergences occur without spending all day watching the charts, the main purpose of this indicator was to provide the triple multiple-timeframe overbought and oversold confluence signals and alerts, in an attempt to add more confluence, weight and reliability to the single timeframe overbought and oversold states, commonly used for trade entry confluence. It's primary purpose is intended for scalping on lower timeframes, typically between 1-15 minutes. The triple timeframe overbought can often indicate near term reversals to the downside, with the triple timeframe oversold often indicating neartime reversals to the upside. The default timeframes for this confluence are set to check the 1 minute, 5 minute, and 15 minute timeframes, ideal for scalping the < 15 minute charts.
The Stochastic RSI
The popular oscillator has been described as follows:
“The Stochastic RSI is an indicator used in technical analysis that ranges between zero and one (or zero and 100 on some charting platforms) and is created by applying the Stochastic oscillator formula to a set of relative strength index (RSI) values rather than to standard price data. Using RSI values within the Stochastic formula gives traders an idea of whether the current RSI value is overbought or oversold. The Stochastic RSI oscillator was developed to take advantage of both momentum indicators in order to create a more sensitive indicator that is attuned to a specific security's historical performance rather than a generalized analysis of price change.”
How do traders use overbought and oversold levels in their trading?
The oversold level, that is when the Stochastic RSI is above the 80 level is typically interpreted as being 'overbought', and below the 20 level is typically considered 'oversold'. Traders will often use the Stochastic RSI at an overbought level as a confluence for entry into a short position, and the Stochastic RSI at an oversold level as a confluence for an entry into a long position. These levels do not mean that price will necessarily reverse at those levels in a reliable way, however. This is why this version of the Stoch RSI employs the triple timeframe overbought and oversold confluence, in an attempt to add a more confluence and reliability to this usage of the Stoch RSI.
What are divergences?
Divergence is when the price of an asset is moving in the opposite direction of a technical indicator, such as an oscillator, or is moving contrary to other data. Divergence warns that the current price trend may be weakening, and in some cases may lead to the price changing direction.
There are 4 main types of divergence, which are split into 2 categories;
regular divergences and hidden divergences. Regular divergences indicate possible trend reversals, and hidden divergences indicate possible trend continuation.
Regular bullish divergence: An indication of a potential trend reversal, from the current downtrend, to an uptrend.
Regular bearish divergence: An indication of a potential trend reversal, from the current uptrend, to a downtrend.
Hidden bullish divergence: An indication of a potential uptrend continuation.
Hidden bearish divergence: An indication of a potential downtrend continuation.
Setting alerts.
With this indicator you can set alerts to notify you when any/all of the above types of divergences occur, on any chart timeframe you choose, and also when the triple timeframe overbought and oversold confluences occur.
Configurable pivot lookback values.
You can adjust the default pivot lookback values to suit your prefered trading style and timeframe. If you like to trade a shorter time frame, lowering the default lookback values will make the divergences drawn more sensitive to short term price action. By default, this indicator has enabled the automatic adjustment of the pivot periods for 4 configurable timeframes, in a bid to optimise the divergences drawn when the indicator is loaded onto any of the 4 timeframes. These timeframes and the auto adjusted pivot periods on each of them can also be reconfigured within the settings menu.
How do traders use divergences in their trading?
A divergence is considered a leading indicator in technical analysis , meaning it has the ability to indicate a potential price move in the short term future.
Hidden bullish and hidden bearish divergences, which indicate a potential continuation of the current trend are sometimes considered a good place for traders to begin, since trend continuation occurs more frequently than reversals, or trend changes.
When trading regular bullish divergences and regular bearish divergences, which are indications of a trend reversal, the probability of it doing so may increase when these occur at a strong support or resistance level . A common mistake new traders make is to get into a regular divergence trade too early, assuming it will immediately reverse, but these can continue to form for some time before the trend eventually changes, by using forms of support or resistance as an added confluence, such as when price reaches a moving average, the success rate when trading these patterns may increase.
Typically, traders will manually draw lines across the swing highs and swing lows of both the price chart and the oscillator to see whether they appear to present a divergence, this indicator will draw them for you, quickly and clearly, and can notify you when they occur.
Disclaimer: This script includes code from the stock UO by Tradingview as well as the Divergence for Many Indicators v4 by LonesomeTheBlue.

DMI Stochastic Momentum IndexConcepts
This is an improved version of the "DMI Stochastic Extreme Refurbished" indicator.
For more information on the main concepts of this indicator, please access this link:
The difference is that here, instead of using the traditional stochastic oscillator, I implemented the use of the Stochastic Momentum Index (SMI).
Stochastic Momentum Index (SMI)
The SMI is considered a refinement of the stochastic oscillator.
It calculates the distance of the current closing price as it relates to the median of the high/low range of price.
William Blau developed the SMI, which attempts to provide a more reliable indicator, less subject to false swings.
The original stochastic is limited to values from 0 to 100, while the SMI varies between the range of -100 to 100.
(Investopedia)
It is worth mentioning that the SMI presented in this script applies to the DMI value, not the screen price.

Open Interest StochasticStochastic Money Flow Index(MFI) using open interest instead of volume.
Open Interest data for Binance, Bitmex, and Kraken

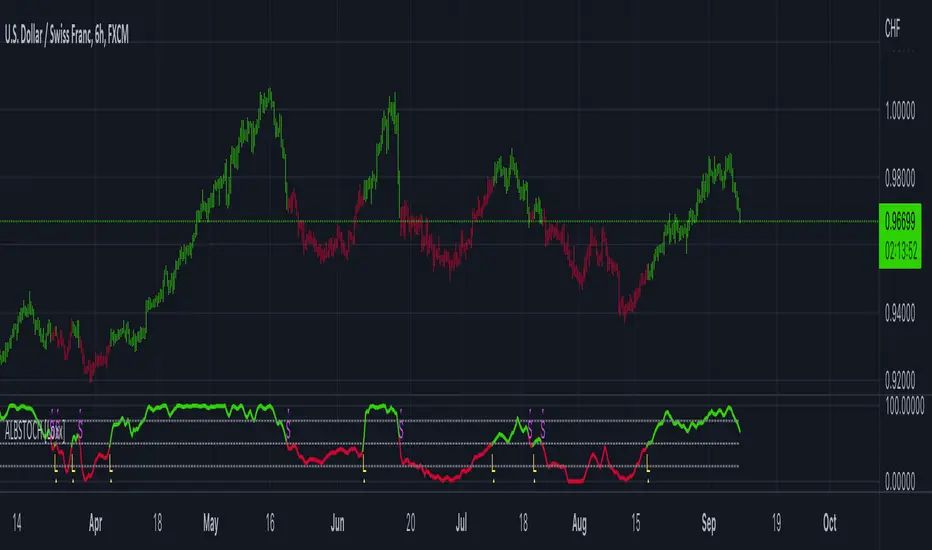
Stochastic of Two-Pole SuperSmoother [Loxx]Stochastic of Two-Pole SuperSmoother is a Stochastic Indicator that takes as input Two-Pole SuperSmoother of price. Includes gradient coloring and Discontinued Signal Lines signals with alerts.
What is Ehlers ; Two-Pole Super Smoother?
From "Cycle Analytics for Traders Advanced Technical Trading Concepts" by John F. Ehlers
A SuperSmoother filter is used anytime a moving average of any type would otherwise be used, with the result that the SuperSmoother filter output would have substantially less lag for an equivalent amount of smoothing produced by the moving average. For example, a five-bar SMA has a cutoff period of approximately 10 bars and has two bars of lag. A SuperSmoother filter with a cutoff period of 10 bars has a lag a half bar larger than the two-pole modified Butterworth filter.Therefore, such a SuperSmoother filter has a maximum lag of approximately 1.5 bars and even less lag into the attenuation band of the filter. The differential in lag between moving average and SuperSmoother filter outputs becomes even larger when the cutoff periods are larger.
Market data contain noise, and removal of noise is the reason for using smoothing filters. In fact, market data contain several kinds of noise. I’ll group one kind of noise as systemic, caused by the random events of trades being exercised. A second kind of noise is aliasing noise, caused by the use of sampled data. Aliasing noise is the dominant term in the data for shorter cycle periods.
It is easy to think of market data as being a continuous waveform, but it is not. Using the closing price as representative for that bar constitutes one sample point. It doesn’t matter if you are using an average of the high and low instead of the close, you are still getting one sample per bar. Since sampled data is being used, there are some dSP aspects that must be considered. For example, the shortest analysis period that is possible (without aliasing)2 is a two-bar cycle.This is called the Nyquist frequency, 0.5 cycles per sample.A perfect two-bar sine wave cycle sampled at the peaks becomes a square wave due to sampling. However, sampling at the cycle peaks can- not be guaranteed, and the interference between the sampling frequency and the data frequency creates the aliasing noise.The noise is reduced as the data period is longer. For example, a four-bar cycle means there are four samples per cycle. Because there are more samples, the sampled data are a better replica of the sine wave component. The replica is better yet for an eight-bar data component.The improved fidelity of the sampled data means the aliasing noise is reduced at longer and longer cycle periods.The rate of reduction is 6 dB per octave. My experience is that the systemic noise rarely is more than 10 dB below the level of cyclic information, so that we create two conditions for effective smoothing of aliasing noise:
1. It is difficult to use cycle periods shorter that two octaves below the Nyquist frequency.That is, an eight-bar cycle component has a quantization noise level 12 dB below the noise level at the Nyquist frequency. longer cycle components therefore have a systemic noise level that exceeds the aliasing noise level.
2. A smoothing filter should have sufficient selectivity to reduce aliasing noise below the systemic noise level. Since aliasing noise increases at the rate of 6 dB per octave above a selected filter cutoff frequency and since the SuperSmoother attenuation rate is 12 dB per octave, the Super- Smoother filter is an effective tool to virtually eliminate aliasing noise in the output signal.
What are DSL Discontinued Signal Line?
A lot of indicators are using signal lines in order to determine the trend (or some desired state of the indicator) easier. The idea of the signal line is easy : comparing the value to it's smoothed (slightly lagging) state, the idea of current momentum/state is made.
Discontinued signal line is inheriting that simple signal line idea and it is extending it : instead of having one signal line, more lines depending on the current value of the indicator.
"Signal" line is calculated the following way :
When a certain level is crossed into the desired direction, the EMA of that value is calculated for the desired signal line
When that level is crossed into the opposite direction, the previous "signal" line value is simply "inherited" and it becomes a kind of a level
This way it becomes a combination of signal lines and levels that are trying to combine both the good from both methods.
In simple terms, DSL uses the concept of a signal line and betters it by inheriting the previous signal line's value & makes it a level.
Included:
Bar coloring
Alerts
Signals
Loxx's Expanded Source Types
STOCASTIC RSI WITH ALARMS
I added alarms for buying and selling. I just did because ı wanted to see the alarm on the chart. I hope ıt will work it for you.

Customisable Stoch RSI [10 PRESETS INCLUDED]Customisable Stochastic by Nicholas Kormanik
A stochastic oscillator is a momentum indicator comparing a particular closing price of a security to a range of its prices over a certain period of time.
The sensitivity of the oscillator to market movements is reducible by adjusting that time period or by taking a moving average of the result.
It is used to generate overbought and oversold trading signals, utilizing a 0–100 bounded range of values.
In this version we have 4 levels
top levels are
95 - extra overbought
80 - semi-extra overbought
70 - standart overbought
bottom levels are
5 - extra oversold
20 - semi-extra oversold
30 - standart oversold
Message by Nicholas Kormanik :
" The formula I've adopted was put on the Silicon Investor web site thread by
'bdog'. Basically, I just leave the Slowing Periods (mp3) to 1, so it
really plays no part in things. However, if somebody presents a good
argument for using other than 1 ... hey, I'm amenable.
Chande, the original inventor, didn't use a moving average on the whole
thing. Chande's result was therefore sort of choppy. I guess along the way
people decided to add the EMA Periods to smooth things out. "
There are 10 presets, try to find your best!
1. 5 -- 5 -- 3
2. 8 -- 8 -- 5
3. 13 -- 13 -- 13
4. 21 -- 15 -- 13
5. 21 -- 21 -- 13
6. 34 -- 34 -- 13
7. 55 -- 55 -- 21
8. 89 -- 13 -- 34
9. 89 -- 89 -- 21
10. 233 -- 233 -- 34
On the chart im using 9th preset and the timeframe is daily on BTCUSD pair.
*DISCLAIMER*
Use this indicator for educational purpose only, i don't recommend you to use it to trade for real money!
Step-MA Filtered Stochastic [Loxx]Step-MA Filtered Stochastic is a stochastic indicator with step moving average filtering. This smooths the signal by filtering out noise.
What is the Stochastic Indicator?
The stochastic oscillator, also known as stochastic indicator, is a popular trading indicator that is useful for predicting trend reversals. It also focuses on price momentum and can be used to identify overbought and oversold levels in shares, indices, currencies and many other investment assets.
The stochastic oscillator measures the momentum of price movements. Momentum is the rate of acceleration in price movement. The idea behind the stochastic indicator is that the momentum of an instrument’s price will often change before the price movement of the instrument actually changes direction. As a result, the indicator can be used to predict trend reversals.
The stochastic indicator can be used by experienced traders and those learning technical analysis. With the help of other technical analysis tools such as moving averages, trendlines and support and resistance levels, the stochastic oscillator can help to improve trading accuracy and identify profitable entry and exit points.
Included:
Bar coloring
3 signal variations w/ alerts
Loxx's Expanded Source Types

Mulitiple time frame Slow Stochastic JamilaThis is a very useful Multiple time frame Slow Stochastic for traders who which to entry and exit when the slow stochastic of the different time frame are all in sync.
How to use this indicator. Only entry long when the day, 3day, weekly, monthly stochastic are going up. Exit when the day or 3day stochastic reaches 80% level.

Adaptive-Lookback Stochastic [Loxx]Adaptive-Lookback Stochastic is an adaptive stochastic indicator.
The Adaptive lookback is truly a market-driven period input used to determine the variable lookback period for many different indicators, instead of a traditional, fixed figure.
It is based on the frequency of market swings - the time between swing highs or swing lows. A swing high is defined as two consecutive higher highs followed by two consecutive lower highs; a swing low is defined by two consecutive lower lows followed by two consecutive higher lows. As swing points typically accompany reversals, they occur more frequently in choppier and volatile markets than in trends.
Adaptive lookback period is determined as :
Determine the initial number of swing points (swing count parameter) to use in the calculation.
Count the number of price bars it takes for the n swing points to form.
Divide step 2 by step 1 and round the result.
As an addition, adjust the "speed" of the produced period using the speed parameter - the smaller the speed parameter, the "slower" the average, and vice versa
Included
Bar coloring
Loxx Expanded Source Types
3 types of signals: levels crosses, slope, and middle crosses
Alerts
RSI + MA, LinReg, ZZ (HH HL LH LL), Div, Ichi, MACD and TSI HistRelative Strength Index with Moving Average, Linear Regression, Zig Zag (Highs and Lows), Divergence, Ichimoku Cloud, Moving Average Convergence Divergence and True Strength Index Histogram
This script is based on zdmre's RSI script, I revamped a lot of things and added a few indicators from ParkF's RSI script.
Disable Labels in the Style tab and the histogram if you don't enlarge the indicator and it seems too small.
Look to buy in the oversold area and bounce of the support of the linear regression.
Look to sell in the overbought area and bounce of the resistance of the linear regression.
Look for retracement to the moving average or horizontal lines, and divergences for potential reversal.
RSI
The Relative Strength Index (RSI) is a well versed momentum based oscillator which is used to measure the speed (velocity) as well as the change (magnitude) of directional price movements.
Moving Average
Moving Average (MA) is a good way to gauge momentum as well as to confirm trends, and define areas of support and resistance.
Linear Regression
The Linear Regression indicator visualizes the general price trend of a specific part of the chart based on the Linear Regression calculation.
Zig Zag (Highs and Lows)
The Zig Zag indicator is used to identify price trends, and in doing so plots points on the chart to mark whenever prices reverse by a larger percentage point than a predetermined variable or marker.
Divergence
The divergence indicator warns traders and technical analysts of changes in a price trend, oftentimes that it is weakening or changing direction.
Ichimoku Cloud
The Ichimoku Cloud is a package of multiple technical indicators that signal support, resistance, market trend, and market momentum.
MACD and TSI Histogram
MACD can be used to identify aspects of a security's overall trend.
The True Strength Index indicator is a momentum oscillator designed to detect, confirm or visualize the strength of a trend.

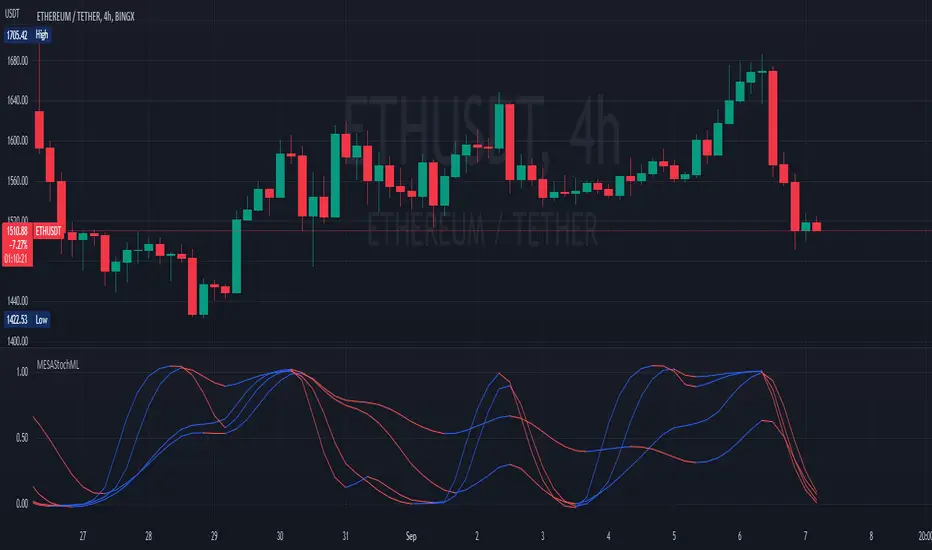
MESA Stochastic Multi LengthJohn Ehler's MESA Stochastic
It is updated and optimized version of script originally published by @veryfid.
Changes:
Converted to v5
Rewrote MESA Function. Same function can now calculate various length signals.
Modified super smoother. Indicator reacts faster to price change.
Optimized code. Functions are only called once per length.