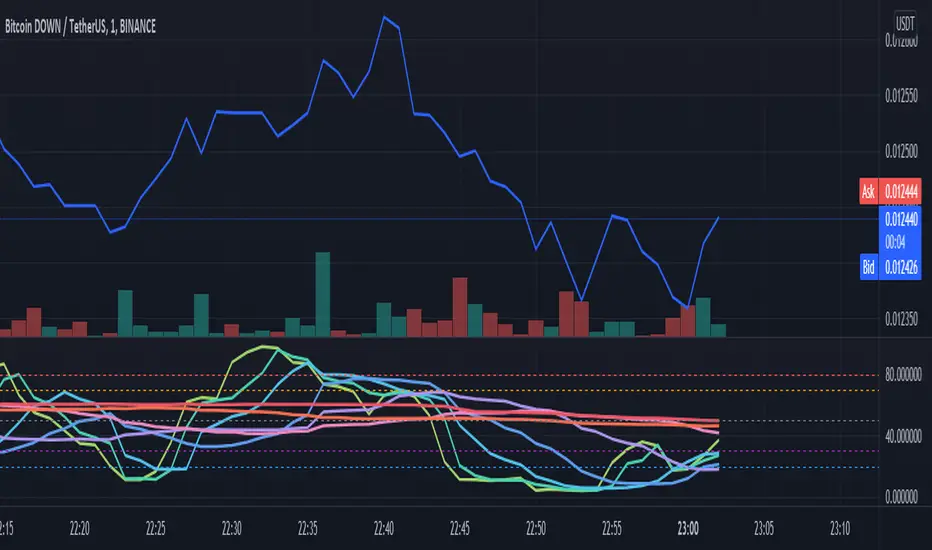
Stochastic RSI rainbow in fibonacci sequence using VWMAThe standard stochastic RSI gives limited information as it only contains two reference lines. This Stochastic RSI rainbow contains more lines in shorter timeframes and progressively fewer as the reference time increase. This is done in a FIB sequence 2,3,8,13,21,34,55.... The shorter timeframes are more reactive to current market conditions indicating recent price action and the longer lines represent more significant periods of time. The indicator uses VWMA for its calculations (volume weighted moving average)
HOW TO USE THIS INDICATOR:
When multiple lines are above, either 70 or 80, you can consider the commodity overbought, or OB. The more lines that are above the threshhold, the more significant the signal. The same is true in inverse. In addition, you can use each cross to signify a buy/sell signal according to the type and quantity of trading you are doing. If you are looking to get in and out quickly you can use the lower timeframe signals.
OPTIONS:
You can change what data is used for the VWMA calculation... Of course, you can select colors and other properties as well.
Stocastico RSI (STOCH RSI)
Relative Strength Index + Candle coloringRelative Strength Index (RSI)
>The Relative Strength Index (RSI), developed by J. Welles Wilder, is a momentum oscillator that measures the speed and change of price movements. The RSI oscillates between zero and 100.
>Traditionally the RSI is considered overbought when above 70 and oversold when below 30. But blindly selling at 70 and buying at 30 is a bad idea because price can make very low movement while oscillator makes large moves and vice versa.
>In RSI Signals can be generated by looking for divergences and failure swings. RSI can also be used to identify the general trend.
>Calculation
The RSI is a fairly simple formula, The basic formula is:
RSI = 100 –
>In this script I have used the standard 14 period RSI and added candle coloring feature, I used two other periods other than 14 to determine the major trend and use the position of 14 period RSI relative to other 2 periods to color the candle.
>color reference, what they represent :
>also look out for divergences, its not included in this script will provide in next updates, divergence are HH on price but LH on RSI, LL on price but LH on RSI, easy to identify. the best divergences are often easy to find they occur within next 5-10 candles, do not overcomplicate when it doesn't exist.
How to use this candle coloring:
>best during major trends.
>not best for mean reversion plays.
>use it as an addition to your system.

The Divergent (Pro) - Advanced Divergence IndicatorAutomated divergence detection with unparalleled customizability for any market on TradingView.
This is the Pro version of The Divergent - Advanced Divergence Indicator .
The Pro version contains everything that is in the Basic version, plus:
1. Access to a 2nd indicator, called "The Divergent's Companion"
By applying the companion indicator to the same chart you have The Divergent on, you will have the divergence lines and labels plotted on your price chart as well:
2. Hidden Divergences
While the Basic version can only detect Regular Divergences, the Pro version can detect both Regular and Hidden Divergences:
3. Seven more oscillators to detect divergences on
The Basic version comes with the two most popular oscillators, the MACD and the RSI.
With the Pro version you get access to 7 more oscillators:
- CMF (Chaikin Money Flow)
- Stochastic RSI
- MFI (Money Flow Index)
- TCI (Trading Channel Index), also known as WaveTrend
- Balance of Power
- CCI (Commodity Channel Index)
- Awesome Oscillator
4. Alerts
With the Pro version you can set up alerts on The Divergent indicator, allowing you to get alerted to one of the following events:
1. Regular Bullish Divergence
2. Hidden Bullish Divergence
3. Regular Bearish Divergence
4. Hidden Bearish Divergence
5. Pivot Low Confirmed
6. Pivot High Confirmed
5. Divergence Verification
The Pro version allows you to measure the quality of the detected divergences.
With divergence verification enabled, The Divergent will tell you how many times a particular divergence "played out", i.e. how many times a bullish or bearish divergence has actually resulted in the change in price in the direction predicted by the divergence. You can configure the price % levels which are used to categorise the divergences as valid or invalid (or unknown).
6. Use the signals in your own Pine Script strategy / indicator
The Pro version comes with access to a Pine Script Library called The Divergent Library .
Just add The Divergent onto the same chart you have your strategy on, link the two together using a "source" input, and use the functions in the library to process the signals from The Divergent :
You can think of The Divergent being a DaaS ( D ivergece a s a S ervice)!
7. Customise the look of the divergence lines and labels
The Pro version allows you to change the style of the divergence lines and labels:
---

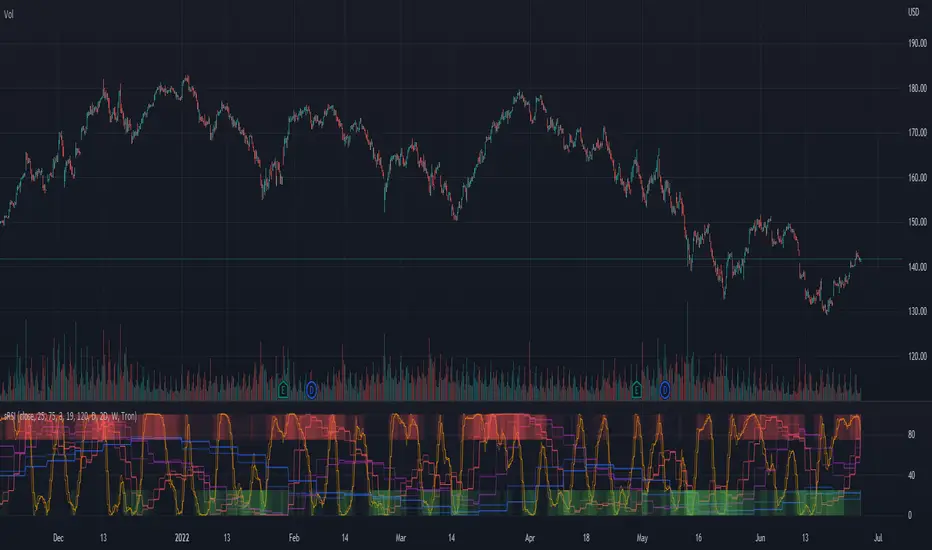
Multi-timeframe Stochastic RSIThe multi-timeframe stochastic RSI utilizes stochastic RSI signals from 11 different time-frames to indicate whether overbought/oversold signals are in agreement or not across time-frames. Ideally traders should enter and exit when conditions are in agreement as indicated by the intensity of the long (green) or short (red) bands at the top and bottom of the indicator. The intensity of the bands indicates how many of the time-frames are currently overbought/oversold.
MZ SRSI Strategy V1.0Strategy Introduction
This strategy starts from selection of 1st Moving Average from one of following:
SMA
EMA
DEMA
TEMA
LRC
WMA
MF
VAMA
TMA
HMA
JMA
Kijun v2
EDSMA
McGinley
Then it calculates the RSI of selected 1st Moving Average
In the end it calculates Moving Average of previously calculated RSI and for this purpose 2nd Moving Average is also selected from above list.
Cross of RSI and its Moving Average generates Strategy Alerts
Only long trades are enabled currently
Default Settings
I've set the default selection to the perfect options for 1D and 4h timeframes. You can modify both MAs selection and their length according to your selected timeframe.
Following default settings are used:
Heiken Ashi Candles are selected by default as source
1st Moving Average selection is set to LRC (Linear Regression Curve)
Length of 1st Moving Average is set to 50
RSI length is set to 2 because it is supposed to be fast
2nd Moving Average of RSI is set to TMA (Triangular Moving Average)
Length of 1st Moving Average is set to 5
Start date is set to 2011
Backtesting can also be done selecting %age of equity
Suggestions for Usage
Mostly winning trades have no prominent drawdown so losing trades can be abolished with Stoploss. Would soon add Stoploss, MTF and Takeprofit options in next version. Also if you want an alerts version of it then just comment below and would publish it later. I’ve found this strategy useful on 1D and 4h timeframes with described default settings.

Oversold / OverboughtMy first script. Based on RSI , CCI , RVI, and MFI . You can customize overbought or oversold thresholds for any indicator.
If you have any ideas - welcome.
Disclaimer
This is not financial advice. Trade on your own risk.

NRTH_ Momentum AlgoA NRTH_ Premium Momentum Based Strategy
Comes included with the Premium Package.
Indicator features
Built-In Alerts
Visual Risk Management
Customizable Entry Rules
4 Levels of confirmation
Customizable MA Ribbon
Usage Tips
This strategy is designed for Swing Trading and Intra-Day timeframes (1hr+)
The Algo uses multiple levels of convolution and confirmation before entering a trade, best used in trending markets. utilizing Stochasitc RSI overbought and oversold levels and an 1-3 MAs to identify trends and pullbacks.
Maximize the accuracy of your signals with up to 4 levels of convolution before entering a trade, filtering out the noise as much as possible.
You can set the overbought and oversold levels required for trade entries and set the types of MAs and how many are required to confirm trending momentum
Works for all markets with the ability to customize to your liking.
Backtesting Results Info
Period 23/9/2021-15/11/2021
Entry value at $1000 with 10x leverage
Binance standard taker fee rate (0.04%)
ATR Exits : 1:2.66 RR
-------------------------------------------
Disclaimer
Copyright NRTH_ Indicators 2021.
NRTH_ and all affiliated parties are not registered as financial advisors. The products & services NRTH_ offers are for educational purposes only and should not be construed as financial advice. You must be aware of the risks and be willing to bear any level of risk to invest in financial markets. Past performance is not necessarily indicative of future results. NRTH_ and all individuals associated assume no responsibility for your trading results or investments.
All investments involve risk, and the past performance of a security, industry, sector, market, financial product, trading strategy, or individual’s trading does not guarantee future results or returns. Investors are fully responsible for any investment decisions they make. Such decisions should be based solely on an evaluation of their financial circumstances, investment objectives, risk tolerance, and liquidity needs.

(Short)EMA 4H + Stochastic RSI By Nussara (strategy)This is a back test for "(Short)EMA 4H + Stochastic RSI" used for a short position. It uses EMA and stochastic RSI.
The 4-hour EMA is a trend indicator in smaller timeframes. For a short position, EMA slow is above EMA fast and uses stochastic RSI to predict price turning points. Through the formula, traders can identify overbought or oversold.
Default setting
1. The 4-hour EMA defaults to EMA fast =24 and EMA slow = 33.
2. Stochastic RSI defaults K=3, D=3, RSI Length=16, and Stochastic Length = 5.
You should adjust the settings to be suitable for the products that you trade.
(Short)EMA 4H + Stochastic RSI formula
Short Entry :
1. The timeframe of the chart must be less than or equal to 4 hours. If the timeframe is set higher than 4 hours, this strategy will not work.
2. 4-hour slow EMA line must be above fast EMA line, indicating an downtrend.
3. Stochastic RSI K line cross down D line and the intersection must be above 80.
If all three are true, the indicator will have a short signal.
Short Exit: Stochastic RSI K line cross up D line
This indicator is just a tool for technical analysis. It shouldn't be used as the only indication of trade because it causes you to lose your money. You should use other indicators to analyze together.

(Short)EMA 4H + Stochastic RSI By Nussara(study)This strategy is called "(Short)EMA 4H + Stochastic RSI" used for a short position. It uses EMA and stochastic RSI.
The 4-hour EMA is a trend indicator in smaller timeframes. For a short position, EMA slow is above EMA fast and uses stochastic RSI to predict price turning points. Through the formula, traders can identify overbought or oversold.
Default setting
1. The 4-hour EMA defaults to EMA fast =24 and EMA slow = 33.
2. Stochastic RSI defaults K=3, D=3, RSI Length=16, and Stochastic Length = 5.
You should adjust the settings to be suitable for the products that you trade.
(Short)EMA 4H + Stochastic RSI formula
Short Entry :
1. The timeframe of the chart must be less than or equal to 4 hours. If the timeframe is set higher than 4 hours, this strategy will not work.
2. 4-hour slow EMA line must be above fast EMA line, indicating an downtrend.
3. Stochastic RSI K line cross down D line and the intersection must be above 80.
If all three are true, the indicator will have a short signal.
Short Exit: Stochastic RSI K line cross up D line
This indicator is just a tool for technical analysis. It shouldn't be used as the only indication of trade because it causes you to lose your money. You should use other indicators to analyze together.

(Long)EMA 4H + Stochastic RSI By Nussara(strategy)This is a back test for "(Long)EMA 4H + Stochastic RSI " used for a long position. It uses EMA and stochastic RSI.
The 4-hour EMA is a trend indicator in smaller timeframes. For a long position, EMA fast is above EMA slow and uses stochastic RSI to predict price turning points. Through the formula, traders can identify overbought or oversold.
Default setting
1. The 4-hour EMA defaults to EMA fast =24 and EMA slow = 33.
2. Stochastic RSI defaults K=3, D=3, RSI Length=16, and Stochastic Length = 5.
You should adjust the settings to be suitable for the products that you trade.
(Long)EMA 4H + Stochastic RSI formula
Long Entry :
1. The timeframe of the chart must be less than or equal to 4 hours. If the timeframe is set higher than 4 hours, this strategy will not work.
2. 4-hour fast EMA line must be above slow EMA line, indicating an uptrend.
3. Stochastic RSI K line cross up D line and the intersection must be below 20.
If all three are true, the indicator will have a long signal.
Long Exit: Stochastic RSI K line cross down D line
This indicator is just a tool for technical analysis. It shouldn't be used as the only indication of trade because it causes you to lose your money. You should use other indicators to analyze together.

(Long)EMA 4H + Stochastic RSI By Nussara(study)This strategy is called "(Long)EMA 4H + Stochastic RSI" used for a long position. It uses EMA and stochastic RSI.
The 4-hour EMA is a trend indicator in smaller timeframes. For a long position, EMA fast is above EMA slow and uses stochastic RSI to predict price turning points. Through the formula, traders can identify overbought or oversold.
Default setting
1. The 4-hour EMA defaults to EMA fast =24 and EMA slow = 33.
2. Stochastic RSI defaults K=3, D=3, RSI Length=16, and Stochastic Length = 5.
You should adjust the settings to be suitable for the products that you trade.
(Long)EMA 4H + Stochastic RSI formula
Long Entry :
1. The timeframe of the chart must be less than or equal to 4 hours. If the timeframe is set higher than 4 hours, this strategy will not work.
2. 4-hour fast EMA line must be above slow EMA line, indicating an uptrend.
3. Stochastic RSI K line cross up D line and the intersection must be below 20.
If all three are true, the indicator will have a long signal.
Long Exit: Stochastic RSI K line cross down D line
This indicator is just a tool for technical analysis. It shouldn't be used as the only indication of trade because it causes you to lose your money. You should use other indicators to analyze together.

M.Right Awesome RSI+ (cc)Hey Traders,
Tonight I figured I'd release a special indicator that I've had in the works for years and finally was able to piece it together using pine. It's an extremely accurate take on the RSI. I plan to continue to refine the indicator and add more features, but as it is this is still one you can make a lot of money with.
(((((Please note: all circles and arrows in the chart above are drawn for illustration. Below is a chart showing regular session)))))
This indicator will act similarly to a regular RSI (Relative Strength Indicator) in that there are Oversold and Overbought levels, but also volatility bands around it to allow for more accurate signals whilst moving the Oversold (OS) and Overbought (OB) levels further apart ( less false OB/OS signals ). As shown in the chart above, it's able to detect some pretty big moves with both speed and accuracy .
Most of you are familiar with and use an RSI indicator so I will keep this description as brief as possible: The Relative Strength Index (RSI), developed by the legendary J. Welles Wilder, is a momentum oscillator that measures the speed and change of price movements; it oscillates between 0 - 100, with levels set as Overbought and Oversold. These levels are where a trader make look for a reversal, however they must keep in mind in an uptrend or bull market, the RSI tends to remain in the 40 - 90 range; 40 - 50 zone often will act as support. More advanced traders will also look for divergences between the price and the oscillator (i.e. price trending upward while oscillator trending downward). As far as oscillators go, the RSI is one of the most frequently used, by both advanced and beginner traders alike.
Works great on multiple timeframes. It may not catch every rally, but it will catch most --even on smaller timeframes (i.e. 5 minutes in image below).
As with all of my scripts I like to make them customizable:
You can change the up and down colors on the RSI ribbons and the color and style (dotted shown) of Overbought / Oversold lines. In future versions, I will add more color customizations and additions.
Can toggle 1 or both of the 2 highlight signals off to make it a little more plain.
Lot's of ways to make it look the way you'd like it to.
--The alerts include both the super accurate Bullish and Bearish signals shown with the background highlights. They are pre-filled so it will automatically display the price and time that the alert went off for you.
If I missed anything or you have a question, please let me know!
Cheers,
Mike
Please note: I have made this indicator invite only, send me a DM if you're interested in trying it out.

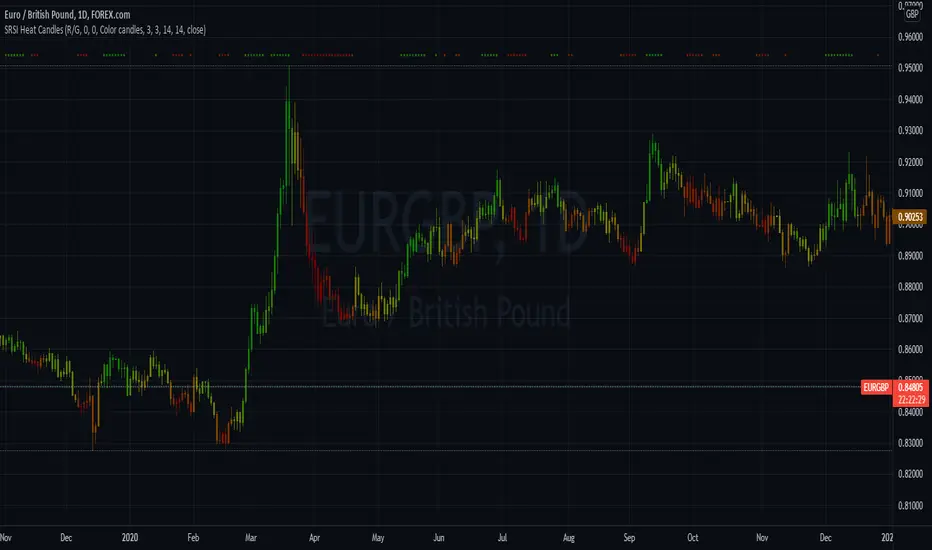
Stochastic RSI Heat Candles OverlayThis script is based on the Stochastic RSI indicator.
Candles are dynamically colored with a customizable RGB shading directly generated from the average Stochastic RSI current value.
By default, colors represent the following status -> green is overgought & red is oversold.
Options:
Shading colors: Choose between Red/Green, Green/Blue, and Blue/Red shadings to represent the SRSI heat.
Invert colors: Switch colors of the selected shading.
Third color: Select a value from 0 to 255 for the third color which does not vary.
Transparency: Select the transparency value.
Overlay style : Choose to color the whole candle, or only borders and wick.
Show candle side: If you choose to fully fill candles with the SRSI heat color , enable this option to plot shapes representing the candles directions.
Candle marks colors: Select bull and bear colors for direction shapes.
Overbought and Oversold situations are also represented by colored shapes at the top of the chart.
Standards Stochastic RSI parameters.
Examples:
Notes:
Do not forget to bring the script to the front of your chart to avoid being covered by default candles.
Next improvements would probably be a better coloring algorithm, however, do not hesitate to suggest any modifications in comments.
Initially, I shared a Stochastic RSI Heat Bollinger Bands indicator which gave me the idea to develop this one, you can find it on my profile.
Stochastic RSI Heat Bollinger BandsThis indicator is based on a combination of the famous Bollinger Bands and the Stochastic RSI indicator.
Bands are dynamically colored (and filled) with a RGB color composed by red and green values, directly generated from the average Stochastic RSI current value.
By default, colors represent the following status -> green zone is overgought & red zone is oversold.
A screener is also displayed on the chart, representing StochRSI K and D lines values, RSI value, as well as the current status (Overbought/Oversold) of the StochRSI and RSI indicators.
Notes:
The heat color and the screener status are both based on the average value between the K and D lines (for stochastic RSI based heat)
Bands can be disabled in options to use this indicator as a simple moving average colored by the Stochastic RSI heat color.
Options:
Various moving average types (SMA, EMA, SMMA, VWMA...)
Inversion of colors between overbought and oversold status
Enabling/disabling heat color on bands / basis line and bands background color
Show/Hide the screener
Color source can be modified to base the heat on the RSI instead of the Stochastic RSI value
Standards Bollinger bands, Stochastic and RSI parameters
Example
Feel free to suggest any improvements in comment.

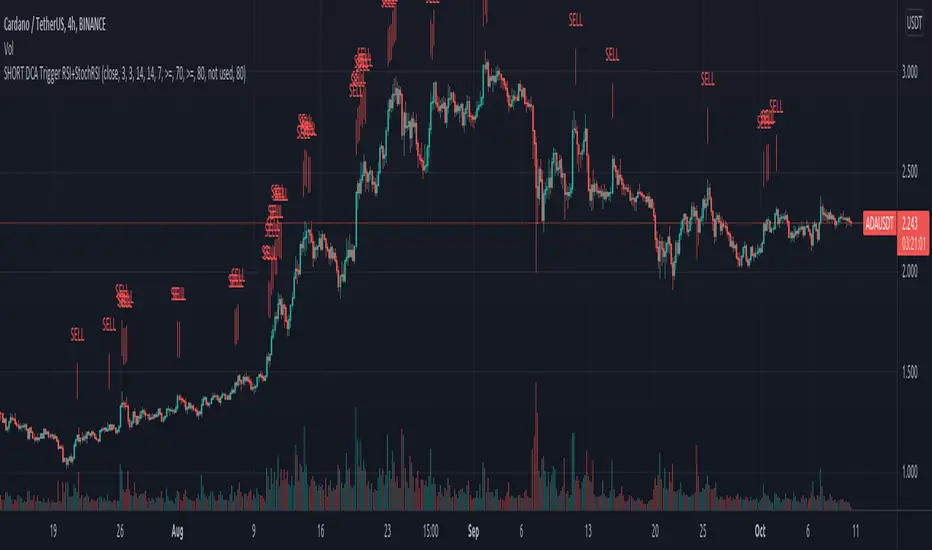
Zendog SHORT DCA Trigger RSI+StochRSIThis is a script that generates a SELL signal by combining RSI and Stochastic RSI into the same script and that can easily be integrated into an external Backtester like the one I published.
The script uses default values for RSI and Stochastic RSI overbought conditions.
They should be adjusted for specific assets and timeframes so they better match the current trend. Please beware you might overfit settings to match a short timeframe trend (like a few days or hours). If this is the case once the trend changes the signals will not be accurate.
The purpose of this script is to provide some pine code that can be used to further combine multiple indicators into a SHORT Deal Start signal.
Integration with the Zendog Backtster:
- add the backtester on the chart
- add this script on the chart
- in the Zendog backtester Deal start type select "External indicator"
- in the Zendog backtester Indicator source and value select "Zendog SHORT DCA Trigger RSI+StochRSI: SIGNAL"
Zendog LONG DCA Trigger RSI+StochRSIThis is a script that generates a BUY signal by combining RSI and Stochastic RSI into the same script and that can easily be integrated into an external Backtester like the one I published.
The script uses default values for RSI and Stochastic RSI oversold conditions.
They should be adjusted for specific assets and timeframes so they better match the current trend. Please beware you might overfit settings to match a short timeframe trend (like a few days or hours). If this is the case once the trend changes the signals will not be accurate.
The purpose of this script is to provide some pine code that can be used to further combine multiple indicators into a LONG Deal Start signal.
Integration with the Zendog Backtster:
- add the backtester on the chart
- add this script on the chart
- in the Zendog backtester Deal start type select "External indicator"
- in the Zendog backtester Indicator source and value select "Zendog LONG DCA Trigger RSI+StochRSI: SIGNAL"

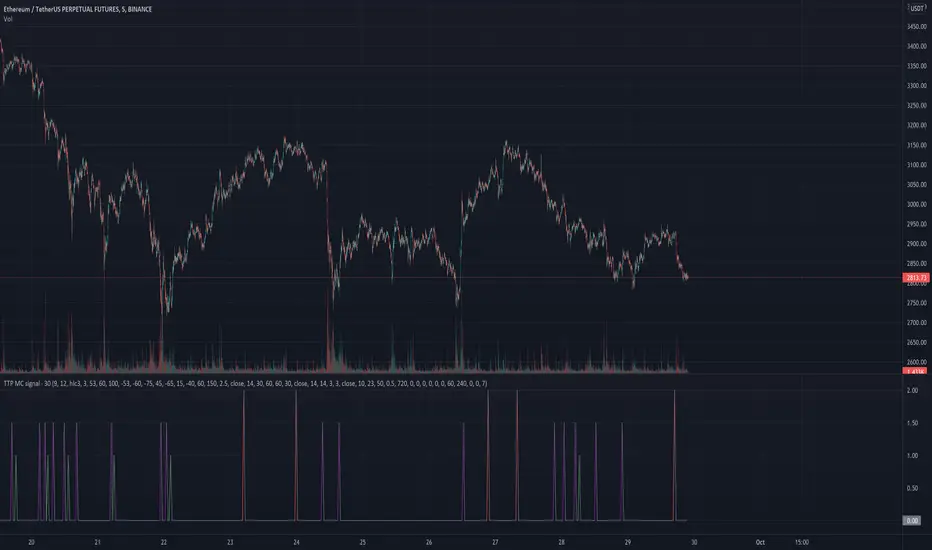
TTP MC signalThis signal is based on Market Cipher.
It triggers a 1 for a buy the divergence signal which is less frequent and more conservative.
It triggers a 1.5 for the normal signal which is more frequent and more risky.
It triggers a 2 for a sell signal which is also using a divergence.
You can use this values to backtest.
It contains alerts for each of the separated signals.
Multi timeframe Stochastic RSI Screener by noop42Here is a custom x4 timeframes Stochastic RSI screener to add on your charts.
Options
Repaint mode : if enabled: values are updated in live, if disabled: values are updated once the concerned candle is closed
Default parameters
Timeframes: 1, 5, 15, 60
Repaint mode: enabled
Notes
Use the lowest timeframe configured on the screener to get real values
A classic x3 multi-timeframe Stochastic RSI indicator is also available

MTF StochRSI indicator by noop42Here is a custom x3 timeframes Stochastic RSI indicator.
Main Features (can be disabled)
Average mode : for each timeframe, a single line corresponding to the average value between K and D is printed
Repaint mode : if enabled: values are updated in live, if disabled: values are updated once the concerned candle is closed
Default parameters
Timeframes: 1, 5, 15
Mode : Average value
Repaint mode: enabled

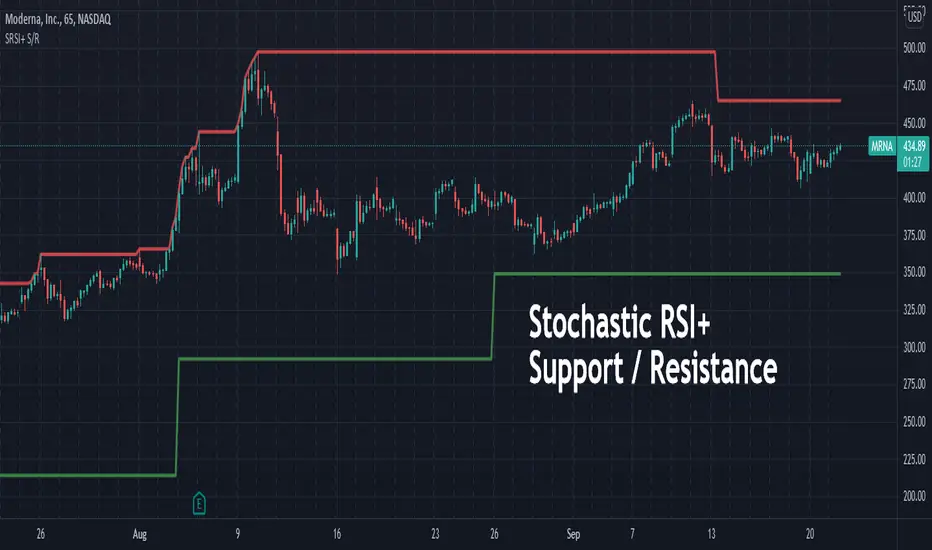
Stochastic RSI+ Support/Resistance (beta)This indicator uses Stochastic RSI+ as a means to determine overbought and oversold conditions which subsequently define recent support and resistance levels.
CashTrap Oscilator |HFX|CashTrap oscillator, this oscillator occupies the RSI oscillator and the Stochastic.
When the oscillator turns green, look for purchases.
When the oscillator turns red, look for sales.
For best results, use in conjunction with the CashTrap indicator.

Bollinger Bands + RSI Strategy by CMNisalCan be Used on Any timeframe.
Based on Bollinger Bands and RSI ( Relative Strength Index )
Used for Testing below Trade Setups on 3Commas.
Bollinger Bands
BB-20-2-LB
BB-20-1-LB
Relative Strength Index
RSI-7 <70
RSI-7 <30
Added Short Entry Switch
Added RSI Skipping Option
Price Should cross the Band and Close the candle Above/Below the band

Multi-timeframe MAs + Stoch RSI SignalsHello traders,
I welcome you to my first published script on TradingView: “Multi-timeframe Moving Averages + Stochastic RSI”.
The script is based on a simple formula: Buy signals are generated when a fast moving average is above a slower moving average (uptrend) and the Stochastic RSI K line is crossing above the oversold level (entry).
Sell signals are generated when a fast moving average is below a slower moving average (downtrend) and the Stochastic RSI K line is crossing below the overbought level (entry).
This indicator works best in strong trends!
**Please note the above example has repainting turned on which may produce unrealistic results when viewing historical data. See below for more information regarding this and how you can turn it off.**
The user has the following inputs:
- Option to change the Stochastic RSI settings, including the oversold and overbought levels.
- Option to enter any value for both the Fast Moving Average and the Slow Moving Average.
- Option to change between EMA or SMA for each moving average.
- Multiple time frames to choose from, as well as the ability to selectively turn off individual time frames (both plots and alerts).
(Default time frames are 1 hour, 4 hour, and Daily. You can have a 4th time frame by changing your current time frame to something lower than the other 3 time frames)
- Turn on/off repainting: If repainting is turned on you will get an alert and buy/sell signal on chart immediately when condition is met, however the signal may disappear from chart if the condition reverses during the same candle.
If repainting is turned off, the indicator will wait for the candle to close before issuing the alert and painting the signal on chart.
For higher time frames, the indicator will wait for the candle in the higher time frame to close before issuing a signal if repaint is turned off. Default is set to Repaint on, so please be aware of this if you do not want repainting.
How to use alerts:
- Before you do anything, make sure your current time frame is the lowest time frame you’d like alerts on, as you will still receive alerts for the higher time frames you selected in settings.
- Once you have all the settings changed to how you like, save your chart first. Then right click on any of the indicator’s buy/sell signals on the chart and click “Add Alert on MAs + Stoch RSI”.
- Make sure “Any alert() function call” is selected under the Condition.
- You can delete or change the text in “Alert name” if you want as the alert message is already built into the indicator, and it will tell you in the alert message which asset and time frame to buy or sell.
Other things to note:
- The indicator will not display the buy/sell signals of lower time frames when you are on a higher time frame. This was done purposely to reduce clutter on the chart when you switch to higher time frames.
- While the alert message will tell you which time frame a signal was generated, the plots on the chart will instead show “Buy/Sell TF1, or TF2, or TF3”.
If the signal is from the current time frame that the alert was created on, then it will simply show “Buy” or “Sell”.
Hope you guys enjoy using this one, please drop a like if you found it useful. If anyone wants to modify my script in any way, please just credit me for the original work when you publish the script. Good luck!
