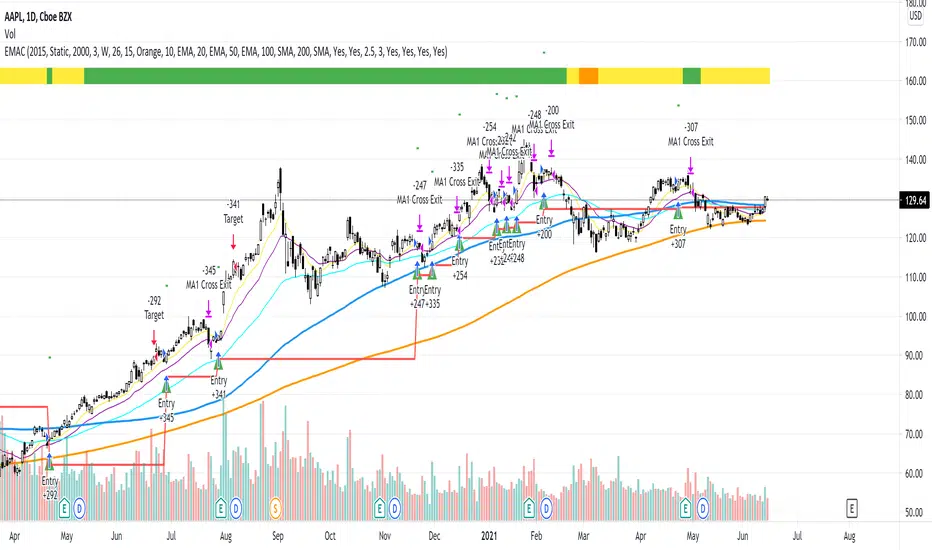
EMAC - Exponential Moving Average CrossEMAC - Exponential Moving Average Cross
This strategy is based in part on original 10ema Basic Swing Trade Strategy by Matt Delong: www.tradingview.com
Link to original 10ema Basic Swing Trade Strategy:
This is the Original EMAC - Exponential Moving Average Cross strategy built as a class for reallifetrading dot com and so has all the default settings and has not been optimized. I would not recommend using this strategy with the default settings and is for educational purposes only. For the fully optimized version please come back around the same time tomorrow 6/16/21 for the EMAC - Exponential Moving Average Cross - Optimized
If you have any questions feel free to reach out to me with a comment and I will try to get back to you quickly with a reply.
Stoploss
Relative VolumeVolume can be a very useful tool if used correctly. Relative volume is designed to filter out the noise and highlight anomalies assisting traders in tracking institutional movements. This tool can be used to identify stop loss hunters and organized dumps. It uses a variety of moving averages to hide usual activity and features an LSMA line to show trend. Trend columns are shown to highlight activity and can be seen at bottom of the volume columns, this is done using ZLSMA and LSMA.
The above chart shows an example of 2 indicators being used on the 15 min chart. The bottom indicator is set to the 1 min chart. Traders can see a large dump on the 1 min chart as institutions wipe out any tight stop losses. Next they buy back in scooping up all those long positions.
This is an example layout using a split screen setup and multiple timeframes ranging from 1 min to 30 mins. This gives a clear indication of trends and make it easy to pickup on institutional behaviour. Tip: Double clicking indicator background will maximize RVOL to the split screen window.

YesillimThe "Yesillim" indicator is a trend follower and trailing stop indicator that reacts quickly and aims to enter early in an uptrend and exit early from a downtrend. Since moving averages are used, it can be used in daytrade and scalping in daily or lower periods. The crossover and crossdown intersections of the price and the indicator line may be meaningful, but it is actually a color changing indicator and color changes should be interpreted. The bullish market gains strength when the color turns green, and the bearish market when it turns red. When prices get too far from the indicator, they are approaching again, in this case, it may be support will work like resistance according to the current trend. Like any indicator, it is possible to produce false signals in the horizontal market, so it should not be used alone, the oscillator and volume should support the current trend. In strong trend changes, angle changes in the indicator can also be interpreted manually. In this case, sharp angled turns indicate a sharp trend change. Technically customized weighted moving average weights are specially weighted with golden ratio coefficients, smoothed with a lower period for noise removal with the same principle and added bias. I wish it to be used in profitable transactions.
Turkish (Türkçe): Yeşillim indikatörü bir trend izleme ve hareketli iz süren indikatördür. Son barları agresif olarak ağırlıklandırdığı için var olan bir yükseliş trendine erken sokup, düşüş trendinden erken çıkarması olasıdır. İndikatör yorumlanırken fiyat ve indikatör kesişimleri anlamlı olsada (yükseliş düşüş trendlerinde destek-direnç görevi görebilecektir) ancak asıl amaç renk değişimi yorumlanmalıdır, yeşil yükseliş trendinin, kırmızı ise düşüş trendinin güç kazandığını göstermektedir. Her indikatör gibi yatay piyasada hatalı sonuçlar üretebilir, bu nedenle rsi, sokastik gibi bir osilatörle desteklenmesi hacimin mevcut trendi desteklemesi gerekmektedir. Kazançlı işlemlerde kullanılmasını temenni ederim.
EMA+RSI Pump & Drop Swing Sniper (SL+TP) - StrategyThis is the strategy version of the 'EMA-RSI-Pump-Drop-Swing-Sniper-With-Alerts':
Some additions with this strategy:
~Added Stop loss & Take profit control. In Settings > Inputs if the Stop Loss is at .051 that means it's 5.1% and the Take Profit at .096 is 9.6%. If you wish to remove the TP and SL just change the value to 1.00 and it would be the same as it being 100% TP and SL which is likely to never be hit.
~Added Backtesting by changing the month/date/year in Settings > Inputs
~Added a 2nd EMA line to assist with the long entry signals. I only use this for long entry & exits, though you could use the long exits as Short entries too. I just personally don't do short trading on Bitcoin.
This is using an EMA and RSI with slightly modified settings to give good entry and exit points while looking at Bitcoin. I use this on a 1-hour and 4-hour chart and with other indicators to find good positions to enter a trade or exit if things are turning red.
It's important to know this strategy was made as a request by another user that was using the indicator version. I don't use this as a trading strategy by itself, I use the visuals it gives as a confirmation with other indicators to find the best possible entry and exit positions.
If you click on the EMA line it will color the bars of the chart based on if they are above or below the EMA - This is just visually helpful for me to see the active trend.
Make sure you hover over or click on the EMA line to see the colors of the candles change - it's not visible by default or without doing this.

Safe Scalpy Stop Loss. Percentage from price visualizer.This is my first script I have published so bear with me.
I have thrown this together so you can easily see on the chart where -0.5%, -1% and -2% would be from the last candle close. I also replicated these to show positive values in case you are shorting.
I have also added a custom value setting so you can set the line at whatever percentage value you like and included an adjustable recent higher high and higher low finder to help create a recent range as it seems to work well in tandem for scalping range based price movement.
You can turn all these things on and off in the settings on the style checkboxes.
I felt the need to make this because I like to scalp trade with leverage like a total degen from time to time. Often the setups happen very quickly. It is difficult to calculate where to set a stop loss in a hurry so I keep a fixed account size/lev and just vary the position percentage size based on the percentage of the stop loss from the current price.
Sometimes when switching from a lower volatility chart to high volatility one it is easy to get caught out by quickly entering a scalp trade only to find you made your position way too big or you shouldn't have entered at all. You thought it was only moving 0.2% per candle instead of 3%. Whoops. Rekt.
This indicator is all about trying to help me avoid that with a visual clue to back up the bad maths I do quickly in my head.
I often hide it and only show it when I'm ready to enter a position to double check my SL and entry are set in a sensible area.
I thought I would publish it in case someone else finds such a simple tool handy.
Apologies if there is already something out there that does this job. I couldn't find it.
See you all on the moon.

Position Sizing w/ ADR&ATR TrackingScript to use for position sizing based on portfolio size, max position, and max loss inputs. The option to use custom entry and stop are available, but default to last price for entry, and Low of Day (LoD) for stop. The ATR % is a measure of the low of day to current price as a percentage move.
Credit to LonesomeTheBlue for the base code on position sizing and TheScrutiniser/GlinckEastwoot for ADR formula
-Nelgoth, best of luck

MultiAlert, MultiTargets + TickersThis is my first script, completely made from scratch. Bear with me.
Script that allows one to set an alert for Multiple Price Levels, on Multiple Tickers, complete with Dynamic Messages showing you which ticker, at which price, at which alert (Stop loss, Target 1 etc.), set to Once Per Bar.
Select Ticker, type in price levels that you have for targets & stop loss, move on to the next, or don't and leave 0 and blank.
Disable the targets you do not need in STYLE tab to disable plotting & scaling, leave unused tickers & targets blank & 0.
Create Alert, select this indicator, anyfunction() alert.
MAKE SURE to remake the alert every time you change something, they are not smart enough to change as you change things. Can Confirm by using the numbers in the alert name. You will also have to set the profit level or stop loss to zero every time it triggers to avoid triggered again.
In fact, you do not need the indicator active at all. Add it to a chart and hide it by clicking on the little eyeball icon, to make an alert open the settings for the indicator and type in your targets like normal. Indicator will remain invisable.
I have not found a way to dynamic message the alert name, or else I would.
DISCLAIMER: NONE OF THIS IS FINANCIAL ADVICE. You are completely responsible for whatever happens to you. Do not use the targets in this chart. Do your own research before trading.
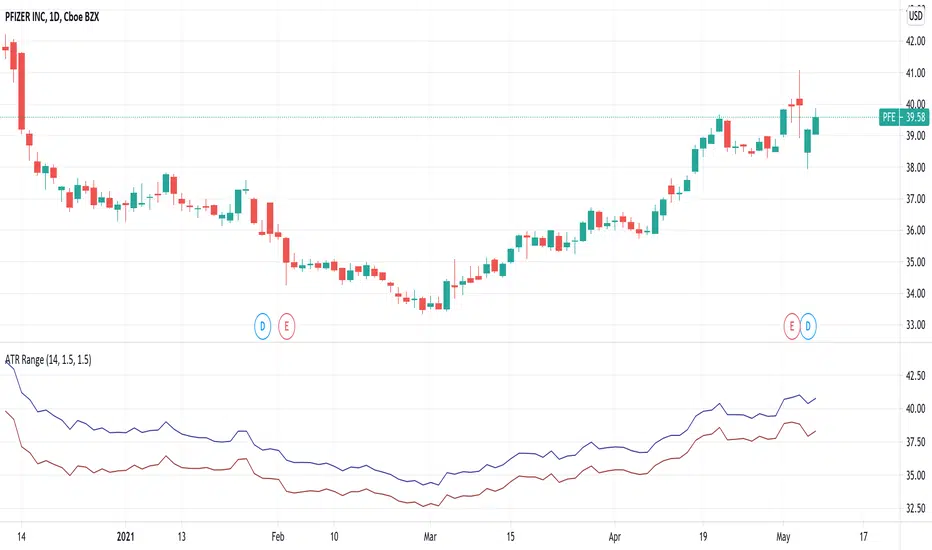
ATR RangeUseful in case you use Average True Range to determine Shows Stop Loss and Take Profit price levels.
For example, if you want to put Stop Loss with a distance of 1.5xATR and Take Profit 2xATR for a long trade, put 1.5 as Lower Factor and 2 as Upper Factor. Lower and Upper prices will show price levels for SL and TP respectively.
Study Backtester [MS]Backtest your study like a strategy with our Study Backtester. Visualize your script's performance directly on the chart.
Simple to use, copy-paste a few lines of code (shown below) into your script, then set your script as input to the Study Backtester.
Visualize how your script performs against buy-and-hold over time, and get a nice print out of stats.
Settings
Set your buy and sell signal inputs
Add a stop loss
Choose normal or trailing stop loss
Choose the start date and time for backtesting
Set trading commissions
Use leverage or not
Set carry cost for leveraged trades
Version 1
Only supports buy-sell-buy-sell alternating signals. Any non-alternating signals will be ignored.
Testing begins with 1 share of the asset at your first buy signal.
Things To Note
This cannot enter or exit mid-candle. With the exception of the stop loss feature, which will calculate exits at the exact stop price.
Stops are not treated as stop-orders, but as market-exists at the stop (or trailing stop) price.
This DOES NOT take into account any loss of funds due to liquidation if price goes against you in a margin position.
Short positions are not currently supported.
Only `study` scripts are supported
How To Use
1) Add the following to the bottom your study's code.
//------------------------------------------------------------------------------
// FOR BACKTESTER
plot(buy ? 1 : sell ? -1 : na, title="Signals", display=display.none, editable=false)
2) Make sure `buy` and `sell` variables are assigned appropriately according to your strategy.
3) Add both your study and this script to your chart.
4) Set the "Signals Plot" setting of this script to: : Signals
5) Adjust this script's settings (start date, commission, stoploss, etc) as necessary.
PM us with any questions about this script.

CRYPTO 3EMA Strategy with Take Profit & Stop Loss based on ATRSimple 3 EMA Strategy with plotted Take Profit and Stop Loss
Entry condition:
- Middle EMA cross above the Slow EMA
- Set take profit and stop loss exit conditions based on ATR Indicator
Exit condition:
- Fast EMA cross below the Middle EMA

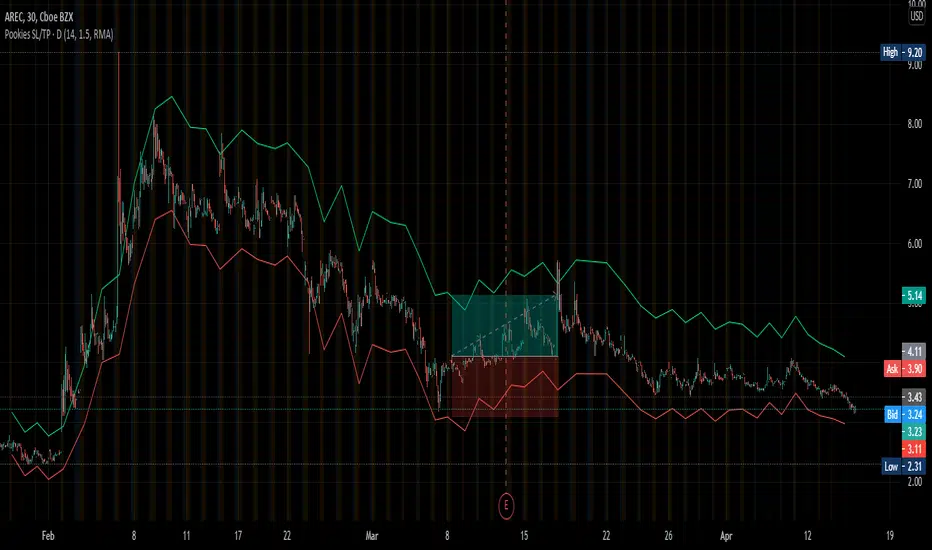
Pookies SL/TP LinesThis indicator calculates Stop-loss and Take-profit limits and plots them on the chart based on the daily ATR value for a given instrument.
The Stop-loss is calculated at the current close price minus 1x ATR and is plotted as a red line by default.
The Take-profit is calculated at the current close price plus 1.5x ATR and is plotted as a green line by default.
The colors for each line can be changed, as well as the default ATR values (length, smoothing).
To use:
When you see a long or short signal (your own preference), enter your position and set your take-profit and stop-loss limits at the current red/green lines, based on whatever Risk-Reward you've set it to.
This is also helpful in determining whether or not a trade offers enough potential to risk prior to entering the trade.
When the lines are far apart, the ATR is high. When the lines are close together, the ATR is low. This can be used to determine volatility and allow traders to buy during consolidation and sell into strength.
Thank you.
Highlighter Strategy V2// Based on Normalized Smoothed MACD by Dreadblitz
Old one was just an oscillator, I changed a few things
1) It now paints the line green/orange
2) The trigger (green/red) is now based on a signal
3) The signal is basically isUp, but with some additional controls, e.g.
4) (new) There is an embedded stoploss. This is a growth/decay function that decays slower than it grows.
5) Signal is filtered additionally by the stoploss (no green under the decaying line)
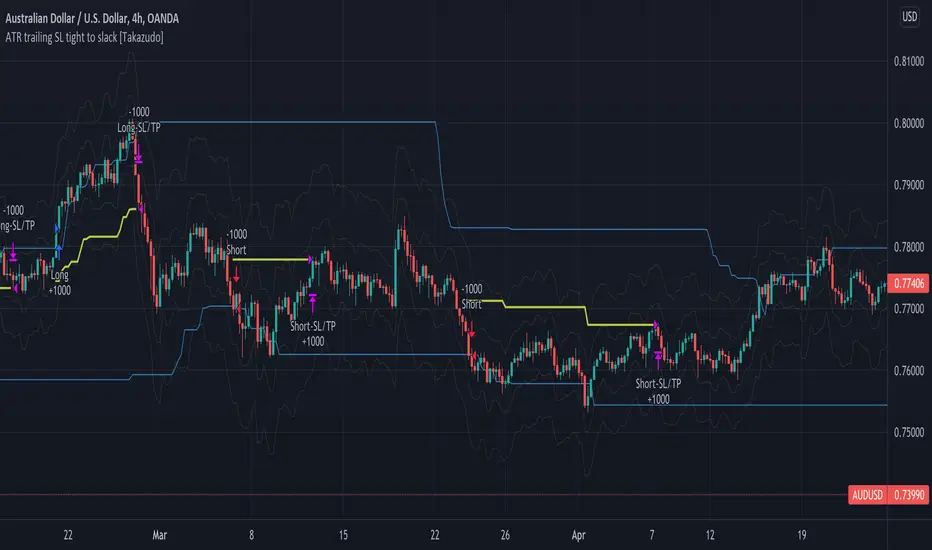
ATR trailing Stop Loss tight to slack [Takazudo]This is a demo of ATR based trailing Stop Loss.
This SL strategy uses 2 types of ATR based SL.
tight SL as initial (ATR * 1.5)
slack SL as trailing (ATR * 4)
When any entry singal occurs by the buy/sell conditions, this SL strategy uses the "tight SL" as the initial SL.
Then the SL will chase the price as trailing SL. However, this strategy uses the "slack SL" in this trailing phase.
So you can set the tight SL first.
Then SL will chase the price as the slack one.
Note: The entry strategy in this script is not intented to win. Check the result. Be careful. Just a module of my strategy.
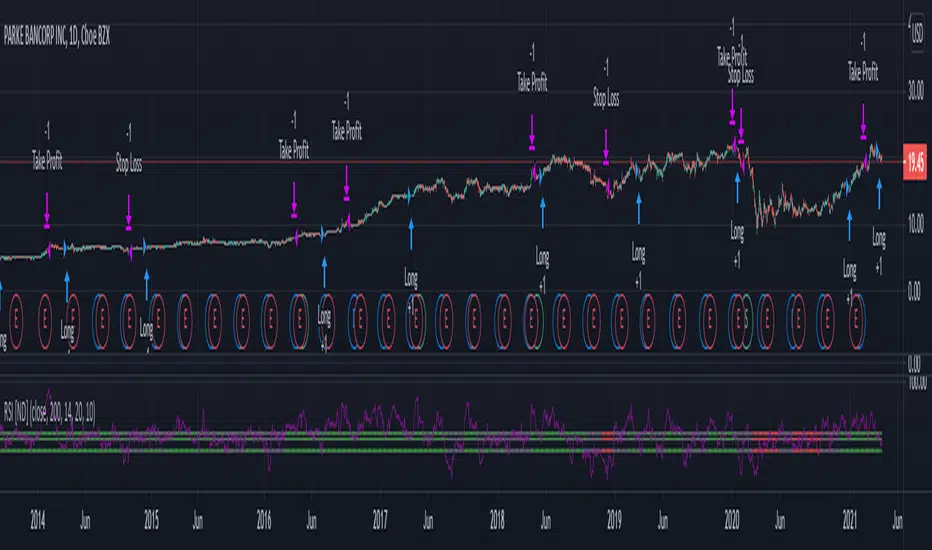
RSI Strategy [Nostradanis]Strategy based on an adaptation of the Relative Strength Index and slow exponential moving average.
Green lines: uptrend
Gray lines: lateral trend
Red Lines: downtrend
Use:
When RSI crosses up 40 and 50 lines can be a good long entry if ema trend is clearly bullish.
55 line confirms entry.
Designed for swing with under $20 shares but can be adapted to scalping
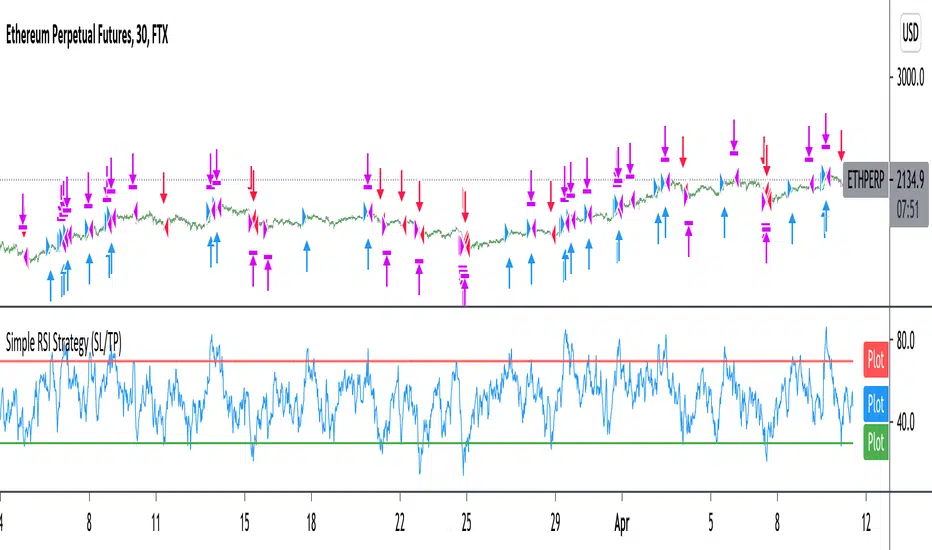
Improved simple RSI Buy/Sell at a level (SL/TP)Improved Simple Strategy based on RSI, using overbought or oversold levels.
Backtest: ETHPERP (FTX) - 30m
Set STOP LOSS and GET PROFIT as a percentage (2% and 10% by default).
If strategy.position_size != 0 algorithm convert percentages into points and set stop loss and take profit limit orders.
ATR For Stop Loss (Overlay)This script is an enhancement of ATR Indicator.
It is used to determine the stop loss position by using the ATR indicator, in conjunction with the low of the candle.
Formula = Stop Loss = Lowest(Lowest Length) - (ATR Multiplier * ATR (Smoothing, Length))
However, the user needs to manually identify the swing low for a better stop loss placement.
Parameter Information :
- Length : Period to calculate the average true range.
- Smoothing : The method used for averaging.
- ATR Multiplier : Multiplier factor to determine the Stop Loss from the lowest reference point. (1 ATR Multiplier means the stop loss would be = Low - ATR)
- Lowest Length : A total number of candle to determine the lowest reference point. (1 means only using the latest candle's low as a lowest reference point)
Have fun and good luck!
Auto Stop
A simple script using the last three bars(including the current) and draws a line on the chart under that for an easy automated stop loss point


Fixed price Stop Loss [Takazudo]This strategy is a demo for fixed price stop loss.
This strategy enables you to specify fixed price stop loss. Let's say your deposit is USD. When you trade EURCAD, you need to specify the quantity for trade. Here comes three chances for trade.
A: SL pips: 500
B: SL pips: 200
C: SL pips: 100
In these trade, the risk is different for each. ABC risk ratio is 5:2:1. And, you cannot know how much to lose if the price hits the stop loss. This is a huge problem.
With this strategy, You can specify the fixed risk price for each trade. If you specify 100 USD for the risk, this strategy calculates how much quantity to buy or sell for each entry. In the case above, this strategy guides you how much quantity to buy or sell like below.
A: 2,000 qty (SL: 500pips)
B: 5,000 qty (SL: 200pips)
C: 10,000 qty (SL: 100pips)
If you make entries with those quantity and the price hits the stop loss, You will lose the money like below.
A: 100 USD
B: 100 USD
C: 100 USD
This is what this script does. Fixed price SL.
I tested this caliculation for OANDA's main 28 currency pairs forex listed below.
AUDUSD, EURUSD, GBPUSD, NZDUSD, USDCAD, USDCHF, USDJPY, AUDCAD, AUDCHF, AUDJPY, AUDNZD, CADCHF, CADJPY, CHFJPY, EURAUD, EURCAD, EURCHF, EURGBP, EURJPY, EURNZD, GBPAUD, GBPCAD, GBPCHF, GBPJPY, GBPNZD, NZDCAD, NZDCHF, NZDJPY
I may add more pairs later.
Note: The entry strategy in this script is not intented to win. Check the result. Be careful.

ATR SL/TPThis indicator uses the ATR to give areas where the user might want to take profit or set a stop loss.

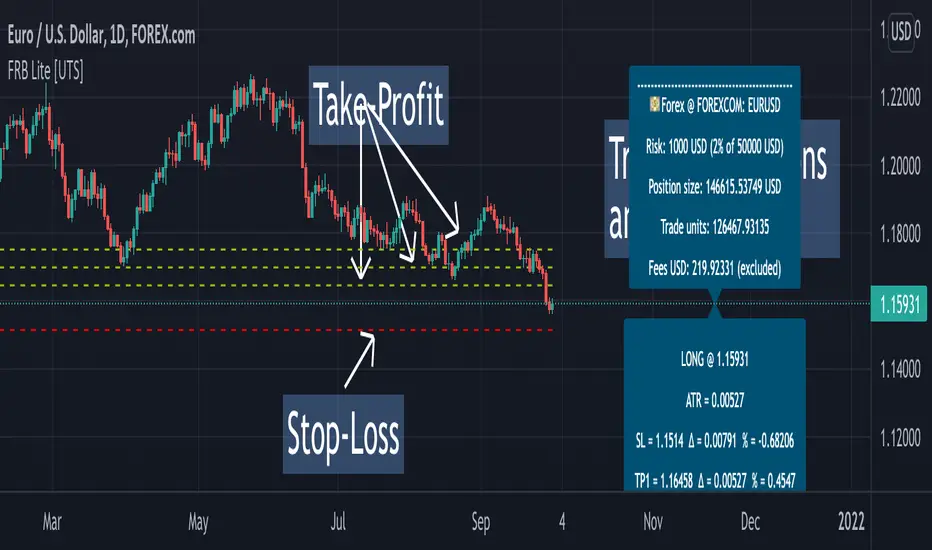
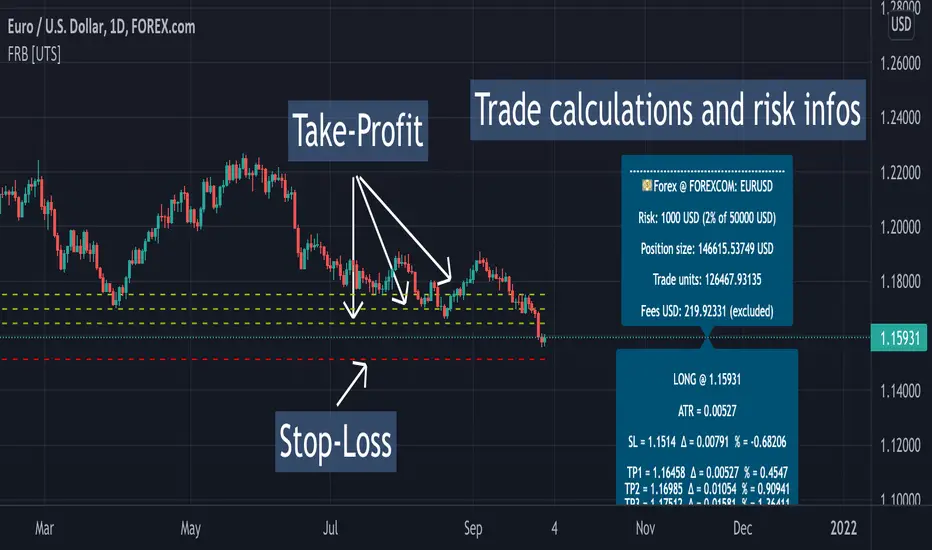
Forex Risk Buddy - Lite: Position Size, SL & TP System [UTS]Forex Risk Buddy - Lite
Position Size, Stop Loss & Take Profit System
The ultimate system to calculate trading risk on forex markets.
The 'Lite' version is limited to the EUR/USD forex trading pair.
💵 Forex
Position Sizing
De-risk possible drawdown by calculating a proper position size.
Define your risk percent based on your net value
Freely define your account currency
Trade any asset by the customizable Base / Quote currency factor
Calculate trading fees
Show all information on a customizable data screen
Stop Loss
Minimize trade risk by calculating your stop-loss.
Percent, Value and Delta display from current price
ATR based (Average True Range, modifiable)
Custom SL value possible
Adjustable
Two visual representations on chart
Automatically and real-time calculated on screen
Take Profit
Multiple take-profit levels to ensure not giving back to the market.
Up to 3 take profit levels to define
ATR based (Average True Range, modifiable)
Custom TP values possible
Easily customizable
Two visual representations on chart
Automatically and real-time calculated on screen
Currencies
Choose an account currency and calculate your risk for every trading pair.
USD
EUR
GBP
AUD
CAD
CHF
HKD
JPY
NOK
NZD
RUB
SEK
SGD
TRY
ZAR
BTC (crypto)
ETH (crypto)
USDT (crypto)
BUSD (crypto)
USDC (crypto)
Forex Risk Buddy: Position Size, SL & TP System [UTS]Forex Risk Buddy
Position Size, Stop Loss & Take Profit System
The ultimate system to calculate trading risk on forex markets.
💵 Forex
Position Sizing
De-risk possible drawdown by calculating a proper position size.
Define your risk percent based on your net value
Freely define your account currency
Trade any asset by the customizable Base / Quote currency factor
Calculate trading fees
Show all information on a customizable data screen
Stop Loss
Minimize trade risk by calculating your stop-loss.
Percent, Value and Delta display from current price
ATR based (Average True Range, modifiable)
Custom SL value possible
Adjustable
Two visual representations on chart
Automatically and real-time calculated on screen
Take Profit
Multiple take-profit levels to ensure not giving back to the market.
Up to 3 take profit levels to define
ATR based (Average True Range, modifiable)
Custom TP values possible
Easily customizable
Two visual representations on chart
Automatically and real-time calculated on screen
Currencies
Choose an account currency and calculate your risk for every trading pair.
USD
EUR
GBP
AUD
CAD
CHF
HKD
JPY
NOK
NZD
RUB
SEK
SGD
TRY
ZAR
BTC (crypto)
ETH (crypto)
USDT (crypto)
BUSD (crypto)
USDC (crypto)
Crypto Risk Buddy - Lite: Position Size, SL & TP System [UTS]
Crypto Risk Buddy - Lite
Position Size, Stop Loss & Take Profit System
The ultimate system to calculate trading risk on crypto assets.
The 'Lite' version is limited to BTC as base currency.
₿ Cyptocurrencies
Position Sizing
De-risk possible drawdown by calculating a proper position size.
Define your risk percent based on your net value
Freely define your account currency
Trade any asset by the customizable Base / Quote currency factor
Calculate trading fees
Show all information on a customizable data screen
Stop Loss
Minimize trade risk by calculating your stop-loss.
Percent, Value and Delta display from current price
ATR based (Average True Range, modifiable)
Custom SL value possible
Adjustable
Two visual representations on chart
Automatically and real-time calculated on screen
Take Profit
Multiple take-profit levels to ensure not giving back to the market.
Up to 3 take profit levels to define
ATR based (Average True Range, modifiable)
Custom TP values possible
Easily customizable
Two visual representations on chart
Automatically and real-time calculated on screen
Currencies
Choose an account currency and calculate your risk for every trading pair.
USD
EUR
GBP
AUD
CAD
CHF
HKD
JPY
NOK
NZD
RUB
SEK
SGD
TRY
ZAR
BTC (crypto)
ETH (crypto)
USDT (crypto)
BUSD (crypto)
USDC (crypto)