Buy the Dips (by Coinrule)Taking your first steps into automated trading may be challenging. Coinrule's mission is to make it as easy as possible, also for beginners.
Here follows the best trading strategy to get started with Coinrule. This strategy doesn't involve complex indicators, yet was proved to be effective in the long term for many coins. Results seem to be improved when trading a coin vs Bitcoin.
The strategy buys the dips of a coin to sell with a profit. A stop-loss protects every trade.
Crypto markets offer high volatility and, thus, excellent opportunities for trading. Excluding times of severe downtrend, buying the dip is a simple and effective long-term trading strategy. The buy-signal is set to a 2% drop in a 30-minutes time frame.
Each trade comes with a take profit and a stop loss. Both set at 2%.
You can adjust these percentages to the market volatility as an advanced setup. You can backtest the outcomes using the backtesting tool from Tradingview
The strategy assumes each order to trade 30% of the available capital. A trading fee of 0.1% is taken into account. The fee is aligned to the base fee applied on Binance, which is the largest cryptocurrency exchange.
Stoploss

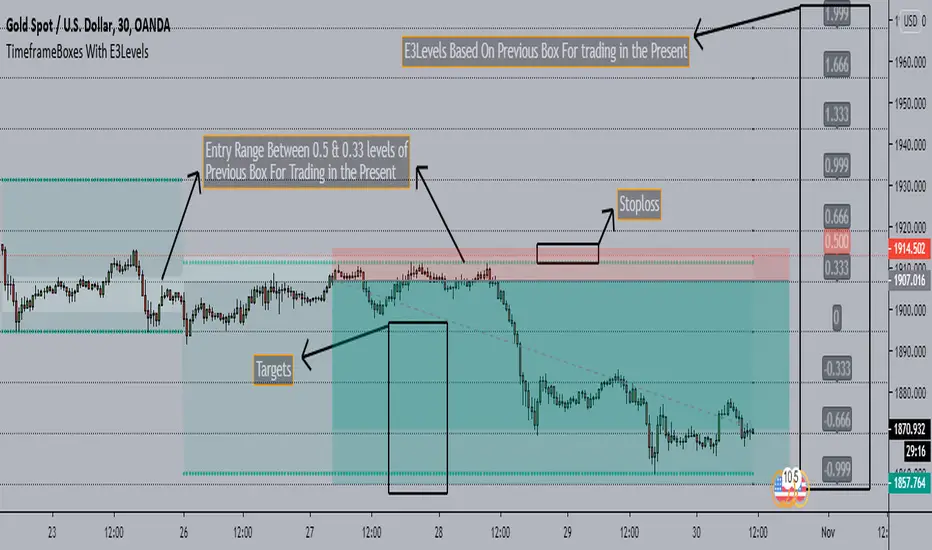
TimeframeBoxes(DailyBox) With E3Levels - SaeedKhakestar Method*** This is a Repaint Indicator that uses HIGH & LOW of Previous Range in the Custom Period(12H,1D,2D,3D & Weekly) for Trading In the Present with E3 Levels
TimeframeBoxes(DailyBox) With E3Levels - SaeedKhakestar Method
Version 1.00
Created by TWA_TradeWithAmir(TWA_PriceActionTips)
Updated 10/29/2020
Based On SaeedKhakestar Method(Trigger Price Action)
*With Entry Range
*With E3 Levels
*12H,1D,2D,3D & Weekly Boxes
*Entry Range & E3 Levels Belongs to Previous Box
*TRex Method
TBT Stop Loss Hunting AlertPurpose:
The TBT Stop Loss Hunting Alert is a simple early warning system that indicates when Bitcoin could have unexpected volatility (in either direction) within a 24 to 48 hour time frame as you can see above (indicated by the red bar/column in the indicator lane). By knowing when there could be possible upcoming volatility for the price of Bitcoin, traders can take preventative measures to protect open positions to preserve profits.
Time Frame:
While you can view this indicator on any time frame, it was originally created with the 6-hour time frame in mind. Because of this, the indicator can be set to "same as symbol" (the indicator will adapt to any time frame you use) or "6 hours" (the original and intended time frame). Please understand that the alert will show "noise" (false positive signals) on faster (lower) time frames. This is another reason to keep the indicator on the 6-hour time frame in its settings.
Metrics:
The TBT Stop Loss Hunting Alert looks at sudden/unexpected changes in price action, volatility, and volume.
Realistic Expectations:
While this indicator is effective in alerting users when there could be sudden volatility for Bitcoin, note that there is no way to know which way Bitcoin will move after the alert is triggered. The frequency of alerts is few and far between, but in a way this is a good thing. When the signal is triggered, it is a great early warning system to remember to be careful for the next 24 to 48 hours.

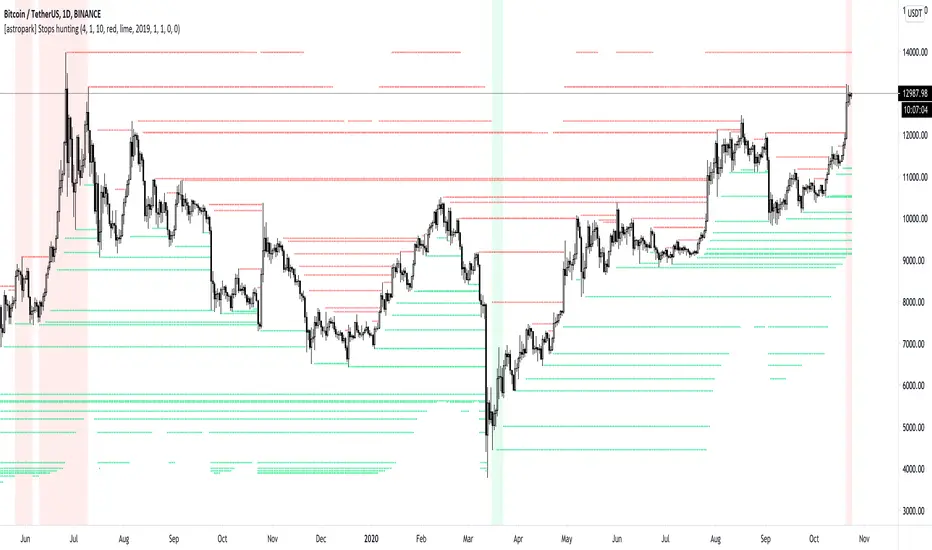
[astropark] Stops huntingDear Followers,
today I'm happy to share with you my Stops Hunting indicator.
This indicators draws lines on important levels, where traders are supposed to set their own stop loss orders .
As per default values you will see
sellers (short) stoploss prices as red lines
buyers (long) stoploss prices as green lines
Market maker move prices towards liquidity, so to hit common traders stoplosses.
Why it acts this way? because stoplosses become fuel for market maker to move price where it wants to, and after latest stoplosses were triggered, then it uses this fuels to make trend reverse to the opposite direction.
To highlight this mechanism, the indicator plots:
red background when there are (almost) no-more sellers' stop losses still to be hit, so the trader can start thinking about opening a sell/short position ,
green background when there are (almost) no-more buyers' stop losses still to be hit, so the trader can start thinking about opening a buy/long position .
This indicator:
works on every timeframe , so it can be used for both swing and scalping trades
has a bias filter to increase or decrease the bullish/bearish backgrounded ranges (the higher the value, the less the width of ranges)
lets you change colours as you like
lets you enable/disable plotting of lines
lets you change lines' thickness and transparency
lets you enable/disable plotting of circles whenever a stoploss is hit
lets you set a starting date/time from which you want the indicator to start its analysis and collecting data for stops hunting
lets you set alerts when a stoploss has been hit/hunted
lets you set alerts when background starting be coloured as explained above
A gentle reminder: always consider setting a stoploss in trades and use a proper money and risk management strategies .
Here there are some examples how the indicator works on many timeframes and markets:
BTC/USDT 1h
LINK/BTC 1h
ETH/BTC 1h
EUR/USD 15m
GBP/USD
Brent Crude Oil 15m
GOLD (XAU/USD) 15m
FaceBook (FB) 15m
Microsoft Corp (MSFT) 15m
This is a premium indicator , so send me a private message in order to get access to this script .
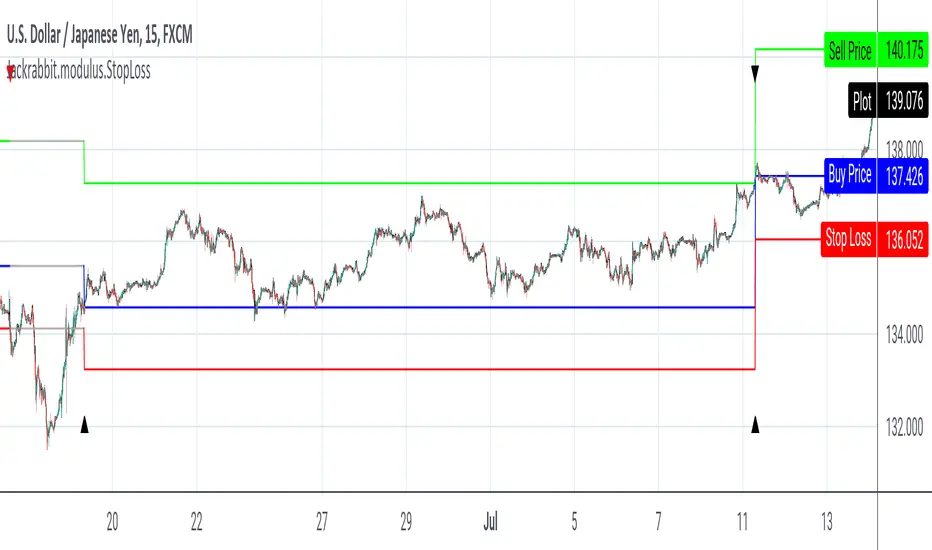
Jackrabbit.modulus.StopLossThis is an algorithic stop loss for the Jackrabbit suite and modulus framework.
This module is not a standalone and relies on previous modules to send a signal data in order to function properly. This module acts on buy and sell data from within the indicator on indicator framework that TradingView supports.
This module is NOT a substitute for a flat percentage based stop loss provided by trading platforms and many exchanges. This is an algorithic approach that is designed to follow the market. Such a methodology has been proven by many traders to help mitigate risk.
This module sets a risk/reward ratio to which a modified ATR is used to determine the stop loss and take profit. Note that the take profit can also be on the basis of the strategy sell markers. A multiplier and a look back are user configurable to help tune the module for more favorable results.
It is important to remember that this module does NOT allow accumulation, so your buying strategy will need to be surigical in nature to maximize your profits.
The Jackrabbit modulus framework is a plug in play paradigm built to operate through TradingView's indicator on indicatior (IoI) functionality. As such, this script receives a signal line from the previous script in the IoI chain, and evaluates the buy/sell signals appropriate to the current analysis.
This script is by invitation only. To learn more about accessing this script, please see my signature or send me a PM. Thank you.
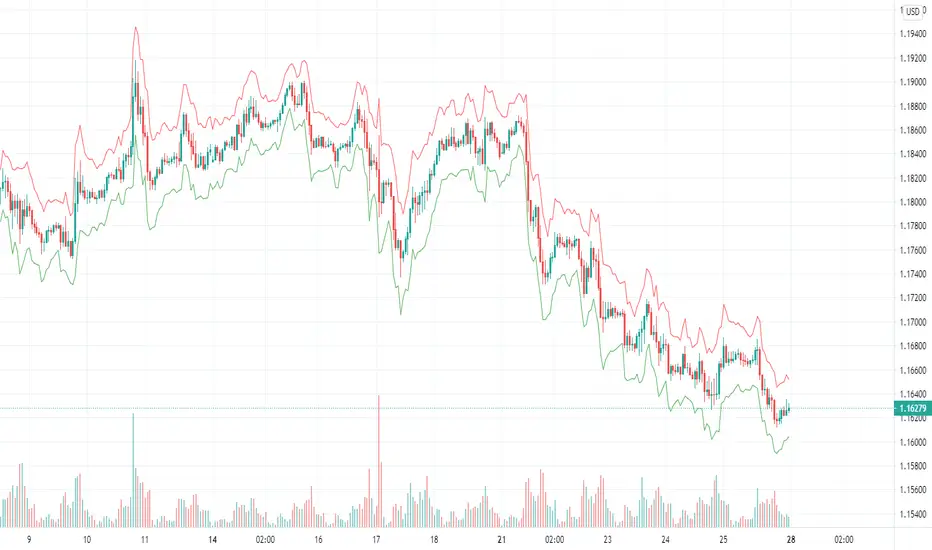
ATR Stop Loss IndicatorIt’s very simple – all it does is calculate your stop loss with trailing stop price.
How It Works
Blue is the current ATR (pips).
Green is your trailing stop-loss price for Long
Red is your trailing stop-loss price for Short .
Settings
ATR Length:
Your ATR Length
Multiplier:
ATR multiplier.
For example, if you want to use a 2x ATR stop, set to 2.

ATR Trailing Stoploss StrategyI am sharing the strategy version of the indicator used before. It is very simple to use.
These are the settings I use, you can change, test and use as you wish.
Atr Period 5
Highest High Period 10
Multiplier 2.5
It can generate more signals in shorter time frames.
The success rate will be higher in longer time frames.

[STRATEGY] Buy/Sell/TP/SL/TSL Alerts ModuleA strategy version of the Buy/Sell/TP/SL/TSL Alerts Module .
It works the same way:
1) You choose a specific indicator and apply it to your chart
2) You create a special signal form of that indicator
3) You connect that form to the module
4) Bob's your uncle
If you have any questions don't hesitate to ask and contact me either via private messages on TradingView or via Telegram.
Thanks!
Tilson T3 and MavilimW Triple Combined StrategyInspired by truly greatful Kivanç Ozbilgic (www.tradingview.com).
The strategy tries to combined three different moving average strategies into one.
Strategies covered are:
1. Tillson T3 Moving Average Strategy
Developed by Tim Tillson, the T3 Moving Average is considered superior to traditional moving averages as it is smoother, more responsive and thus performs better in ranging market conditions as well. However, it bears the disadvantage of overshooting the price as it attempts to realign itself to current market conditions.
It incorporates a smoothing technique which allows it to plot curves more gradual than ordinary moving averages and with a smaller lag. Its smoothness is derived from the fact that it is a weighted sum of a single EMA, double EMA, triple EMA and so on. When a trend is formed, the price action will stay above or below the trend during most of its progression and will hardly be touched by any swings. Thus, a confirmed penetration of the T3 MA and the lack of a following reversal often indicates the end of a trend. Here is what the calculation looks like:
T3 = c1*e6 + c2*e5 + c3*e4 + c4*e3, where:
– e1 = EMA (Close, Period)
– e2 = EMA (e1, Period)
– e3 = EMA (e2, Period)
– e4 = EMA (e3, Period)
– e5 = EMA (e4, Period)
– e6 = EMA (e5, Period)
– a is the volume factor, default value is 0.7 but 0.618 can also be used
– c1 = – a^3
– c2 = 3*a^2 + 3*a^3
– c3 = – 6*a^2 – 3*a – 3*a^3
– c4 = 1 + 3*a + a^3 + 3*a^2
T3 MovingThe T3 Moving Average generally produces entry signals similar to other moving averages and thus is traded largely in the same manner.
Strategy for Tillson T3 is if the close crossovers T3 line and for at least five bars the close was under the T3
2. Tillson T3 Fibonacci Cross
Kivanc Ozbilgic added a second T3 line with a volume factor of 0.618 (Fibonacci Ratio) and length of 3 (fibonacci number) which can be added by selecting the T3 Fibonacci Strategy input box.
Strategy for Tillson T3 Fibo is when the Fibo Line crossover the T3 it gives long signal vice versa.
3. MavilimW
MavilimW is originally a support and resistance indicator based on fibonacci injected weighted moving averages.
Strategy for MavilimW is is if the close crossovers T3 line and for at least five bars the close was under the T3
Hope you enjoy

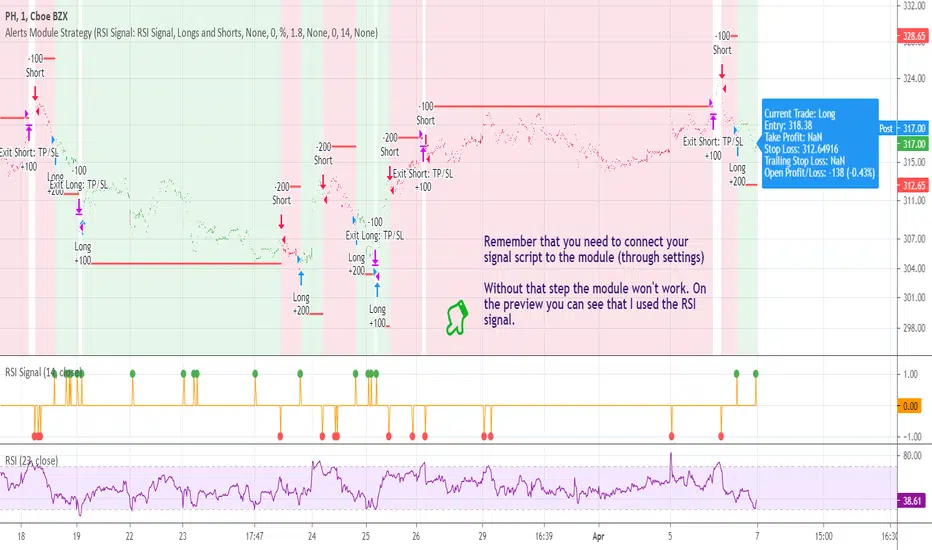
Buy/Sell/TP/SL/TSL Alerts ModuleThis tool is not a self-sufficient indicator, just an attachable module that allows you to enhance a specific indicator with risk management components without having a headache.
What you need to do, and actually this is the most important step, is to rewrite your indicator to a buy-sell signal form which will output only -1, 0, 1 values and then connect it to the module.
After that the module gives you a lot of possibilities to customize Take Profit, Stop Loss and Trailing Stop Loss levels through the settings window and to set all the alerts you need up.
Simple Buy/Sell setup for the RSI:
Now I am adding Stop Loss:
and Take Profit:
and finally Trailing Stop Loss:
Okay, I have shown how it works with RSI signals. Here is example for the MACD:
and example for the WaveTrend Oscillator:
If you have any questions don't hesitate to ask and contact me either via private messages on TradingView or via Telegram

Stop Loss PanelHere is a label panel that shows the stop-loss number for Long or Short trades based on volatility using average true range and and a mult of that.

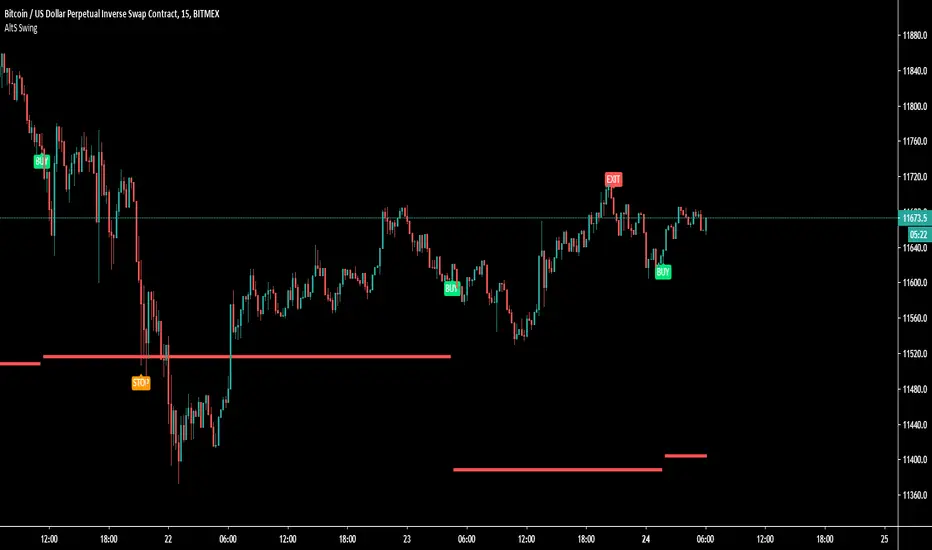
AltS Swing (INV)
PLEASE READ THIS DESCRIPTION TO SAVE TIME AND UNDERSTAND WHAT THIS INDICATOR DOES
This is a official version of AltSignals Long/Short Reverse Indicator
Description:
This indicator uses various indicators in combination with each other, some of the key ones to mention is Hulls, EMA , MA. Along with that it uses EMA crossovers to get the precise entries and exits.
The recommended time frames with this indictor are shorter ones, for example 5m,10m,15m work well, along with that I have found that some of the more unique time frames also work well such as 20m,45m,2hr and so on.
This indicator is not super advanced but it's still very powerful, with only 130 lines of code.
This indicator works on every chart, time, and candle type but you must play with the settings to find what is best, the same setting will not work on every pair etc.
With AltSignals Swing Indicator it trades one way, that means it gives 3 pieces of information. BUY/TakeProfit/StopLoss.
Unlike most indicators which Buy and Sell both ways this one focuses on one direction of trading so please take into account when using this.
I have added in a reverse strategy which basically shows the opposite values of of the buy, so if you select the box in the settings and un-tick it, then it will show opposite directions so sells only.
This feature is very useful especially in general bear markets when buying is difficult.
I have also added in the option for no stop losses to be used, if you set the stop loss value = 100 then it will show no stop losses.
I suggest a stop loss somewhere in the region of 1-2-3%, please note that you can use decimal stop losses too so for example 0.1 or 0.5.
This indicator is NOT a once size fits all, every chart is different, time frame and candles also, so i would suggest spending some time going through and playing with the channel length settings, which will change the EMA numbers.
Using this along with the back script to find the ideal settings is the best way to use this script, once you have done that make sure to save those values somewhere.
Its important to remember that the Regular script and the back testing script values should be the same for them to match up on the chart, so the channel lengths, stop losses and so on values should be the same.
Side note
This is not financial advice.
We will continue making updates as time goes on.
If you would like to try this script for free please visit our website or message us on Tradingview live chat.
Shenlong V2.3 - Trend cycleShenlong V2 is a script developed to facilitate the interpretation of long and short entries according to various conditionals that play with the trend.
The use of trend clouds has been implemented, which can be used as dynamic support / resistance . They also allow us to identify the current price cycle according to these guidelines, marking with a LONG or SHORT depending on the cycle in question. The appearance settings are user configurable. You can set alerts (long o short) to be aware of movements.
The use of recommended stop loss has been implemented, this can be used as a trailing stop to ensure profits or give the possibility of catching the trend, since it will move as the price forms its structure.
An information panel on stop prices has been implemented for ease of use.

Triple ATR multiplier - 3 ATR Values in OneHere you can choose to plot 3 different ATR values in 1 window. I use this indicator to get the values of my stop loss and take profits.
You can change the multiplier value for each ATR Line and the length of the base ATR.
Ty

Trend trader StrategyFirst I would like to thank to @JustUncleL since this strategy started from one of his scalper strategies
This strategy can be adapted to all time charts .
First it has the session where we want to trade, for this example I choosed the EURUSD so I only take in consideration london/neywork session.
Its made from 3 EMA :
normal
slow
ultra slow
It has has the capacity to use HA candles into consideration if its needed.
At the same time we have a price channel made from faster MAs, that act like a bollinger band .
Together with all of them, we establish which trend we have if its uptrend or downtrend
Then we check the candles if they are below or above the MA , and based on the condition if they crossed recently we can suggest if its a buy or a long condition
At the same time we have 2 options of stop conditions:
Through a trailing stop made from ATR or % based
And second, a SL/TP made from pip points or % based.
For this example I used % based.
Let me know what you think about it, and if you found some nice settings for it. So far I only adapted to EURUSD 1 min time.

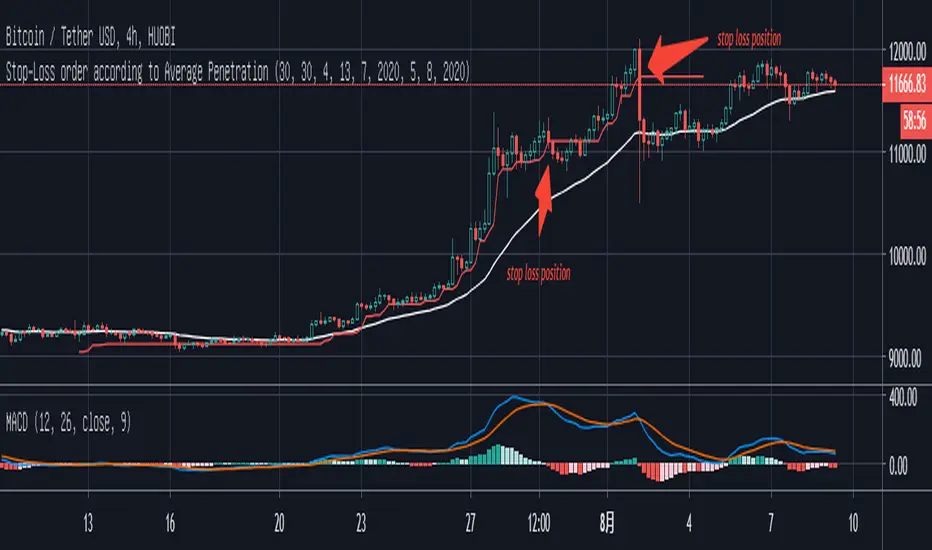
Stop-Loss order according to Average PenetrationAs a engineer, the view of signal and noise in the book of "Trading for a living"really interests me. For a trader the biggest issue is when should we enter and exit the market. The view of safety range stop loss may help to solve this problem for some beginner and give you a new idea of stoploss for you trade system
Here is the content from Trading for a Living
you may use the slope of a 22-day EMA to define the trend. You need to choose the length of the lookback period for measuring noise level. it has to be long enough to track recent behavior but short enough to be relevant for current trading. A period of 10 to 20 days works well, or we can make our lookback period 100 days or so if we want to average long-term market
if the trend is up, mark all downside penetrations during the look-back period, add their depths, and divide the sum by the number of penetrations。 This gives you the Average Downside Penetration for the selected look back
if today's low is lower than yesterday's, do not move your stop lower since we are only allowed to raise stops on long positions, not lower them
Reverse these rules in downtrends. When a 22-day EMA identifies a downtrend, count all the upside penetrations during the look-back period and find the Average Upside Penetration. Multiply it by a coefficient, starting with two. When you go short, place a stop twice he Average Upside Penetration above the previous day's high. Lower your stop whenever the market makes a lower high, but never raise it.
The important thing when you make an order is to hold your earning during a trending scenario. To avoid stopping loss by the variance in the market and to avoid big loss if the market shift to another direction in a short time.
From the graph there, I select the most recent trend up period in the Bitcoin and adjust the parameters according to this trend.
As you can see, the stop loss is away from the lowest price in bar, so that you will not be forced to exit the trade by small turbulence. You can hold your order and need to worry about missing the trend. But there are always sharp plunges in the uptrend. you can see two cursors on the graphic. The stop loss will help you avoid this plunge.
But in my opinion, this will be the hard stop loss in your trade. Help you to keep profit and avoid big loss. To maximize the profit, you had better to build you own strategy.
When I try to create this indicator, it is found that two rule for this indicator
1. you had better to use it in a clear trend range. Since the stop loss can only be higher in a long condition and lower in a short condition. If you use it in a volatile market., then stop loss doesn’t make any senses.
2. you need to adjust those parameters according to the market and the trend you are in. Some people like to avoid big loss, you can set them this depending on you experience
Last, this is getting from the view in the book, i didn’t do any back test for it. So please be careful to use it and let me know if you have any suggestions or ideas.
MACD VWAP IndicatorThis indicator uses a combination of the VWAP, EMA 9 and parts of the MACD in order to detect a bullish or bearish trend.
How to trade it:
Set SL either below or above the VWAP line (orange) and TP to 1:1.5 ratio (depending on last few candles, of course).
If EMA200 is close by then place SL either below or above EMA200 (blue) and TP to 1:1.5 ratio
Important:
Best traded in 15M, 30M => Intraday.
Have fun! :)

lineAlertslineAlerts is a powerful tool to define Buys, Sells and Buy-Sell lines for repeating actions.
The possibilities vary from 1 Buy and/or Sell to repetitive Buying and Selling at definable lines from a specified point in time (Year, Month, Day and Hour to begin).
lineAlerts provides:
+ optional StartBuy and optional EndSell
+ in repeat mode: optional definable ending-action (Buy or Sell, which overwrites Stop-Out/Abort)
+ buy- and sell Lines can be angled separately by using non-zero entries in the Angle %perDay parameter
+ configurable Stop Loss (Percentage, Stop-Out/Abort-Only, Flat or Angled like Buy-Sell-Lines)
+ profit calculation and effective alerts can be set further than the beginning time (ActiveAfter#Hours)
+ empty-bar-correction for lower-liquidity pairs on short timescales (automatically on)
+ optional visual extension to the right for currently active buy-sell lines
+ Slippage Max. Percentage parameter, added to order price for Buying, subtracted for Selling
(represented in the Buy-Sell markings and LastPrice lines, also calculated in Profit/Loss percentages)
+ Full Autoview Alerts automation in the Order parameters (for spot trading, this can be replaced with
your own API commands while creating or modifying the TradingView alerts):
- Separate order size entries for Buying and Selling
- Choice between Percentage or absolute Amount for both Buying and Selling
(choose the corresponding alert-drop-down option when creating an alert!)
The timeframe for running lineAlerts depends on the scale (duration) of the defined pattern.
Running on a very small resolution, e.g. 1-5 Min, is suitable for a pattern of a few days to a week at most.
This is because of the limited available historic data. Keeping your pattern lines shorter than a week on these micro-timeframes will produce accurate results/output. A pattern which may last a few weeks or even months can run flawlessly on a 1H resolution for example.
"Once per bar" is the best alert option in any case. To avoid multiple signals within 1 bar in highly volatile times, it is better to create the alert on the 1 or 4 Hour chart in stead of the daily chart for a pattern of multiple weeks for example.
lineAlerts is suitable for any timeframe on any chart which is open 24/7, like most crypto currencies.
My other published indicators contain a handy combination of new and classical indicators and oscillators.
With lineAlerts, the one defining the lines is in complete control. Results might indicate how good one is at defining trade patterns and at defining suitable stop losses, but lineAlerts is not an indicator as such.
lineAlerts is more something like a visually definable price-line alerter with various stop loss and ending options. There will be a video available with some more explaining.
WARNING:
Note that if an Autoview extension is active for the charted exchange and the according TradingView alerts are activated, it works right out of the box, so make sure to have all order decimals right...
GuidoN - December 2019, July 2020

SIDD-Master-Moving-AverageSIDD-Master-Moving-Average is based on RSI average calculation Moving average plotted on chart.
This Moving Average is giving 2 signals Bullish and Bearish .
Whenever Bullish signals is coming price is doing crossover with moving average on upside and this indicate price will go up from current market price.
Whenever Bearish signals is coming price is doing cross-under with moving average on downside and this indicate price will go down from current market price.
Moving average color is changing based on upside movement or downside movement , for upside its green and for downside its orange color.
This indicator i have created with stop loss line means any price close below cross line for bullish position then that trade should be closed and take the stop loss. similarly for Bearish trade and candle close above stop loss line means trade should be closed and take the stop loss.
Stop loss i have taken care with ATR and Super trend you can see the settings.
I have defined setting for general use of indicator if any modification on setting then result may vary.
Its multi time frame moving average. And I have given time frame for indicator as well so if any trending move need to capture then that setting need to be increased with respect to chart time frame else keep it same.
I have added commission and slippages as well in indicator.
Ping me or DM me to subscribe this indicator.
I have given all my indicator details below link (Signature URL). You can check indicators and call me on given number or email me on given email to access the scripts and indicators. Telegram link is also given you can ping me there.
--------------------------------------------------------------------------------------------------------------------------------------
Disclaimer : Past performance of the indicator is not giving guarantee for future performance as well, it may change as per market condition.
-------------------------------------------------------------------------------------------------------------------------------------

[CP]ATR Triple Stop Loss LevelsATR based Triple Stop Loss levels that are plotted on the chart (like moving averages!).
With ATR Levels plotted on the price chart itself, you can better set your volatility based trailing Stop Loss.
Also helps to define the SL when making an entry into a stock.
Note:
This indicator is supposed to be used on Daily and Weekly Charts.
For other timeframes you would need to tweek the default parameters.

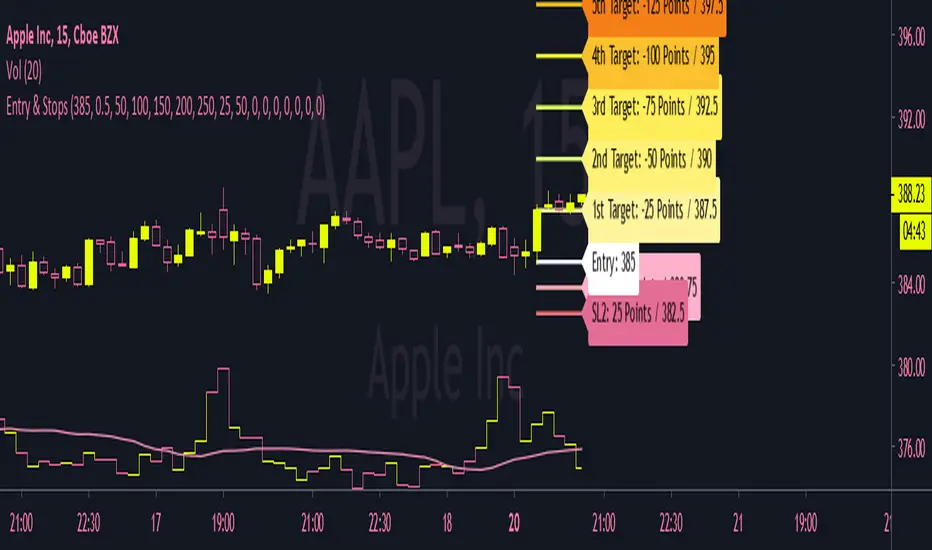
Perfect Risk Management Setup !Simple and clean Perfect Risk Management Setup !
5 Targets included with Entry !
2 Stops included !
+ Dir is for long setting Long Sl and Targets
- Dir is for setting Short Sl nd Targets
* Manualy one can set Sl and Targets according to their risk management !
Two Take Profits and Two Stop LossThis script is for research purposes only. I am not a financial advisor.
Entry Condition
This strategy is based on two take profit targets, two stop loss, and scaling out strategy. The entry rule is very simple. Whenever the EMA crossover WMA, the long trade is taken and vice versa.
Take Profit and Stop Loss
The first take profit is set at 20 pips above the long entry and the second take profit is set at 40 pips above the long entry. Meanwhile, the first stop loss is set at 20 pips below the long entry and the second stop loss is set at the long entry.
Money Management
When the first take profit is achieved, half of the position is closed and the first stop loss is moved to the entry-level. The rest of the position is open to achieve either second take profit or second stop loss.
There are three outcomes when using this strategy. Let's say you enter the trade with 200 lot size and you are risking 2% of your equity.
1. The first outcome is when the price hits stop loss, you lose the entire 2%.
2. The second outcome is when the price hits the first take profit and you close half of your position. Meaning that you have gained 1%. Then you let the trade running and eventually it hits the second stop loss. Remember your first stop loss has changed to the second stop loss when the first take profit is achieved. The total loss is 0% because the price is at your entry-level. You have gained the earlier 1% and then lost 0%. At this point, you are at 1% gained.
3. The third outcome is similar to the second out but instead of hitting the second stop loss, the trade is running to your favor and hits the second take profit.
Therefore, you gained 1% from the first take profit and you gained another 2% for the second take profit. Your total gained is 3%
Summary
The reason behind this strategy is to minimize risk. with normal strategy, you only have two outcomes which are either win or loss. With this strategy, you have three outcomes which win 3%, win 1%, or loss 2%.
This is my similar strategy but with single stop loss
