TrendzonesHi all!
This indicator plots trendlines. These lines are not plotted as traditional lines, but are instead zones. This is useful if you think that trend lines are more of an area of importance than a line.
It does so by finding pivots and connecting two of them if they have not been broken (more about that later) in-between the pivots.
These trend zones can be used as support/resistance that the price can react to.
• The first trendline is drawn between the high/low of the first and second pivot.
• The second trendline's first point is at the open/close of the pivot (either the first pivot or the second one) that has the smallest difference between the high/low and the nearest open/close. The same difference (between the high/low and the open/close) is then subtracted from the other pivot's high/low. This creates a point at the other pivot bar. A trendline is then drawn between the points.
This creates two trendlines and a zone between the two trendlines. This zone is the one kept and is shown by the script.
You can define the pivot lengths used to find trend zones (defaults to 3/3). You can also define the number of pivots to look back for, to find trend zones and the number of active zones, both of these defaults to 3. You can also choose to let the script create new zones based on time ("Oldest") or the zone that is furthest away in price, this defaults to be based on time but it can be useful for letting the script remove the one which is furthest away in price. Another useful setting is the one called "Cross source". This defines the price that has to cross the trend zone to make it invalid (broken). This defaults to "Close", i.e. the bar has to close on the "wrong side" of the trend zone.
The current zones are shown with an extension to the right, but you can also choose to keep the previous lines (without extension). Please note that kept zones are only the ones that are broken, not the replaced ones. I.e. the zones that are kept are the ones that are crossed by the user defined "cross source" (defaults to the closing/current price of the bar).
Hope this makes sense, let me know if you have any questions.
Best of trading luck!
Supporto e resistenza

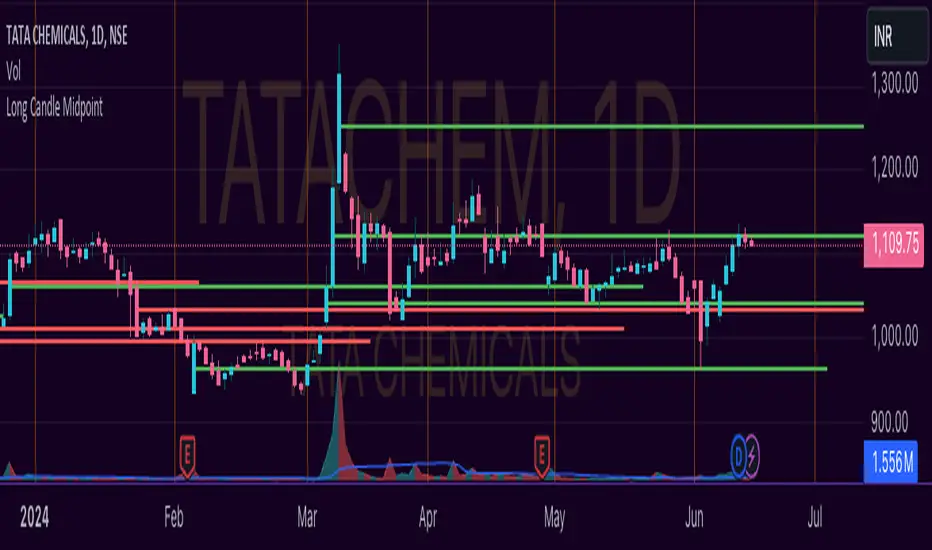
Unlocking the Power of Long Candle MidpointI'm excited to share with you a fascinating concept that can help you identify potential breakout points in the market.
The Pine Script code provided below is designed to identify the midpoint of a long candle, which can be a crucial level for traders to watch.
In this blog post, we'll dive deeper into the concept, explore its applications, and analyze a real-life example of TATACHEM listed on NSE, which is currently trading around a potential psychology line.
What is the Long Candle Midpoint?
The long candle midpoint is a technical indicator that calculates the midpoint of a candlestick that has a significant price movement. This midpoint is then used to draw a horizontal line, which can serve as a potential support or resistance level. The idea is that if a candlestick has a large price movement, it's likely that the market will react to this movement by testing the midpoint of the candle.
How Does the Long Candle Midpoint Indicator Work?
The Pine Script code provided above is designed to calculate the midpoint of a long candle based on the following parameters:
Length: The length of the candlestick is calculated using the len input parameter.
Line Length: The length of the line is calculated using the linExt input parameter.
Calculation Method: The calculation method can be set to either "Highest True Range", "Average True Range", or "Both".
Multiplier: The multiplier is used to adjust the midpoint calculation based on the average range of the candlestick.
The script then plots a horizontal line at the midpoint of the long candle, which can be used as a potential support or resistance level.
Real-Life Example:
Let's take a look at TATACHEM, a stock listed on the National Stock Exchange of India (NSE). As you can see in the chart below,
TATACHEM has been trading around a potential psychology line drawn from the midpoint of a large candle.
As you can see, the stock has previously failed to break above this line, but it's currently trading around it. This could be a sign that the market is preparing for a potential breakout. If the stock can break above this line, it could lead to a bullish rally.
Conclusion
The long candle midpoint indicator is a powerful tool that can help traders identify potential breakout points in the market. By analyzing the midpoint of a long candle, traders can gain insights into the market's sentiment and potential areas of support or resistance.
In the case of TATACHEM, the stock is currently trading around a potential psychology line, which could be a sign of a potential breakout. Traders can consider this point in their watch list for a potential entry. Tips for Traders
Use the long candle midpoint indicator in conjunction with other technical indicators to gain a more comprehensive understanding of the market.
Look for confirmation from other indicators before entering a trade.
Set stop-loss and take-profit levels based on the potential breakout point.
Monitor the market closely and be prepared to adjust your strategy if the market doesn't behave as expected.
By incorporating the long candle midpoint indicator into your trading strategy, you can gain an edge in the market and make more informed trading decisions.
Wave Consolidation [LuxAlgo]The Wave Consolidation indicator uses market profiles to highlight consolidation zones based on upward and downward moves determined when a Higher-High or Lower-Low is created.
Users can control the amount of consolidation zones to display and the sensitivity of the swing point detection used to return those zones.
🔶 USAGE
These zones are intended as areas of interest to traders where price has seen historical interactions, which can be interpreted as support and resistance. By identifying these areas of interest before the price returns to them, traders are able to anticipate and prepare for various scenarios and respond dynamically to the behavior of the market, as seen below.
Rejection: A quick move away from the zone may indicate that the area is either overvalued or undervalued, leading to a fast movement in the opposite direction.
Breakthrough: Moving beyond a zone could indicate acceptance at that specific price, potentially signaling a shift in momentum or the start of a new trend. In a strong major trend, zones created from smaller trends could be used as price targets for taking profit and managing risk.
Consolidation: Holding these zones might suggest a market in balance at these levels, this could lead to opportunities for range-bound trading.
Below is an example of the Rejection and Consolidation scenarios described above.
Note: By analyzing the tests and retests of these zones, traders can also gain further insight into where participants are interacting in the market.
🔶 DETAILS
The full process for acquiring and managing these zones is described in the sub-sections below.
🔹 Creation
By only considering market movements creating a higher-high or lower-low, we can identify meaningful, directional, moves which can then be used to calculate zones.
Once a move is identified, the script calculates a volume profile spanning the length of the given move.
The width of the zones is determined starting from the POC of the profile and expanding outwards until the value of the profile's row falls below the profile's average.
Note: By increasing the "Multiplier" Input, Users can increase the threshold the script uses to determine zone width in multiples of Standard Deviations above the Average.
While this area is similar to a VP Value Area, it is not intended to replicate a value zone. The calculation is not concerned with capturing any % of the total profile's volume within the zone and only analyzes based on a fixed inclusion threshold.
🔹 Management
To keep clutter to a minimum, If a new zone overlaps a recently created zone, the zones are grouped as one. This is especially helpful in areas where prices are ranging, creating multiple zones in a very similar area.
Zones before management:
Zones after management:
🔹 Deletion
Just because a zone is crossed, does not make it immediately unimportant!
Once a Zone is mitigated (crossed in the opposite direction of its bias) it is reduced to a single dotted line representing the outer threshold for the zone. These lines are important to watch, as the price will often retest a break. For this reason, they will stay on the chart until the next swing point is detected when they will finally be deleted for good.
Below is an example of activity around a broken zone before it is deleted.
Below is the same example 2bBars later , once the new swing is confirmed, the dotted lines are deleted and new zones are created.
Notice how the newly formed resistance zone is in the same area where we noticed sellers previously.
🔶 SETTINGS
🔹 Structure
Display Structure: Determines if swing structures are displayed.
Structure Length: Sets Length for structure identification.
🔹 Zones
Volume-Based Calculations: Opt to use a "Volume" based Profile Calculation instead of the default "Price Action" based Calculation.
Display Count: Sets the specific number of bullish and bearish zones to display on the chart.
Multiplier: Sets the multiplier to use for the value cut-off for determining zone boundaries.
🔹 Style
Display Average Lines: Toggles on/off the average (mid) lines for the zones.

Initial Balance [UkutaLabs]█ OVERVIEW
The Initial Balance Indicator is a powerful trading tool that indicates a strong range based on the high and low of the first hour after market open. This range serves as a potential area of Support or Resistance that traders should be aware of during their trading. Because of this, the Initial Balance Indicator is a versatile trading tool that can be included in a wide variety of trading strategies.
The aim of this script is to simplify the trading experience of users by automatically identifying and displaying price levels that they should be aware of.
█ USAGE
When the New York Market opens each day, the script will automatically identify and label the opening range of the first hour of the trading day in real time.
Because there tends to be a spike in volume during this period, the range that is identified can serve as a powerful indication of overall market strength. Once the price breaks out of this range, it then can be used as an area of support or resistance depending on the direction of the breakout.
█ SETTINGS
Configuration
• Display Mode: Determines the number of days that the script should load.
• Show Labels: Determines whether identifying labels are drawn on the chart as well.
• Initial Balance Color: Determines the color of the range and labels that are drawn by the indicator.
• Extension Levels: Determines the number of extension levels that should be drawn on either side of the range. These levels are drawn at an interval of half the width of the Initial Balance range.
• Extension Levels Color: Determines the color of the extension level lines.

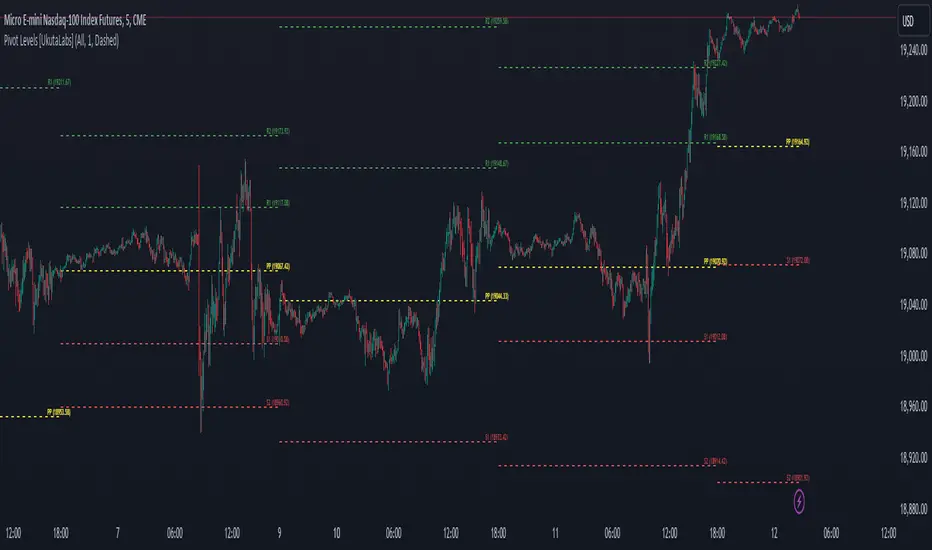
Pivot Levels [UkutaLabs]█ OVERVIEW
The Pivot Levels Indicator provides real-time insight into key price levels within the market that can serve as powerful support and resistance levels. These levels are based on currently-relevant price-action information to ensure that the lines being drawn provide the most value to traders regardless of their trading style.
The aim of this script is to simplify the trading experience of users by automatically identifying and displaying price levels that they should be aware of.
█ USAGE
At the beginning of each trading day, the script will identify the previous day’s hlc3 level. We refer to this level as the day’s Source Level, and it is from this price that the other Resistance and Support levels are calculated.
The script then identifies the total price range of the previous day (Previous Day High - Previous Day Low), then draws Resistance and Support lines based on the Source Level and the previous day’s range.
The script identifies these levels on both sides of the Source. Levels above the Source are considered to be points of Resistance and below the Source are considered to be Support, but the levels are free to be interpreted and used in whatever way fits the user’s trading strategy.
A label is drawn at the end of each line that identifies the line and whether it represents support or resistance. These labels can be disabled in the settings.
█ SETTINGS
Configuration
• Show Labels: Determines whether or not labels are displayed at the end of each line.
• Display Mode: Determines the number of days for the script to load.
Line Settings
• Resistance Color: Determines the color of the resistance lines and labels above the Source Level.
• Source Color: Determines the color of the source line and label.
• Support Color: Determines the color of the support lines and labels below the Source Level.
• Line width: Determines the width of lines.
• Line Style: Determines the style of lines.
Psychological Levels [UkutaLabs]█ OVERVIEW
The Psychological Levels Indicator provides real-time insight into key price levels within the market that can serve as powerful support and resistance levels. These levels are updated automatically in real time to display only the most relevant levels to the current price, facilitating your trading experience.
The aim of this script is to simplify the trading experience of users by automatically identifying and displaying price levels that they should be aware of.
█ USAGE
On each tick, the nearest key price level is automatically identified by the script. The script will identify this level based on the price of the commodity you are applying it to:
• Commodities priced at $0 to $999.99 will identify the nearest whole dollar.
• Commodities priced at $1,000 to $9,999.99 will identify the nearest $10.
• Commodities priced at $10,000 to $99,999.99 will identify the nearest $100.
• Commodities priced over $100,000 will identify the nearest $1,000.
We refer to this rounding price as the gap price, and it is also used to determine the prices of the other lines drawn by this script.
After identifying the nearest key price level, the script then incrementally draws lines on either side of this level at an interval of the gap price. We refer to these as the Major Lines, and the user can control the number of these lines that get drawn, the style of these lines, and they can be disabled in the settings.
The script then draws lines at the half-way point between each of these Major Lines, and we refer to these as the Minor Lines. Like the Major Lines, the user has full control over the number of these lines that can be drawn, the style of these lines, and they can be disabled in the settings.
█ SETTINGS
Configuration
• Number of Lines: Determines the number of lines that are drawn on either side of the key price line. This controls both the number of Major Lines and Minor Lines.
Line Settings
• Major Lines: Determines whether or not the Major Lines will be displayed.
- Color: Determines the color of Major Lines.
- Style: Determines the style of Major Lines.
- Width: Determines the width of Major Lines
• Minor Lines: Determines whether or not the Minor Lines will be displayed.
- Color: Determines the color of Minor Lines
- Style: Determines the style of Minor Lines
- Width: Determines the width of Minor Lines

Opening Range Breakout [UkutaLabs]█ OVERVIEW
The Opening Range Breakout is a powerful trading tool that indicates a strong range based on the high and low of the first fifteen or thirty minutes after market open. This range serves as a potential area of Support or Resistance that traders should be aware of during their trading. Because of this, the Opening Range Breakout is a versatile trading tool that can be included in a wide variety of trading strategies.
The aim of this script is to simplify the trading experience of users by automatically identifying and displaying price levels that they should be aware of.
█ USAGE
When the New York Market opens each day, the script will automatically identify and label the opening range in real time. The user can control whether the script measures the first 15 or 30 minutes of each trading day to fit each trader’s trading style.
Because there tends to be a spike in volume during this period, the range that is identified can serve as a powerful indication of overall market strength. Once the price breaks out of this range, it then can be used as an area of support or resistance depending on the direction of the breakout.
█ SETTINGS
Configuration
• Show Labels: Determines whether labels are drawn within the range.
• Display Mode: Determines the number of days the script should load.
Range Settings
• 15 Minute: Determines whether or not the 15 minute range is drawn.
• 15 Minute Color: Determines the color of the 15 minute range and labels.
• 30 Minute: Determines whether or not the 30 minute range is drawn.
• 30 Minute Color: Determines the color of the 30 minute range and labels.

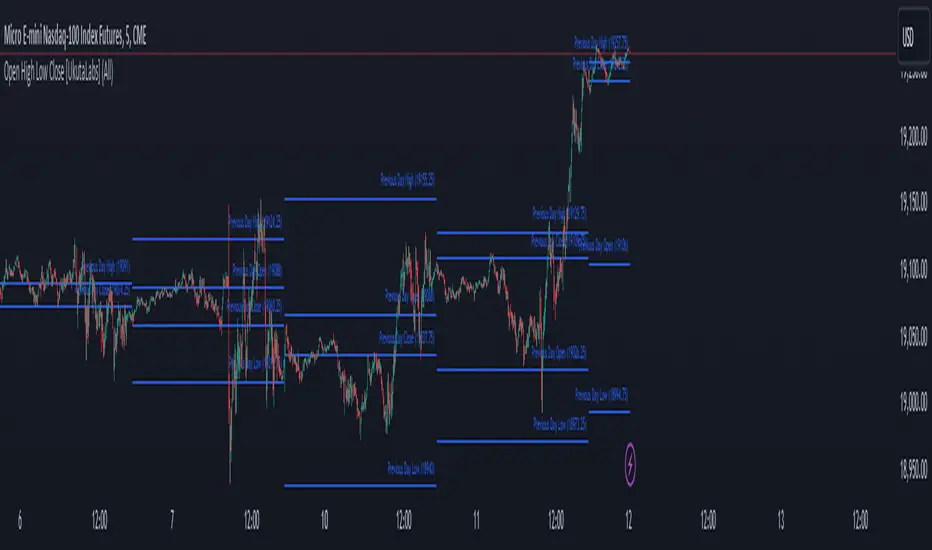
Open High Low Close [UkutaLabs]█ OVERVIEW
The Open High Low Close indicator is a powerful trading tool which generates resistance and support levels based on the previous day’s Open, High, Low and Close prices. These levels may act as strong levels of support and resistance, granting traders insight into key price levels.
The aim of this script is to simplify the trading experience of users by automatically identifying and displaying price levels that they should be aware of.
█ USAGE
At the beginning of each trading day, the script will automatically identify the previous day’s high, low, open and close prices. After identifying these levels, the script will then display them as a line on the chart.
Each line also has a label at the end indicating which level it represents. These labels can be toggled in the indicator's settings.
These levels are based on relevant price-action information and may serve as potentially powerful Support and Resistance levels that can be included in a variety of trading strategies.
█ SETTINGS
Configuration
• Show Labels: Determines whether or not identification labels are drawn on each line.
• Display Mode: Determines the number of days the script should load.
• OHLC Color: Determines the color of the lines and labels.
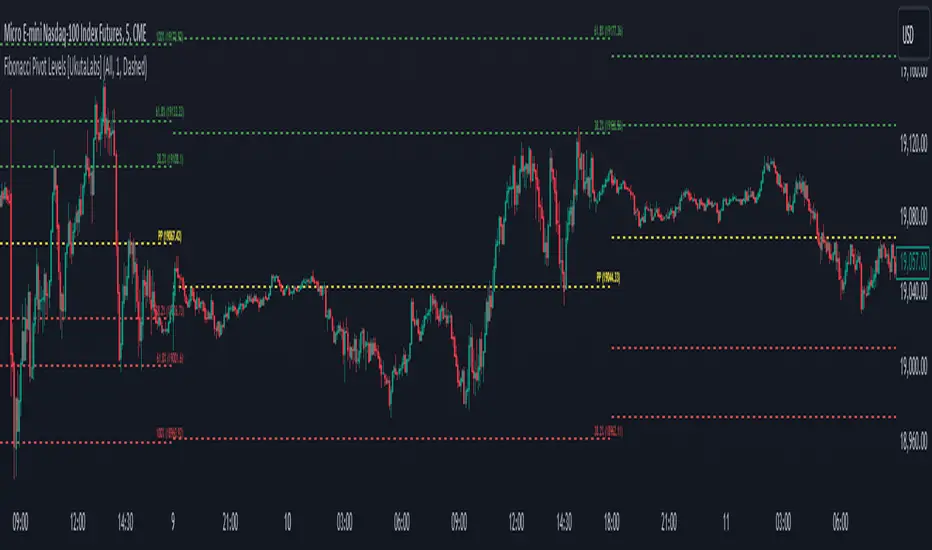
Fibonacci Pivot Levels [UkutaLabs]█ OVERVIEW
The Fibonacci Pivot Levels Indicator provides real-time insight into key price levels within the market that can serve as powerful support and resistance levels. These levels are based on currently-relevant price-action information as well as key Fibonacci ratios to ensure that the lines being drawn provide the most value to traders regardless of their trading style.
The Fibonacci levels are a powerful form of technical analysis that allows traders to predict future potential price support and resistance levels.
The aim of this script is to simplify the trading experience of users by automatically identifying and displaying price levels that they should be aware of.
█ USAGE
At the beginning of each trading day, the script will identify the previous day’s hlc3 level. We refer to this level as the day’s Source Level, and it is from this price that the other Resistance and Support levels are calculated.
The script then identifies the total price range of the previous day (Previous Day High - Previous Day Low), then incrementally draws lines at a distance of the previous day’s range multiplied by key Fibonacci ratios from the Source Level.
The script identifies these levels on both sides of the Source. Levels above the Source are considered to be points of Resistance and below the Source are considered to be Support, but the levels are free to be interpreted and used in whatever way fits the user’s trading strategy.
A label is drawn at the end of each line that displays the Fibonacci ratio that was used to calculate it as well as the price that the line represents. These labels can be disabled in the settings.
█ SETTINGS
Configuration
• Display Mode: Determines how many days the script will draw lines for.
• Show Labels: Determines whether or not labels are drawn at the end of each line.
Line Colors
• Resistance Color: Determines the color of Resistance Lines drawn above the Source.
• Source Color: Determines the color of the Source Line.
• Support Color: Determines the color of Support Lines drawn below the Source.
Line Settings
• Line Width: Determines the width of all lines.
• Line Style: Determines the style of all lines.
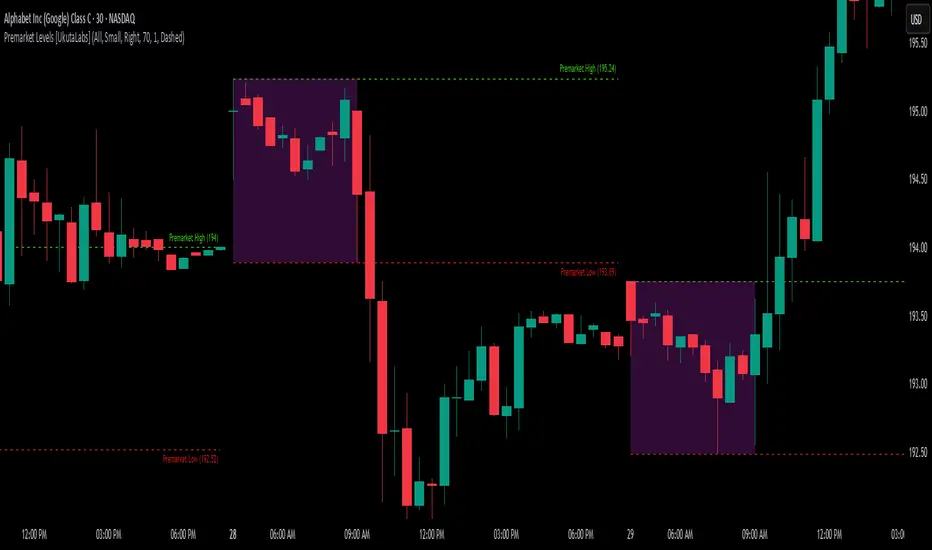
Premarket Levels [UkutaLabs]█ OVERVIEW
The Premarket Levels indicator measures the premarket high and low of any given market. The Premarket Levels creates potential strong resistance and support levels based on the premarket high and low which traders can use to gauge the market outlook ahead of the regular open.
The aim of this script is to simplify the trading experience of users by automatically identifying and displaying price levels that they should be aware of.
█ USAGE
At the beginning of the New York Session of each trading day at 1:30pm UTC time, this script will automatically identify the High and Low prices since the market opened at 10:00pm the night before. This happens automatically and in real time, ensuring that traders have access to this information as soon as the market is open.
These lines will extend until the end of the trading day, and also contain labels that display the price of each line. These labels can be disabled in the indicator's settings.
These levels indicate the total range of the market for that day until the open of the New York Session, and can be treated as levels of Support and Resistance after the market has opened.
█ SETTINGS
Configuration
• Show Labels: Determines whether labels are drawn within the range.
• Display Mode: Determines the number of days the script should load.
Range Settings
• High Color: Determines the color of the high lines and labels.
• Low Color: Determines the color of the low lines and labels.
Pre-COVID High and COVID LowOverview
The "Pre-COVID High and COVID Low" indicator is designed to identify and mark significant price levels on your chart, specifically targeting the pre-COVID-19 high and the low during the initial COVID-19 market impact. This script is particularly useful for traders who are interested in analyzing how stocks or other financial instruments reacted during the onset of the COVID-19 pandemic, providing a historical perspective that may help in making informed trading decisions.
How It Works
Date Ranges : The script uses predefined date ranges to calculate the highest and lowest price levels before and during the early stages of the COVID-19 pandemic. These ranges are:
Pre-COVID High: Between January 1, 2020, and March 31, 2020.
COVID Low: Between March 1, 2020, and March 31, 2020.
Calculation Method :
The highest price during the pre-COVID period is tracked and recorded as the "Pre-COVID High".
The lowest price during the specified COVID period is tracked and recorded as the "COVID Low".
Visibility Conditions : The script includes logic to ensure that these historical levels are only displayed if they fall within a range close to the current visible price range on the chart. This prevents the indicator from compressing the price scale unduly.
How to Use It
Adding to Your Char t: To use this indicator, add it to any chart on TradingView. It works best with daily time frames to clearly visualize the impact over these specific months.
Interpretation :
The "Pre-COVID High" is marked with a red line and is labeled the first day it becomes applicable.
The "COVID Low" is marked with a green line and is similarly labeled on its applicable day.
Trading Strategy Consideration : Traders can use these historical levels as potential support or resistance zones for their trading strategies. These levels can indicate significant price points where the market previously showed strong reactions.

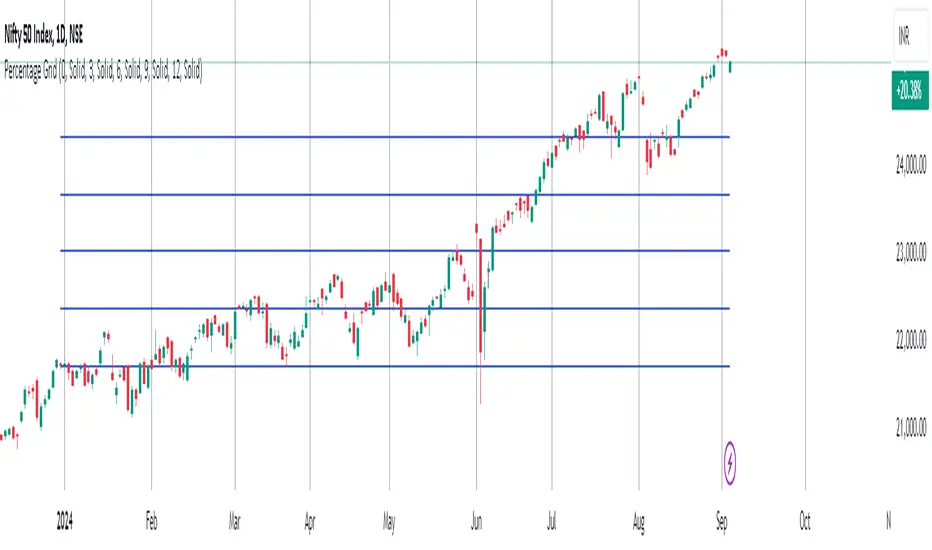
Percentage GridPercentage Grid Indicator
Description:
The Percentage Grid indicator is designed to assist traders in identifying significant support and resistance levels based on yearly percentage changes. This indicator plots horizontal lines on the chart from the start of the year, allowing you to customize how much percentage each line represents. Currently, you can set up to 5 horizontal lines, each representing a different percentage change from the beginning of the year.
For instance, when applied to the SBI Bank stock, you can customize the lines to display various percentage changes from the start of the year, such as 20%, 25%, and up to 35%, as the SBIN stock is currently trading around these levels. This visualization helps traders to easily identify key levels where price action tends to react, providing valuable insights for making trading decisions.
Principles of Trading Technical Analysis:
The Percentage Grid indicator is grounded in the principle of support and resistance levels, which are fundamental concepts in technical analysis. These levels are specific price points on a chart that tend to act as barriers, preventing the price from getting pushed in a certain direction. The indicator helps in:
Identifying Support Levels: Price levels where a downtrend can be expected to pause due to a concentration of buying interest.
Identifying Resistance Levels: Price levels where an uptrend can be expected to pause due to a concentration of selling interest.
By customizing and plotting percentage-based horizontal lines, the indicator highlights these critical levels based on the percentage change from the start of the year.
How to Use:
Add the Indicator to Your Chart:
Search for "Percentage Grid" in the TradingView indicator library and add it to your chart.
Customize Percentage Levels:
Access the indicator settings to customize the percentage change each line represents.
You can set up to 5 different percentage levels. For example, you can set lines at 20%, 25%, 30%, 35%, and 40%.
Interpret the Grid Lines:
The plotted lines will represent the specified percentage changes from the start of the year.
Use these lines to identify potential support and resistance levels where price action is likely to react.
Practical Application:
Look for price bounces or reversals around these levels, which can indicate strong support or resistance.
Combine the Percentage Grid with other technical analysis tools, such as moving averages or trend lines, to confirm potential trading opportunities.
Example:
In the accompanying screenshot, the Percentage Grid is applied to the SBI Bank stock. The lines are set to display 20%, 25%, 30%, 35%, and 40% changes from the start of the year. Notice how the price action respects these levels, providing clear areas where support and resistance are evident.
By incorporating the Percentage Grid into your trading strategy, you can enhance your ability to identify key price levels and make more informed trading decisions.
Happy Trading!
Moving Average Bands with Signals [UAlgo]The "Moving Average Bands with Signals combines various moving average types with ATR-based bands to help traders identify potential support and resistance levels.
It plots moving average bands with upper and lower support/resistance levels based on the Average True Range (ATR) and user-defined settings.Additionally, the script generates buy/sell signals based on price crossing above or below the bands.
🔶 Key Features
Multiple Moving Average Types:
Supports various moving average calculations including Arnaud Legoux Moving Average (ALMA), Exponential Moving Average (EMA), Double Exponential Moving Average (DEMA), Triple Exponential Moving Average (TEMA), Kaufman Adaptive Moving Average (KAMA), Hull Moving Average (HMA), Least Squares Moving Average (LSMA), Simple Moving Average (SMA), Triangular Moving Average (TMA), Volume-Weighted Moving Average (VWMA), Weighted Moving Average (WMA), and Zero-Lag Moving Average (ZLMA).
Customizable ATR Bands:
Integrates the Average True Range (ATR) to calculate dynamic support and resistance bands around the moving average. The multiplier for the bands is user-adjustable, allowing for finer control over the sensitivity and width of the bands.
Signal Generation:
Provides visual signals on the chart when the price interacts with the support or resistance bands. Users can choose between using the wick or the close price to generate these signals, adding an extra layer of customization based on their trading style.
Flexible Input Parameters:
Allows users to input parameters for moving average length, ATR length, band multiplier, and signal type. Additional settings are available for specific moving average types, such as ALMA's offset and sigma, KAMA's fast and slow periods, and LSMA's offset.
🔶 Disclaimer
This script is provided for educational purposes only and should not be considered financial advice.
Trading financial instruments involves substantial risk and can result in significant financial losses.
The script’s performance in the past is not indicative of future results, and no guarantees are made regarding its accuracy, reliability, or performance.

ZigZag ProHello Traders!
TRN ZigZag Pro is an indicator which identifies, and highlights pivot points (swings) and prints useful information about the swings in the chart (e.g. length, duration, ...). The indicator uses an extremely precise swing algorithm to detect the most important pivot points. Compared to other swing or zig-zag indicators TRN ZigZag Pro works in real-time, does not need a look-a-head to find swings and is not repainting. Moreover, equal (double) highs and lows are detected and displayed. The TRN ZigZag Pro helps traders to visualize pure price action and supports the trader to identify key turning points or trends.
The indicator comes with the following features:
Precise real-time swing detection without repainting
Equal/double high and low detection
Displaying of swing labels, values and information
Customizable settings as well as look and feel
It's important to note that the TRN ZigZag Pro is a visual tool and does not provide specific buy or sell signals. It serves as a guide for traders to analyze market structure in depth and make well-informed trading decisions based on their trading strategy and additional technical analysis.
Getting an edge with the TRN ZigZag Pro
The indicator clearly displays up trends, defined as a sequence of higher highs (HH) and higher lows (HL), with green labels and down trends, defined as a sequence of lower lows (LL) and lower highs (LH), with red labels. Equal highs/double tops (DT) and equal lows/ double bottoms (DB) are highlighted in gold.
In addition, the labels show a full stack of valuable information about the swings to maximize your accuracy.
Length
Length percentage in relation to the last swing length
Duration
Label (e.g. HH, LL...)
Use cases for swing detection
Trend Identification
By connecting the swing highs and lows, traders can identify and analyze the prevailing trend in the market. An uptrend is characterized by higher swing highs and lows, while a downtrend is characterized by lower highs and lower lows. The indicator helps traders visually to assess the strength and continuity of the trend.
Support And Resistance Levels
The swing highs and lows can act as support and resistance levels. Swing highs may act as resistance levels where selling pressure increases, while swing lows may act as support levels where buying pressure increases. Traders often pay attention to these levels as potential areas for trade entries, exits, or placing stop-loss orders.
Pattern Recognition
The swings identified by the indicator can help traders recognize chart patterns, such as equal high/lows, consolidations, wedges, triangles or more complex patterns like Gartley or Head and Shoulders. These patterns can provide insights into potential trend continuation or reversal.
Trade Entry and Exit
Traders may use TRN ZigZag Pro to determine potential trade entry and exit points. For example, in an uptrend, traders may look for opportunities to enter long positions near swing lows or on pullbacks to support levels. Conversely, in a downtrend, traders may consider short positions near swing highs or on retracements to resistance levels.
Conclusion
While signals from TRN ZigZag Pro can be informative, it is important to recognize that their reliability may vary. Various external factors can impact market prices, and it is essential to consider your risk tolerance and investment goals when executing trades.
Risk Disclaimer
The content, tools, scripts, articles, and educational resources offered by TRN Trading are intended solely for informational and educational purposes. Remember, past performance does not ensure future outcomes.

F.B_Volume Weighted Average Price MTFThe F.B_Volume Weighted Average Price MTF (VWAP MTF) indicator calculates the volume-weighted average price of a security across different timeframes. The VWAP is a powerful indicator used by both institutional and retail traders to make better trading decisions.
Functionality:
Timeframe:
The indicator allows you to adjust the timeframe for the VWAP calculation via the settings. By default, the timeframe is set to weekly ("W").
Restart at new timeframe:
At each new period in the chosen timeframe, the VWAP calculations are reset, and a new VWAP is calculated.
VWAP Calculation:
The VWAP is calculated by the volume-weighted average of the typical prices (High, Low, and Close) of the security. This calculation takes into account the volume of each transaction to provide an accurate average price.
Visualization:
The VWAP is displayed as a line on the chart, and the color of the line changes depending on the price position relative to the VWAP:
Green: The current closing price is above the VWAP (bullish signal).
Red: The current closing price is below the VWAP (bearish signal).
Options:
Show barcolors:
This option allows you to display the colors of the candles based on their position relative to the VWAP (green for bullish, red for bearish).
Show previous VWAP close:
This option shows the closing value of the VWAP from the previous period to provide historical reference points.
Interpretation:
Bullish Signal:
If the current price is above the VWAP, this indicates that the market trend is upward, which could be considered a buying opportunity.
Bearish Signal:
If the current price is below the VWAP, this indicates that the market trend is downward, which could be considered a selling signal.

ICT KillZones Hunt [TradingFinder] 4 Sessions + OB + FVG + Alert🔵 Introduction
🟣 ICT
The "ICT" style is a subset of "Price Action" technical analysis. The primary goal of the ICT trading strategy is to merge "Price Action" with the "Smart Money" concept to pinpoint optimal trade entry points.
However, this approach's strength extends beyond merely finding entry points. It also helps traders gain a deeper understanding of price behavior and adapt their trading strategies to the market structure.
The most important concepts of "ICT" :
Order Block
Fair Value Gap(FVG)
Liquidity
🟣 Session
Financial markets are divided into several time periods, each featuring distinct characteristics and levels of activity. These periods, known as sessions, are active at different times during the day.
The primary active sessions in financial markets include :
Asian Session
European Session
New York Session
Based on the UTC time zone, the schedule for these key sessions is :
Asian Session: 23:00 to 06:00
European Session: 07:00 to 16:30
New York Session: 13:00 to 22:00
Note
To avoid session overlap and minimize interference during kill zones, the session times have been modified as follows :
Asian Session: 23:00 to 06:00
European Session: 07:00 to 14:25
New York Session: 14:30 to 22:55
🟣 KillZone
Kill zones are periods within a session where trader activity spikes. During these times, trading volume surges, and price movements become more pronounced.
The major kill zones, according to the UTC time zone, are as follows :
Asian Kill Zone: 23:00 to 03:55
European Kill Zone: 07:00 to 09:55
New York Morning Kill Zone: 14:30 to 16:55
New York Evening Kill Zone: 19:30 to 20:55
🔵 How to Use
🟣 Order Block
Order blocks are a distinct category of "Supply and Demand" zones, formed when a series of orders are grouped together. These blocks are often created by banks or other significant market participants.
Banks typically execute large orders in blocks during their trading sessions. If they were to enter the market with small quantities, substantial price movements would occur before the orders were fully executed, reducing potential profit.
To mitigate this, they divide their orders into smaller, more manageable positions. Traders should seek "buy" opportunities in "demand order blocks" and "sell" opportunities in "supply order blocks."
🟣 Fair Value Gap (FVG)
To pinpoint the "Fair Value Gap" on the chart, meticulous candle-by-candle analysis is essential. Pay close attention to candles with significant bodies, examining each candle alongside the one preceding it.
The candles flanking this central candle should exhibit elongated shadows, with bodies that do not intersect the body of the central candle. The span between the shadows of the first and third candles is referred to as the FVG range.
Note :
The origin of all Order Blocks and FVGs starts from inside a kill zone and extends up to the end of the same session.
🟣 Kill Zone Hunt
Following this strategy, after the conclusion of the kill zone and the stabilization of its high and low lines, if the price touches either of these lines within the same session and encounters a robust rejection, it presents an opportunity to enter a trade.
🔵 Setting
🟣 Global Setting
Show All Order Block :
If it is turned off, only the last Order Block will be displayed.
Show All FVG :
If it is turned off, only the last FVG will be displayed.
Show More Info Session :
If it is turned on, more information about kill zones (Trade Volume, Time, Number of Candles) will be displayed.
🟣 Logic Parameter
Pivot Period of Order Blocks Detector :
Enter the desired pivot period to identify the Order Block.
Order Block Validity Period (Bar) :
You can specify the maximum time the Order Block remains valid based on the number of candles from the origin.
Mitigation Level Order Block :
Determining the basic level of a block order. When the price hits the basic level, the order block due to mitigation.
🟣 Order Blocks Display
Demand Order Block :
Show or not show and specify color.
Supply order Block :
Show or not show and specify color.
🟣 Order Block Refinement
Refine Demand OB :
Enable or disable the refinement feature. Mode selection.
Refine Supply OB :
Enable or disable the refinement feature. Mode selection.
🟣 FVG
FVG Validity Period (Bar) :
You can specify the maximum time the FVG remains valid based on the number of candles from the origin.
Mitigation Level FVG :
Determining the basic level of a FVG. When the price hits the basic level, the FVG due to mitigation.
Show Demand FVG :
Show or not show and specify color.
Show Supply FVG :
Show or not show and specify color.
FVG Filter :
Enable or disable filtering of FVGs. Select filter mode.
🟣 Session
Show More Info Session Color
Asia Session, London Sesseion, New York am Session & New York pm Session :
Show or not show session and kill zones. Change the display color.
🟣 Alert
Send Alert When Touched Session high & Low :
On / Off
Alert Demand OB Mitigation :
On / Off
Alert Supply OB Mitigation :
On / Off
Alert Demand FVG Mitigation :
On / Off
Alert Supply FVG Mitigation :
On / Off
Message Frequency :
This string parameter defines the announcement frequency. Choices include: "All" (activates the alert every time the function is called), "Once Per Bar" (activates the alert only on the first call within the bar), and "Once Per Bar Close" (the alert is activated only by a call at the last script execution of the real-time bar upon closing). The default setting is "Once per Bar".
Show Alert Time by Time Zone :
The date, hour, and minute you receive in alert messages can be based on any time zone you choose. For example, if you want New York time, you should enter "UTC-4". This input is set to the time zone "UTC" by default.
Display More Info :
Displays information about the price range of the order blocks (Zone Price) and the date, hour, and minute under "Display More Info". If you do not want this information to appear in the received message along with the alert, you should set it to "Off".

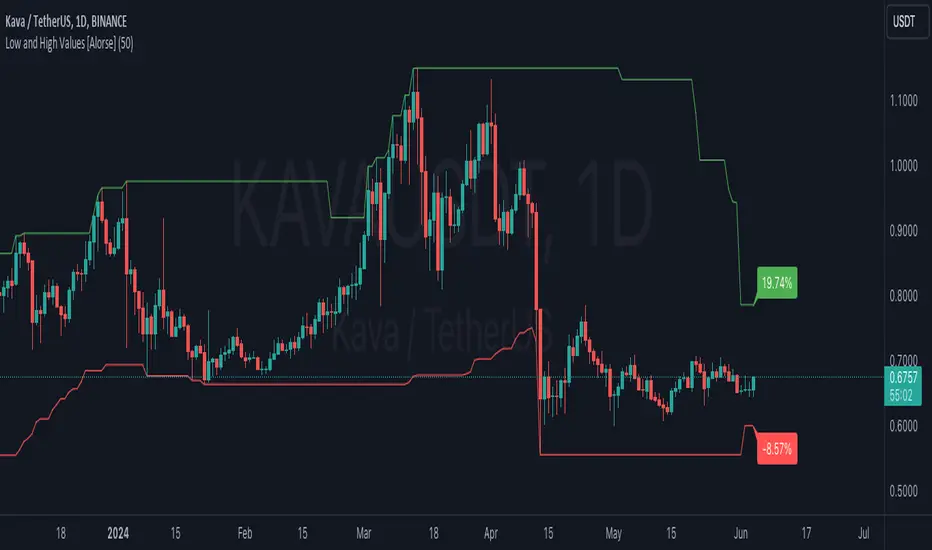
Low and High Values [Alorse]🌟 What does this indicator do?
This magical indicator shows you the lowest (Low) and highest (High) values of the last X candles directly on your chart. Not only that, but it also tells you how much the price has changed from the opening price of the current candle to these key points, all in percentage format. You'll have a clear and precise view of market movement!
🔧 Customize to your liking
Want to adjust the number of candles to consider? No problem! You can easily change this parameter to suit your preference. Whether you like short-term strategies with just a few candles or prefer more extensive analysis with many candles, our indicator adapts to you.
🚀 How can this indicator help you?
Identify Support and Resistance: By showing the lowest and highest points, it helps you identify key support and resistance levels. Perfect for planning your entries and exits!
Trend Analysis: With the percentage labels, you can quickly see how the price has moved relative to recent extremes, helping you confirm trends or anticipate possible reversals.
Trading Strategies: Imagine the price is near a recent low, but the percentage indicates a significant drop from the opening. This could be a buy signal if you expect a rebound. Conversely, if the price is near a recent high with a large percentage increase, you might consider selling.
Calculate Stop Loss: Use this indicator to determine your Stop Loss levels by leaving a bit of margin between the indicator value and your desired SL. This helps protect your positions while allowing for some price fluctuation.
📊 Examples of Use
Intraday Trader: Use the indicator with 10-20 candles to capture quick moves and capitalize on daily fluctuations.
Mid-term Trader: Set the indicator to consider 50 candles for a broader view of trends and reversal points.
Long-term Strategist: Adjust the indicator to 100 candles or more to identify highs and lows over larger time frames.
🛠️ Customizable Parameters
Number of Candles: Define the number of candles the indicator will analyze to calculate the lowest and highest values. It's all up to you!
ka66: FX Sessions High/LowThis indicator is specific to the 24-hour Forex Market. It provides 2 features:
Demarcating forex sessions with open and close lines. Note that looking at various sources online, we use the convention that the Asia session starts with the Tokyo market open, rather than the earlier Sydney session. Presumably this is better since we then have more liquidity in the market. Note that we have three sessions: Asia, London, New York.
At the end of each session, we begin plotting that (closed) session's high and low, which acts as a natural support and resistance for the Forex market. This is the key feature it provides. The first feature is mainly there for a visual guide, which can be turned off via the UI settings, but it certainly helps verifying the logic!
For more background, we are taking the idea of Previous Day High/Low (PDH/PDL), but adjusting it to a multi-session market like Forex. In essence, this is is a "Previous Session High/Low" indicator.
PDH/PDL works fine when you have a market with Regular Trading Hours, ignoring Extended Hours. However, in the Forex market, each session can have differing sentiments, e.g. we often see say London bringing prices up, and New York bringing them back down.
The break of session high/lows (or bouncing off them) can reflect where the potential direction price is going to take.
I also categorised this as a Sentiment indicator, because support and resistance areas where prices react do provide the sentiment of the market. They aren't just lines, they are prices of interest to major players.

Anchored Monte Carlo Shuffled Projection [LuxAlgo]The Anchored Monte Carlo Shuffled Projection tool randomly simulates future price points based on historical bar movements made before a user-anchored point in time.
By anchoring our data and projections to a single point in time, users can better understand and reflect on how the price played out while taking into consideration our random simulations.
🔶 USAGE
After selecting the indicator to apply to the chart, you will be prompted to "Set the Anchor Point". Do so by clicking on the desired location on your chart, only time is used as the anchor point.
Note: To select a new anchor point when applied to the chart, click on the 'More' dropdown next to the indicator status bar (○○○), then select "Reset points...".
Alternate Method: You are also able to click and drag the vertical line that displays on the anchor point bar when the indicator is highlighted.
By randomly simulating bar movements, a range is developed of potential price action which could be utilized to locate future price development as well as potential support/resistance levels.
Performing numerous simulations and taking the average at each step will converge toward the result highlighted by the "Average Line", and can point out where the price might develop, assuming the trend and amount of volatility persist.
Current closing price + Sum of changes in the calculation window
This constraint will cause the simulations always to display an endpoint consistent with the current lookback's slope.
While this may be helpful to some traders, this indicator includes an option to produce a less biased range, as seen below:
🔶 DETAILS
The Anchored Monte Carlo Shuffled Projection tool creates simulations based on prices within a user-set lookback window originating at the specified anchor point. Simulations are done as follows:
Collect each bar's price changes in the user-set window.
Randomize the order of each change in the window.
Project the cumulative sum of the shuffled changes from the current closing price.
Collect data on each point along the way.
This is the process for the Default calculation; for the 'Randomize Direction' calculation, when added onto the front for every other change, the value is inverted, creating the randomized endpoints for each simulation.
The script contains each simulation's data for that bar, with a maximum of 1000 simulations.
To get a glimpse behind the scenes, each simulation (up to 99) can be viewed using the 'Visualize Simulations' Options, as seen below.
Because the script holds the full simulation data, the script can also calculate this data, such as standard deviations.
In this script the Standard deviation lines are the average of all standard deviations across the vertical data groups, this provides a singular value that can be displayed a distance away from the simulation center line.
🔶 SETTINGS
Lookback: Sets the number of Bars to include in calculations.
Simulation Count: Sets the number of randomized simulations to calculate. (Max 1000)
Randomize Direction: See Details Above. Creates a more 'Normalized' Distribution
Visualize Simulations: See Details Above. Turns on Visualizations, and colors are randomly generated. Visualized max does not cap the calculated max. If 1000 simulations are used, the data will be from 1000 simulations, however, only the last 99 simulations will be visualized.
🔹 Standard Deviations
Standard Deviation Multiplier: Sets the multiplier to use for the Standard Deviation distance away from the center line.
🔹 Style
Extend Lines: Extends the Simulated Value Lines into the future for further reference and analysis.

Grid TraderGrid Trader Indicator ( GTx ):
Overview
The Grid Trader Indicator is a tool that helps traders visualize key levels within a specified trading range. The indicator plots accumulation and distribution levels, an entry level, an exit level, and a midpoint. This guide will help you understand how to use the indicator and its features for effective grid trading.
Basics of Trading Range, Grid Buy, and Grid Sell
Trading Range
A trading range is the horizontal price movement between a defined upper ( resistance ) and lower ( support ) level over a period of time. When a security trades within a range, it repeatedly moves between these two levels without trending upwards or downwards significantly. Traders often use the trading range to identify potential buy and sell points:
Upper Level (Resistance): This is the price level at which selling pressure overcomes buying pressure, preventing the price from rising further.
Lower Level (Support): This is the price level at which buying pressure overcomes selling pressure, preventing the price from falling further.
Grid Trading Strategy
Grid trading is a type of trading strategy that involves placing buy and sell orders at predefined intervals around a set price. It aims to profit from the natural market volatility by buying low and selling high in a range-bound market. The strategy divides the trading range into several grid levels where orders are placed.
Grid Buy
Grid buy orders are placed at intervals below the current price . When the price drops to these levels, buy orders are triggered . This strategy ensures that the trader buys more as the price falls, potentially lowering the average purchase price .
Grid Sell
Grid sell orders are placed at intervals above the current price . When the price rises to these levels, sell orders are triggered . This ensures that the trader sells portions of their holdings as the price increases, potentially securing profits at higher levels .
Key Points of Grid Trading
Grid Size : The interval between each buy and sell order. This can be constant (e.g., $2 intervals) or variable based on certain conditions.
Accumulation Range : The lower part of the trading range where buy orders are placed.
Distribution Range : The upper part of the trading range where sell orders are placed.
Midpoint : The average price of the entry and exit levels, often used as a reference point for balance.
As the price moves up and down within this range, your buy orders will be triggered as the price drops and your sell orders will be triggered as the price rises. This allows you to accumulate more of the asset at lower prices and sell portions at higher prices, profiting from the price oscillations within the defined range. Grid trading can be particularly effective in a sideways market where there is no clear long-term trend. However, it requires careful monitoring and adjustment of grid levels based on market conditions to minimize risks and maximize returns .
Configuring the Indicator :
Once the indicator is added, you will see a settings icon next to it. Click on it to open the settings menu.
Adjust the Upper Level , Lower Level , Entry Level , and Exit Level to match your trading strategy and market conditions.
Set the Levels Visibility to control how many bars back the levels will be plotted.
Interpreting the Levels :
Accumulation Levels : These are plotted below the entry level and are potential buy zones. They are labeled as Accumulation Level 1, 2, and 3.
Distribution Levels : These are plotted above the exit level and are potential sell zones. They are labeled as Distribution Level 1, 2, and 3.
Upper Level : Marked in fuchsia, indicating the top boundary of the trading range.
Exit Level : Marked in yellow, indicating the level at which you plan to exit trades.
Midpoint : Marked in white, indicating the average of the entry and exit levels.
Entry Level : Marked in yellow, indicating the level at which you plan to enter trades.
Lower Level : Marked in aqua, indicating the bottom boundary of the trading range.
By visualizing key levels, you can make informed decisions on where to place buy and sell orders, potentially maximizing your trading profits through systematic grid trading.

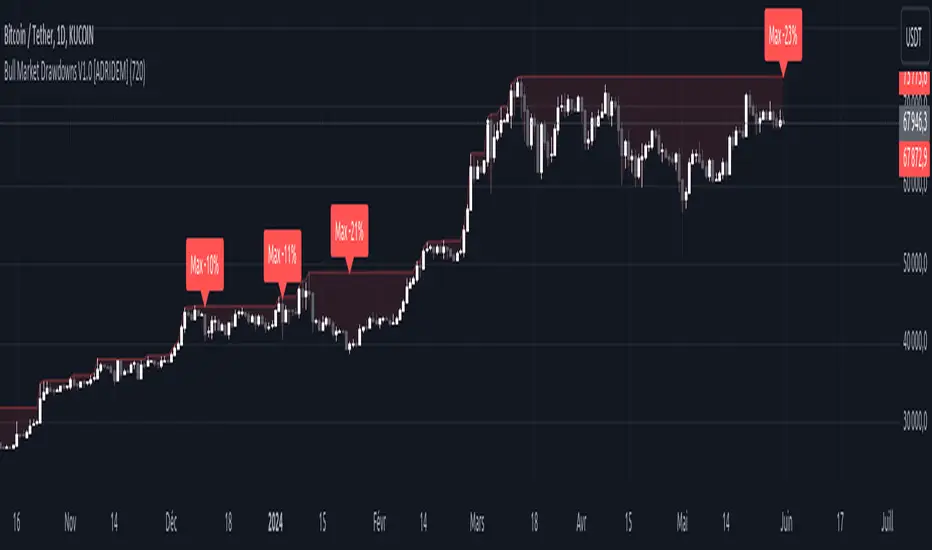
Bull Market Drawdowns V1.0 [ADRIDEM]Bull Market Drawdowns V1.0
Overview
The Bull Market Drawdowns V1.0 script is designed to help visualize and analyze drawdowns during a bull market. This script calculates the highest high price from a specified start date, identifies drawdown periods, and plots the drawdown areas on the chart. It also highlights the maximum drawdowns and marks the start of the bull market, providing a clear visual representation of market performance and potential risk periods.
Unique Features of the New Script
Default Timeframe Configuration: Allows users to set a default timeframe for analysis, providing flexibility in adapting the script to different trading strategies and market conditions.
Customizable Bull Market Start Date: Users can define the start date of the bull market, ensuring the script calculates drawdowns from a specific point in time that aligns with their analysis.
Drawdown Calculation and Visualization: Calculates drawdowns from the highest high since the bull market start date and plots the drawdown areas on the chart with distinct color fills for easy identification.
Maximum Drawdown Tracking and Labeling: Tracks the maximum drawdown for each period and places labels on the chart to indicate significant drawdowns, helping traders identify and assess periods of higher risk.
Bull Market Start Marker: Marks the start of the bull market on the chart with a label, providing a clear reference point for the beginning of the analysis period.
Originality and Usefulness
This script provides a unique and valuable tool by combining drawdown analysis with visual markers and customizable settings. By calculating and plotting drawdowns from a user-defined start date, traders can better understand the performance and risks associated with a bull market. The script’s ability to track and label maximum drawdowns adds further depth to the analysis, making it easier to identify critical periods of market retracement.
Signal Description
The script includes several key visual elements that enhance its usefulness for traders:
Drawdown Area : Plots the upper and lower boundaries of the drawdown area, filling the space between with a semi-transparent color. This helps traders easily identify periods of market retracement.
Maximum Drawdown Labels : Labels are placed on the chart to indicate the maximum drawdown for each period, providing clear markers for significant drawdowns.
Bull Market Start Marker : A label is placed at the start of the bull market, marking the beginning of the analysis period and helping traders contextualize the drawdown data.
These visual elements help quickly assess the extent and impact of drawdowns within a bull market, aiding in risk management and decision-making.
Detailed Description
Input Variables
Default Timeframe (`default_timeframe`) : Defines the timeframe for the analysis. Default is 720 minutes
Bull Market Start Date (`start_date_input`) : The starting date for the bull market analysis. Default is January 1, 2023
Functionality
Highest High Calculation : The script calculates the highest high price on the specified timeframe from the user-defined start date.
```pine
var float highest_high = na
if (time >= start_date)
highest_high := na(highest_high ) ? high : math.max(highest_high , high)
```
Drawdown Calculation : Determines the drawdown starting point and calculates the drawdown percentage from the highest high.
```pine
var float drawdown_start = na
if (time >= start_date)
drawdown_start := na(drawdown_start ) or high >= highest_high ? high : drawdown_start
drawdown = (drawdown_start - low) / drawdown_start * 100
```
Maximum Drawdown Tracking : Tracks the maximum drawdown for each period and places labels above the highest high when a new high is reached.
```pine
var float max_drawdown = na
var int max_drawdown_bar_index = na
if (time >= start_date)
if na(max_drawdown ) or high >= highest_high
if not na(max_drawdown ) and not na(max_drawdown_bar_index) and max_drawdown > 10
label.new(x=max_drawdown_bar_index, y=drawdown_start , text="Max -" + str.tostring(max_drawdown , "#") + "%",
color=color.red, style=label.style_label_down, textcolor=color.white, size=size.normal)
max_drawdown := 0
max_drawdown_bar_index := na
else
if na(max_drawdown ) or drawdown > max_drawdown
max_drawdown := drawdown
max_drawdown_bar_index := bar_index
```
Drawdown Area Plotting : Plots the drawdown area with upper and lower boundaries and fills the area with a semi-transparent color.
```pine
drawdown_area_upper = time >= start_date ? drawdown_start : na
drawdown_area_lower = time >= start_date ? low : na
p1 = plot(drawdown_area_upper, title="Drawdown Area Upper", color=color.rgb(255, 82, 82, 60), linewidth=1)
p2 = plot(drawdown_area_lower, title="Drawdown Area Lower", color=color.rgb(255, 82, 82, 100), linewidth=1)
fill(p1, p2, color=color.new(color.red, 90), title="Drawdown Fill")
```
Current Maximum Drawdown Label : Places a label on the chart to indicate the current maximum drawdown if it exceeds 10%.
```pine
var label current_max_drawdown_label = na
if (not na(max_drawdown) and max_drawdown > 10)
current_max_drawdown_label := label.new(x=bar_index, y=drawdown_start, text="Max -" + str.tostring(max_drawdown, "#") + "%",
color=color.red, style=label.style_label_down, textcolor=color.white, size=size.normal)
if (not na(current_max_drawdown_label))
label.delete(current_max_drawdown_label )
```
Bull Market Start Marker : Places a label at the start of the bull market to mark the beginning of the analysis period.
```pine
var label bull_market_start_label = na
if (time >= start_date and na(bull_market_start_label))
bull_market_start_label := label.new(x=bar_index, y=high, text="Bull Market Start", color=color.blue, style=label.style_label_up, textcolor=color.white, size=size.normal)
```
How to Use
Configuring Inputs : Adjust the default timeframe and start date for the bull market as needed. This allows the script to be tailored to different market conditions and trading strategies.
Interpreting the Indicator : Use the drawdown areas and labels to identify periods of significant market retracement. Pay attention to the maximum drawdown labels to assess the risk during these periods.
Signal Confirmation : Use the bull market start marker to contextualize drawdown data within the overall market trend. The combination of drawdown visualization and maximum drawdown labels helps in making informed trading decisions.
This script provides a detailed view of drawdowns during a bull market, helping traders make more informed decisions by understanding the extent and impact of market retracements. By combining customizable settings with visual markers and drawdown analysis, traders can better align their strategies with the underlying market conditions, thus improving their risk management and decision-making processes.
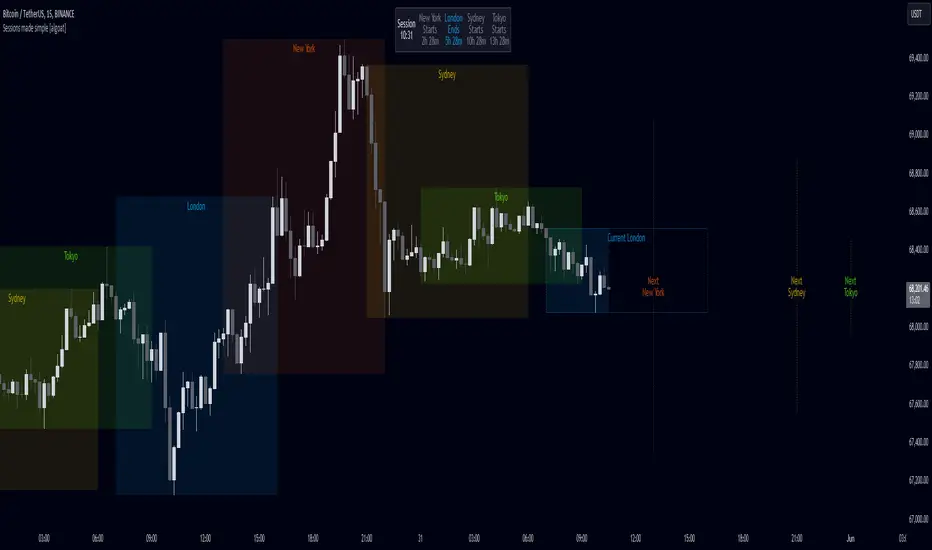
Sessions made simple [algoat]The indicator — by default — provides a clear and concise representation of the four major global trading sessions. Each session is distinctly marked on your trading chart, helping you visualize the specific time periods when these markets are most active. Whether you're a day trader looking to exploit intraday volatility or a long-term investor wanting to understand broader market trends, the Market Sessions feature can be a useful tool in your trading toolkit. The indicator comes with a dashboard, displaying the remaining time until the session end if the session is active and next start if the session is inactive.
Don't forget to align indicator timezone settings according to your region!
⭐ Key Features:
Visual Session Markers
Each of the four trading sessions is fully configurable by visibility, title, time range, and more. The enabled sessions are distinctly marked on the chart with customizable colors, various display options, current sessions' end time and next sessions' start time.
Session Dashboard
The indicator includes a dashboard that displays the remaining time until the session end if the session is active, and the next start time if the session is inactive. This feature provides a quick reference for traders to plan their trading activities.
Timezone Settings
Easily align the indicator's timezone settings with your region by entering your time zone's offset in UTC hours. This ensures that the session times are accurately displayed according to your local time.
Weekend Visibility
Optionally, you can choose to display or hide weekend sessions based on your trading preferences.
Flexible Configuration
The indicator allows for various configurations such as the maximum timeframe for session display, the position of the dashboard, and the text size for better readability.
══════════════════
🧠 General advice
Trading effectively requires a range of techniques, experience, and expertise. From technical analysis to market fundamentals, traders must navigate multiple factors, including market sentiment and economic conditions. However, traders often find themselves overwhelmed by market noise, making it challenging to filter out distractions and make informed decisions. By integrating multiple analytical approaches, traders can tailor their strategies to fit their unique trading styles and objectives.
Confirming signals with other indicators
As with all technical indicators, it is important to confirm potential signals with other analytical tools, such as support and resistance levels, as well as indicators like RSI, MACD, and volume. This helps increase the probability of a successful trade.
Use proper risk management
When using this or any other indicator, it is crucial to have proper risk management in place. Consider implementing stop-loss levels and thoughtful position sizing.
Combining with other technical indicators
Integrate this indicator with other technical indicators to develop a comprehensive trading strategy and provide additional confirmation.
Conduct Thorough Research and Backtesting
Ensure a solid understanding of the indicator and its behavior through thorough research and backtesting before making trading decisions. Consider incorporating fundamental analysis and market sentiment into your trading approach.
══════════════════
⭐ Conclusion
We hold the view that the true path to success is the synergy between the trader and the tool, contrary to the common belief that the tool itself is the sole determinant of profitability. The actual scenario is more nuanced than such an oversimplification. A word to the wise is enough: developed by traders, for traders — pioneering innovations for the modern era.
Risk Notice
Everything provided by algoat — from scripts, tools, and articles to educational materials — is intended solely for educational and informational purposes. Past performance does not assure future returns.
Breakouts with Tests & Retests [LuxAlgo]The Breakouts Tests & Retests indicator highlights tests and retests of levels constructed from detected swing points. A swing area of interest switches colors when a breakout occurs.
Users can control the sensitivity of the swing point detection and the width of the swing areas.
🔶 USAGE
When a Swing point is detected, an area of interest is drawn, colored green for a bullish swing and red when bearish.
A test is confirmed when the opening price is situated in the area of interest, and the closing price is above or below the area, depending on whether it is a bullish or bearish swing. Tests are highlighted with a solid-colored triangle.
A breakout is confirmed when the price closes in the opposite position, below or above the area, in which case the area will switch colors.
If the opening price is located within the area and the closing price closes outside the area, in the same direction as the breakout, this is considered a retest . Retests are highlighted with a hollow-colored triangle.
Note that tests/retests do not act on wicks. The main factor is that the opening price is in the area of interest, while the closing price is outside.
🔹 Area Of Interest Width
The user can adjust the width of the swing areas. Changing the " Width " is a fast and easy way to find different areas of interest.
A higher "Multiple" setting would return a wider area, allowing price to develop within it for a longer period of time and potentially provide later test signals.
When a swing area is broken, a higher "Width" setting can make it more complicated for the price to break it again, allowing a swing area to remain valid for a longer period of time thus potentially providing more retest signals.
🔶 DETAILS
Generally, only one bullish/bearish pattern can be active at a time. This means that no more than 1 bullish or bearish area will be active.
The " Display " settings, however, can help control how areas of different types are displayed.
Bullish AND Bearish: Both, bullish and bearish patterns can be drawn at the same time
Bullish OR Bearish: Only 1 bullish or 1 bearish pattern is drawn at a time
Bullish: Only bullish patterns
Bearish: Only bearish patterns
🔹 Test/Retest Labels
The user can adjust the settings so only the latest test/retest label is shown or set a minimum number of bars until the next test/retest can be drawn.
🔹 Maximum Bars
Users can set a limit of bars for when there is no test/retest in that period; the area of interest won't be updated anymore and will be available and ready for the next Swing.
An option for pulling the area back to the last retest is included.
🔶 SETTINGS
Display: Determines which swing areas are displayed by the indicator. See the "DETAILS" section for more information
Multiple: Adjusts the width of the areas of interest
Maximum Bars: Limit of bars for when there is no test/retest
Display Test/Retest Labels: Show all labels or just the last test/retest label associated with a swing area
Minimum Bars: Minimum bars required for a subsequent test/retest label are allowed to be displayed
Set Back To Last Retest: When after "Maximum Bars" no test/retest is found, place the right side of the area at the last test/retest
🔹 Swings
Left: x amount of wicks on the left of a potential Swing need to be higher/lower for a Swing to be confirmed.
Right: The number of wicks on the right of a potential swing needs to be higher/lower for a Swing to be confirmed.
🔹 Style
Bullish: color for test period (before a breakout) / retest period (after a breakout)
Bearish: color for test period (before a breakout) / retest period (after a breakout)
Label Size
