Support Resistance ImportanceThe Support Resistance Importance indicator is designed to highlight key price levels based on the relationship between fractal occurrences and volume distribution within a given price range. By dividing the range into bins, the indicator calculates the total volume traded at each fractal level and normalizes the values for easy visualization. The normalized values represent an "importance score" for each price range, helping traders identify critical support and resistance levels where price action might react.
Key Features:
Fractal Detection:
The indicator detects Williams Fractals, which are specific price patterns representing potential market reversals. It identifies both upward fractals (potential resistance) and downward fractals (potential support).
Price Range Binning:
The price range is divided into a user-defined number of bins (default is 20). Each bin represents a segment of the total price range, allowing the indicator to bucket price action and track fractal volumes in each bin.
Volume-Based Importance Calculation:
For each bin, the indicator sums up the volume traded at the time a fractal occurred. The volumes are then normalized to reflect their relative importance.
The importance score is calculated as the relative volume in each bin, representing the potential influence of that price range. Higher scores indicate stronger support or resistance levels.
Normalization:
The volume data is normalized to allow for better comparison across bins. This normalization ensures that the highest and lowest volumes are scaled between 0 and 1 for visualization purposes. The smallest volume value is used to scale the rest, ensuring meaningful comparisons.
Visualization:
The indicator provides a table-based visualization showing the price range and the corresponding importance score for each bin.
Each bin is color-coded based on the normalized importance score, with blue or greenish shades indicating higher importance levels. The current price range is highlighted to help traders quickly identify relevant areas of interest.
Trading Utility:
Traders can use the importance scores to identify price levels where significant volume has accumulated at fractals. A higher importance score suggests a stronger likelihood of the price reacting to that level.
If a price moves towards a bin with a high score and the bins above it have much smaller values, it suggests that the price may "pump" up to the next high-scored range, similar to how price drops can occur.
Example Use Case:
Suppose the price approaches a bin with an importance score of 25, and the bins above have much smaller values. This suggests that price may break higher towards the next significant level of resistance, offering traders an opportunity to capitalize on the move by entering long positions or adjusting their stop losses.
This indicator is particularly useful for support and resistance trading, where understanding key levels of price action and volume can improve decision-making in anticipating market reactions.
Supporto e resistenza

Implied Volatility WallsThe Implied Volatility Walls (IVW) indicator is a powerful and advanced trading tool designed to help traders identify key market zones where price may encounter significant resistance or support based on volatility. Using implied volatility, historical volatility, and machine learning models, IVW provides traders with a comprehensive understanding of market dynamics. This indicator is especially useful for those who wish to forecast volatility-driven price movements and adjust their trading strategies accordingly.
How the Implied Volatility Walls (IVW) Works:
The Implied Volatility Walls (IVW) indicator uses a combination of historical price data and advanced machine learning algorithms to calculate key volatility levels and forecast future market conditions. It tracks cumulative volatility, identifies support and resistance zones, and detects liquidation bubbles to highlight critical price areas.
The main concept behind this tool is that price tends to move most of the time by the same amount, making it possible to average the past maximum excursion in order to obtain a validated area where traders can be able to see clearly that the price is moving more than normal.
This indicator primarily focuses on:
1. Volatility Zones: Potential support and resistance levels based on implied and historical volatility.
2. Machine Learning Volatility Forecast: A machine learning model that predicts high, medium, or low volatility for future market conditions.
3. Liquidation Detection: Highlights key areas of potential forced liquidations, where market participants may be forced out of their positions, often leading to significant price movements.
4. Backtesting and Win Rate: The indicator continuously monitors how effective its volatility-based predictions are, offering insights into the performance of its predictions.
Key Features:
1. Volatility Tracking:
- The IVW indicator calculates cumulative volatility by analyzing the range between the high and low prices over time. It also tracks volatility percentiles and separates the market conditions into high, medium, or low volatility zones, enabling traders to gauge how volatile the market is.
2. Volatility Walls (Upper and Lower Zones):
- Upper Volatility Wall (Red Zones): Represent resistance levels where the price might encounter difficulty moving higher due to excess in volatility. This zone is calculated based on the chosen percentile in the settings.
- Lower Volatility Wall (Blue Zones): Represent support levels where price may find buying support.
- These walls help traders visualize potential zones where reversals or breakouts could occur based on volatility conditions.
3. Machine Learning Forecast:
- One of the standout features of the IVW indicator is its machine learning algorithm that estimates future volatility levels. It categorizes volatility into high, medium, and low based on recent data and provides forecasts on what the next market condition is likely to be.
- This forecast helps traders anticipate market conditions and adapt their strategies accordingly. It is displayed on the chart as "Exp. Vol", providing insight into the future expected volatility.
4. VIX Adjustments:
- The indicator can be adjusted using the well-known **VIX (Volatility Index)** to further refine its volatility predictions. This enables traders to incorporate market sentiment into their analysis, improving the accuracy of the predictions for different market conditions.
5. Liquidation Bubbles:
- The Liquidation Bubbles feature highlights areas where large forced selling or buying events may occur, which are usually accompanied by spikes in volatility and volume. These bubbles appear when price deviates significantly from moving averages with substantial volume increases, alerting traders to potential volatile moves.
- Red dots indicate likely forced liquidations on the upside, and blue dots indicate forced liquidations on the downside. These bubbles can help traders spot moments of market stress and potential price swings due to liquidations.
6. Dynamic Volatility Zones:
- IVW dynamically adjusts support and resistance levels as market conditions evolve. This allows traders to always have up-to-date and relevant information based on the latest volatility patterns.
7. Cumulative Volatility Histogram:
- At the bottom of the chart, the purple histogram represents cumulative volatility over time, giving traders a visual cue of whether volatility is building up or subsiding. This can provide early signals of market transitions from low to high volatility, aiding traders in timing their entries and exits more accurately.
8. Backtesting and Win Rate:
- The IVW indicator includes a backtesting function that monitors the success of its volatility predictions over a selected period. It shows a Win Rate (WR) percentage (with 33% meaning that the machine learning algorithm does not bring any edge), representing how often the indicator's predictions were correct. This metric is crucial for assessing the reliability of the model’s forecasts.
9. Opening Range:
- At the beginning of a new session, the indicator will plot two lines indicating the high and the low of the first candle of the new time frame chosen.
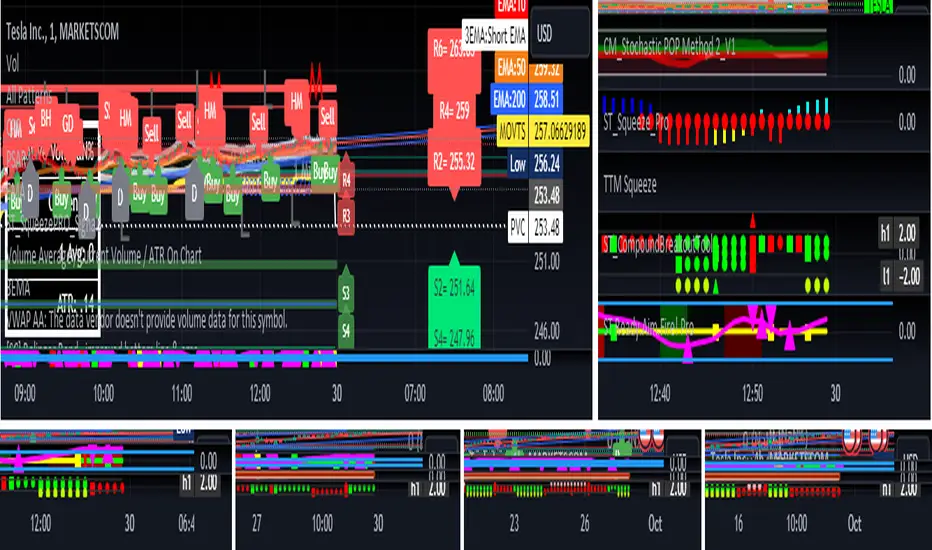
Chart Breakdown:
Below is a description of what users see when using the Implied Volatility Walls (IVW) indicator on the chart:
Volatility Walls:
- Red shaded zones at the top represent upper volatility walls (resistance zones), while blue shaded zones at the bottom represent lower volatility walls (support zones). These areas show where price is likely to react due to high or low volatility conditions.
Liquidation Bubbles:
- Red and blue dots plotted above and below the price represent **liquidation bubbles**, indicating moments of market stress where volatility and volume spikes may force market participants to exit positions.
Cumulative Volatility Histogram:
- The purple histogram at the bottom of the chart reflects the buildup of cumulative volatility over time. Higher bars suggest increased volatility, signaling the potential for large price movements, while smaller bars represent calmer market conditions.
Real-Time Support and Resistance Levels:
- Solid and dashed lines represent current and historical support and resistance levels, helping traders identify price zones that have historically acted as volatility-driven turning points.
Gradient Bar Colors:
- The price bars change color based on their proximity to the volatility walls, with different colors representing how close the price is to these key levels. This color gradient provides a quick visual cue of potential market turning points.
Data Tables Explained:
Table 1: **Volatility Information Table (Top Right Corner):
- EV: Expected Volatility (based on the VIX FIX calculation from Larry Williams).
- +V and -V: Represents the adjusted volatility for upward (+V) and downward (-V) movements.
- Exp. Vol: Shows the expected volatility condition for the next period (High, Medium, or Low) based on the machine learning algorithm.
- WR: The Win Rate based on the backtesting of previous volatility predictions (three outcomes, so base Win rate is 33%, and not 50%).
Table 2: Expected Cumulative Range (Top Right Corner of the separated pane):
- Exp. CR: Expected Cumulative Range based on a machine learning algorithm that calculate the most likely outcome (cumulative range) based on the past days and metrics.
How to Use the Indicator:
1. Identify Key Support and Resistance Levels:
- Use the upper (red) and lower (blue) volatility walls to identify zones where the price is likely to face resistance or support due to volatility dynamics.
2. Forecast Future Volatility:
- Pay attention to the Expected Vol field in the table to understand whether the machine learning model predicts high, medium, or low volatility for the next trading session.
3. Monitor Liquidation Bubbles:
- Watch for red and blue bubbles as they can signal significant market events where volatility and volume spikes may lead to sudden price reversals or continuations.
4. Use the Histogram to Gauge Market Conditions:
- The cumulative volatility histogram shows whether the market is entering a high or low volatility phase, helping you adjust your risk accordingly and making you able to identify the potential of the rest of the chosen session.
5. Backtesting Confidence:
- The Win Rate (WR) provides insight into how reliable the indicator’s predictions have been over the backtested period, giving you additional confidence in its future forecasts, remember that considering the 3 scenarios possible (high volatility, medium and low volatility), the standard win rate is 33%, and not 50%!.
Final Notes:
The Implied Volatility Walls (IVW) indicator is a powerful tool for volatility-based analysis, providing traders with real-time data on potential support and resistance levels, liquidation bubbles, and future market conditions. By leveraging a machine learning model for volatility forecasting, this tool helps traders stay ahead of the market’s volatility patterns and make informed decisions.
Disclaimer: This tool is for educational purposes only and should not be solely relied upon for trading decisions. Always perform your own research and risk management when trading.

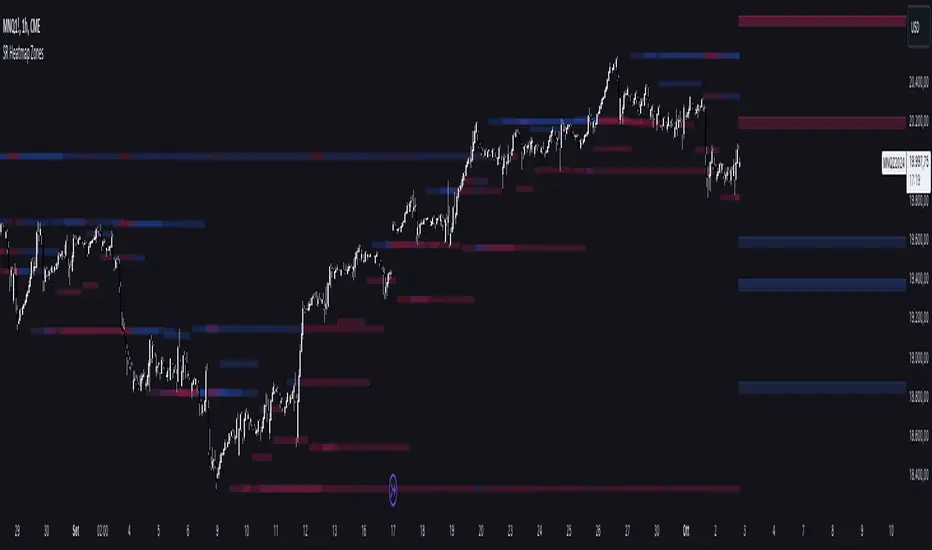
Support and Resistance HeatmapThe "Support and Resistance Heatmap" indicator is designed to identify key support and resistance levels in the price action by using pivots and ATR (Average True Range) to define the sensitivity of zone detection. The zones are plotted as horizontal lines on the chart, representing areas where the price has shown significant interaction. The indicator features a customizable heatmap to visualize the intensity of these zones, making it a powerful tool for technical analysis.
Features:
Dynamic Support and Resistance Zones:
Identifies potential support and resistance areas based on price pivots.
Zones are defined by ATR-based thresholds, making them adaptive to market volatility.
Customization Options:
Heatmap Visualization: Toggle the heatmap on/off to view the strength of each zone.
Sensitivity Control: Modify the zone sensitivity with the ATR Multiplier to increase or decrease zone detection precision.
Confirmations: Set how many touches a level needs before it is confirmed as a zone.
Extended Zone Visualization:
Option to extend the zones for better long-term visibility.
Ability to limit the number of zones displayed to avoid clutter on the chart.
Color-Coded Zones:
Color-coded zones help differentiate between bullish (support) and bearish (resistance) levels, providing visual clarity for traders.
Heatmap Integration:
Gradient-based color changes on levels show the intensity of touches, helping traders understand which zones are more reliable.
Inputs and Settings:
1. Settings Group:
Length:
Determines the number of bars used for the pivot lookback. This directly affects how frequently new zones are formed.
Sensitivity:
Controls the sensitivity of the zone calculation using ATR (Average True Range). A higher value will result in fewer, larger zones, while a lower value increases the number of detected zones.
Confirmations:
Sets the number of price touches needed before a level is confirmed as a support/resistance zone. Lower values will result in more zones.
2. Visual Group:
Extend Zones:
Option to extend the support and resistance lines across the chart for better visibility over time.
Max Zones to Display (maxZonesToShow):
Limits the maximum number of zones shown on the chart to avoid clutter.
3. Heatmap Group:
Show Heatmap:
Toggle the heatmap display on/off. When enabled, the script visualizes the strength of the zones using color intensity.
Core Logic:
Pivot Calculation:
The script identifies support and resistance zones by using the pivotHigh and pivotLow functions. These pivots are calculated using a lookback period, which defines the number of candles to the left and right of the pivot point.
ATR-Based Threshold:
ATR (Average True Range) is used to create dynamic zones based on volatility. The ATR acts as a buffer around the identified pivot points, creating zones that are more flexible and adaptable to market conditions.
Merging Zones:
If two zones are close to each other (within a certain threshold), they are merged into a single zone. This reduces overlapping zones and gives a cleaner visual representation of significant price levels.
Confirmation Mechanism:
Each time the price touches a zone, the confirmation counter for that zone increases. The more confirmations a zone has, the more reliable it is. Zones are only displayed if they meet the required number of confirmations as specified by the user.
Color Gradient:
Zones are color-coded based on the number of confirmations. A gradient is used to visually represent the strength of each zone, with stronger zones being more vividly colored.
Heatmap Visualization:
When the heatmap is enabled, the color intensity of the zones is adjusted based on the proximity of the price to the zone and the number of touches the zone has received. This helps traders quickly identify which zones are more critical.
How to Use:
Identifying Support and Resistance Zones:
After adding the indicator to your chart, you will see horizontal lines representing key support (bullish) and resistance (bearish) levels. These zones are dynamically updated based on price action and pivots.
Adjusting Zone Sensitivity:
Use the "ATR Multiplier" to fine-tune how sensitive the indicator is to price fluctuations. A higher multiplier will reduce the number of zones, focusing on more significant levels.
Using Confirmations:
The more times a price interacts with a zone, the stronger that zone becomes. Use the "Confirmations" input to filter out weaker zones. This ensures that only zones with enough interaction (touches) are plotted.
Activating the Heatmap:
Enabling the heatmap will provide a color-coded visual representation of the strength of the zones. Zones with more price interactions will appear more vividly, helping you focus on the most significant areas.
Best Practices:
Combine with Other Indicators:
This support and resistance indicator works well when combined with other technical analysis tools, such as oscillators (e.g., RSI, MACD) or moving averages, for better trade confirmations.
Adjust Sensitivity Based on Market Conditions:
In volatile markets, you may want to increase the ATR multiplier to focus on more significant support and resistance zones. In calmer markets, decreasing the multiplier can help you spot smaller, but relevant, levels.
Use in Different Time Frames:
This indicator can be used effectively across different time frames, from intraday charts (e.g., 1-minute or 5-minute charts) to longer-term analysis on daily or weekly charts.
Look for Confluences:
Zones that overlap with other indicators, such as Fibonacci retracements or key moving averages, tend to be more reliable. Use the zones in conjunction with other forms of analysis to increase your confidence in trade setups.
Limitations and Considerations:
False Breakouts:
In highly volatile markets, there may be false breakouts where the price briefly moves through a zone without a sustained trend. Consider combining this indicator with momentum-based tools to avoid false signals.
Sensitivity to ATR Settings:
The ATR multiplier is a key component of this indicator. Adjusting it too high or too low may result in too few or too many zones, respectively. It is important to fine-tune this setting based on your specific trading style and market conditions.
Previous Day Close (PVC)Indicator Description: Previous Day Close
This indicator visually represents the previous day's closing price, providing traders with a clear reference point on the chart. By marking this key level, it enhances your ability to analyze stock price movements and make informed trading decisions.
Key Features:
Visual Clarity: The previous day's close is prominently displayed, making it easy to spot significant price levels at a glance.
Enhanced Analysis: Use this indicator to identify potential support and resistance levels based on historical closing prices.
User-Friendly: Designed for simplicity, this indicator integrates seamlessly into your trading workflow.
Leverage the power of the previous day’s close to improve your trading strategy and gain a competitive edge in the market!
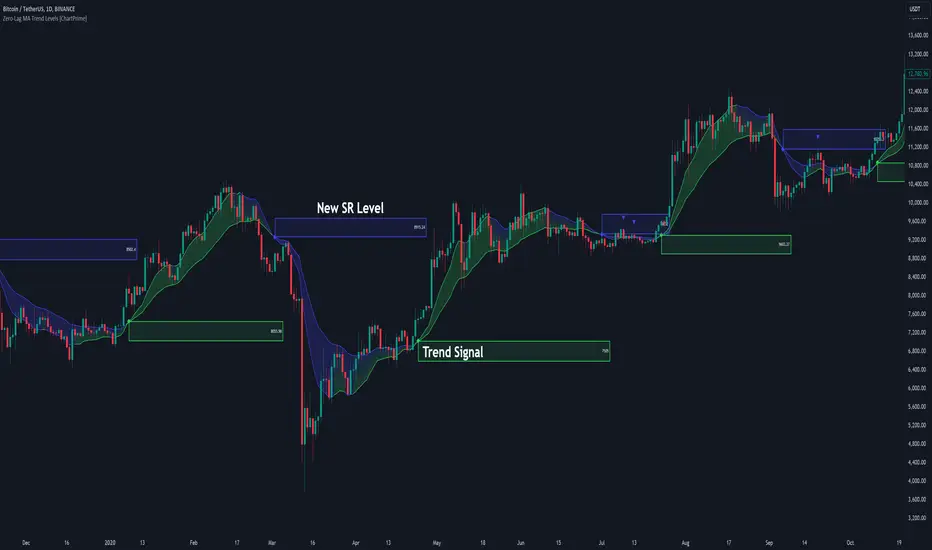
Zero-Lag MA Trend Levels [ChartPrime] The Zero-Lag MA Trend Levels indicator combines a Zero-Lag Moving Average (ZLMA) with a standard Exponential Moving Average (EMA) to provide a dynamic view of the market trend. This indicator uses a color-changing cloud to represent shifts in trend momentum and plots key levels when trend reversals are detected. The addition of trend level boxes helps identify significant price zones where market shifts occur, with retest signals aiding in spotting potential continuation or reversal points.
⯁ KEY FEATURES & HOW TO USE
⯌ Zero-Lag Moving Average (ZLMA) with EMA Cloud :
The indicator employs a Zero-Lag Moving Average (ZLMA) alongside a standard EMA.
series float emaValue = ta.ema(close, length) // EMA of the closing price
series float correction = close + (close - emaValue) // Correction factor for zero-lag calculation
series float zlma = ta.ema(correction, length) // Zero-Lag Moving Average (ZLMA)
The cloud between these averages changes color depending on the trend direction. During a downtrend, if the ZLMA begins to increase, the cloud partially turns green, signaling potential strength. Conversely, during an uptrend, if the ZLMA decreases, the cloud partially turns to the downtrend color (blue by default), indicating potential weakness.
Use : Traders can monitor the cloud's color shifts for early signs of changing momentum. A fully colored cloud aligning with the current trend indicates a strong directional move, while mixed colors suggest a potential trend change.
⯌ Trend Shift and Level Boxes :
Each time a crossover between the EMA and the ZLMA occurs, indicating a trend shift, the indicator plots a box around the price level where the shift occurred. This box remains on the chart to mark the price zone of the trend change.
Use : The boxes provide clear visual markers of where market sentiment shifted. These levels can act as support and resistance zones. Traders can use these boxes to identify potential entry or exit points when the market retests these key levels.
⯌ Retest Detection with Labels :
If the price action crosses a previously plotted trend level box, the indicator marks this event with triangle labels. An upward triangle (▲) appears when the price retests the top of a box during a bullish crossover, and a downward triangle (▼) appears when the price retests the bottom of a box during a bearish crossunder.
Use : These labels help traders identify potential continuation or reversal points at critical price levels, offering additional confirmation for trading decisions.
⯌ Dynamic Color-Coding :
The color of the ZLMA and the EMA is adjusted according to their current trend direction, with the ZLMA adopting green for upward trends and blue for downward trends. This visual representation makes it easier to quickly gauge the market's momentum at a glance.
Use : Traders can use the color-coding to quickly assess the strength and direction of the current trend, allowing for more informed decision-making.
⯁ USER INPUTS
Length : Sets the period for both the ZLMA and EMA calculations.
Trend Levels : Toggle to display the trend level boxes on the chart.
Colors (+ / -) : Define the colors for bullish and bearish trends.
⯁ CONCLUSION
The Zero-Lag MA Trend Levels - ChartPrime indicator offers a nuanced approach to trend detection by combining the ZLMA with a traditional EMA. Its dynamic cloud color changes, trend level boxes, and retest labels make it a versatile tool for traders seeking to identify trend shifts and key price zones effectively. By incorporating elements of support and resistance along with trend momentum, this indicator provides a comprehensive view of market dynamics for both trend-following and counter-trend trading strategies.
Support, Resistance & Liquidity Pool ZonesSupport, Resistance & Liquidity Pool Zones
This indicator automatically detects and plots support and resistance levels based on pivot points and highlights liquidity pool zones, areas where the trading volume exceeds the average over a set number of bars. It is designed to help traders identify key price levels and liquidity traps that can trigger significant market reactions.
Key Features:
Support & Resistance Levels:
The indicator identifies pivot highs and pivot lows as potential resistance and support levels, respectively.
You can customize the number of levels shown on the chart, making it easier to focus on the most recent and relevant price levels.
Liquidity Pool Zones:
The script detects liquidity pool zones, which are areas with above-average trading volume. These zones often act as regions of interest where price accumulation or distribution occurs, potentially leading to significant price moves.
Liquidity zones are shaded to help traders visually identify areas of high interest in the market.
Customizable Settings:
You can adjust the pivot period to fine-tune how the indicator calculates support and resistance.
Control the number of support/resistance levels displayed on the chart and the period used to detect liquidity pools.
Customize the colors for support, resistance, and liquidity zones to match your charting preferences.
Alerts:
The script includes built-in alerts for when the price breaks above resistance or falls below support, helping traders catch key breakout opportunities.
How It Works:
The script calculates support and resistance levels using pivot highs and lows based on the user-defined pivot period.
It monitors liquidity pool zones by comparing the current trading volume with the average volume over a customizable period. When the volume exceeds the set threshold, a liquidity pool zone is highlighted, providing insight into where the market may accumulate or distribute.
Alerts are triggered when the price breaks above the first resistance level or falls below the first support level, giving traders immediate notification of key market events.
How to Use:
Tune the Pivot Period: Adjust the pivot period to your preferred time horizon (default: 10 bars).
Set Liquidity Pool Parameters: Customize the number of bars considered for liquidity pool detection and the volume multiplier to detect high-volume zones.
Monitor Breakouts: Use the built-in alerts to catch potential breakout or breakdown opportunities near support and resistance levels.
This script is ideal for traders looking for an easy-to-use tool to visualize support and resistance levels and liquidity pools, aiding in decision-making and trade management.

Fibonacci Swing Trading BotStrategy Overview for "Fibonacci Swing Trading Bot"
Strategy Name: Fibonacci Swing Trading Bot
Version: Pine Script v5
Purpose: This strategy is designed for swing traders who want to leverage Fibonacci retracement levels and candlestick patterns to enter and exit trades on higher time frames.
Key Components:
1. Multiple Timeframe Analysis:
The strategy uses a customizable timeframe for analysis. You can choose between 4hour, daily, weekly, or monthly time frames to fit your preferred trading horizon. The high and low-price data is retrieved from the selected timeframe to identify swing points.
2. Fibonacci Retracement Levels:
The script calculates two key Fibonacci retracement levels:
0.618: A common level where price often retraces before resuming its trend.
0.786: A deeper retracement level, often used to identify stronger support/resistance areas.
These levels are dynamically plotted on the chart based on the highest high and lowest low over the last 50 bars of the selected timeframe.
3. Candlestick Based Entry Signals:
The strategy uses candlestick patterns as the only indicator for trade entries:
Bullish Candle: A green candle (close > open) that forms between the 0.618 retracement level and the swing high.
Bearish Candle: A red candle (close < open) that forms between the 0.786 retracement level and the swing low.
When these candlestick patterns align with the Fibonacci levels, the script triggers buy or sell signals.
4. Risk Management:
Stop Loss: The stop loss is set at 1% below the entry price for long trades and 1% above the entry price for short trades. This tight risk management ensures controlled losses.
Take Profit: The strategy uses a 2:1 risk-to-reward ratio. The take profit is automatically calculated based on this ratio relative to the stop loss.
5. Buy/Sell Logic:
Buy Signal: Triggered when a bullish candle forms above the 0.618 retracement level and below the swing high. The bot then places a long position.
Sell Signal: Triggered when a bearish candle forms below the 0.786 retracement level and above the swing low. The bot then places a short position.
The stop loss and take profit levels are automatically managed once the trade is placed.
Strengths of This Strategy:
Swing Trading Focus: The strategy is ideal for swing traders, targeting longer-term price moves that can take days or weeks to play out.
Simple Yet Effective Indicators: By only relying on Fibonacci retracement levels and basic candlestick patterns, the strategy avoids complexity while capitalizing on well-known support and resistance zones.
Automated Risk Management: The built-in stop loss and take profit mechanism ensures trades are protected, adhering to a strict 2:1 risk/reward ratio.
Multiple Timeframe Analysis: The script adapts to various market conditions by allowing users to switch between different timeframes (4hour, daily, weekly, monthly), giving traders flexibility.
Strategy Use Cases:
Retracement Traders: Traders who focus on entering the market at key retracement levels (0.618 and 0.786) will find this strategy especially useful.
Trend Reversal Traders: The strategy’s reliance on candlestick formations at Fibonacci levels helps traders spot potential reversals in price trends.
Risk Conscious Traders: With its 1% risk per trade and 2:1 risk/reward ratio, the strategy is ideal for traders who prioritize risk management in their trades.

Day & Swing Trading EMA Clouds with Adaptive LevelsDay & Swing Trading EMA Clouds with Adaptive Levels is a tool designed for traders who need a flexible indicator that adapts to both short-term (day trading) and long-term (swing trading) strategies. The indicator blends EMA clouds and adaptive support/resistance levels, making it suitable for analyzing trend strength and key price zones.
How It Works:
EMA Clouds for Trend Detection:
This indicator uses three EMAs (Fast, Intermediate, Slow) to create two clouds:
Fast Cloud: The area between the fast and Intermediate EMAs.
Slow Cloud: The area between the Intermediate and slow EMAs.
The cloud colors change based on trend direction:
Positive (uptrend): When the fast EMA is above the Intermediate EMA (turquoise) or the Intermediate EMA is above the slow EMA (teal).
Negative (downtrend): When the fast EMA is below the Intermediate EMA (pink) or the Intermediate EMA is below the slow EMA (magenta).
Traders can use these clouds to visually gauge market momentum and trend reversals.
Adaptive EMA Settings Based on Trading Mode:
The EMA lengths adjust automatically depending on whether you're in Day Trading or Swing Trading mode:
Day Trading Mode uses shorter periods to capture quick price movements:
Fast EMA: 5-period
Mid EMA: 13-period
Slow EMA: 21-period
Swing Trading Mode uses longer periods to capture broader trends:
Fast EMA: 12-period
Mid EMA: 26-period
Slow EMA: 50-period
This dynamic adjustment allows you to switch between trading styles seamlessly, with the EMAs reflecting the most relevant timeframes for each strategy.
Adaptive Support and Resistance Levels:
Depending on the selected trading mode, the indicator dynamically plots key levels:
Day Trading Mode: Previous day’s high, low, and midpoint, as well as 2-day levels.
Swing Trading Mode: Previous month’s high, low, and midpoint, as well as 2-month levels.
These levels act as dynamic support and resistance zones, giving traders critical areas to monitor for potential reversals or breakouts.
Buy & Sell Signals:
Visual buy/sell signals are generated when the fast EMA crosses above or below the slow EMA. These signals can help traders identify potential trend reversals.
Customization:
You can fully adjust the transparency and colors of the clouds to fit your personal preferences and trading style.
Why This Combination?
Combining EMA clouds with adaptive levels provides traders with a complete picture. The clouds highlight the underlying market momentum and trend strength, while the adaptive levels offer potential entry/exit points based on historical price action. This unique mashup allows traders to follow trends and plan trades around key support and resistance zones.

Periodic Linear Regressions [LuxAlgo]The Periodic Linear Regressions (PLR) indicator calculates linear regressions periodically (similar to the VWAP indicator) based on a user-set period (anchor).
This allows for estimating underlying trends in the price, as well as providing potential supports/resistances.
🔶 USAGE
The Periodic Linear Regressions indicator calculates a linear regression over a user-selected interval determined from the selected "Anchor Period".
The PLR can be visualized as a regular linear regression (Static), with a fit readjusting for new data points until the end of the selected period, or as a moving average (Rolling), with new values obtained from the last point of a linear regression fitted over the calculation interval. While the static method line is prone to repainting, it has value since it can further emphasize the linearity of an underlying trend, as well as suggest future trend directions by extrapolating the fit.
Extremities are included in the indicator, these are obtained from the root mean squared error (RMSE) between the price and calculated linear regression. The Multiple setting allows the users to control how far each extremity is from the other.
Periodic Linear Regressions can be helpful in finding support/resistance areas or even opportunities when ranging in a channel.
The anchor - where a new period starts - can be shown (in this case in the top right corner).
The shown bands can be visualized by enabling Show Extremities in settings ( Rolling or Static method).
The script includes a background gradient color option for the bands, which only applies when using the Rolling method.
The indicator colors can be suggestive of the detected trend and are determined as follows:
Method Rolling: a gradient color between red and green indicates the trend; more green if the output is rising, suggesting an uptrend, and more red if it is decreasing, suggesting a downtrend.
Method Static: green if the slope of the line is positive, suggesting an uptrend, red if negative, suggesting a downtrend.
🔶 DETAILS
🔹 Anchor Type
When the Anchor Type is set to Periodic , the indicator will be reset when the "Anchor Period" changes, after which calculations will start again.
An anchored rolling line set at First Bar won't reset at a new session; it will continue calculating the linear regression from the first bar to the last; in other words, every bar is included in the calculation. This can be useful to detect potential long-term tops/bottoms.
Note that a linear regression needs at least two values for its calculation, which explains why you won't see a static line at the first bar of the session. The rolling linear regression will only show from the 3rd bar of the session since it also needs a previous value.
🔹 Rolling/Static
When Anchor Type is set at Periodic , a linear regression is calculated between the first bar of the chosen session and the current bar, aiming to find the line that best fits the dataset.
The example above shows the lines drawn during the session. The offered script, though, shows the last calculated point connected to the previous point when the Rolling method is chosen, while the Static method shows the latest line.
Note that linear regression needs at least two values, which explains why you won't see a static line at the first bar of the session. The rolling line will only show from the 3rd bar of the session since it also needs a previous value.
🔶 SETTINGS
Method: Indicator method used, with options: "Static" (straight line) / "Rolling" (rolling linear regression).
Anchor Type: "Periodic / First Bar" (the latter works only when "Method" is set to "Rolling").
Anchor Period: Only applicable when "Anchor Type" is set at "Periodic".
Source: open, high, low, close, ...
Multiple: Alters the width of the bands when "Show Extremities" is enabled.
Show Extremities: Display one upper and one lower extremity.
🔹 Color Settings
Mono Color: color when "Bicolor" is disabled
Bicolor: Toggle on/off + Colors
Gradient: Background color when "Show extremities" is enabled + level of gradient
🔹 Dashboard
Show Dashboard
Location of dashboard
Text size

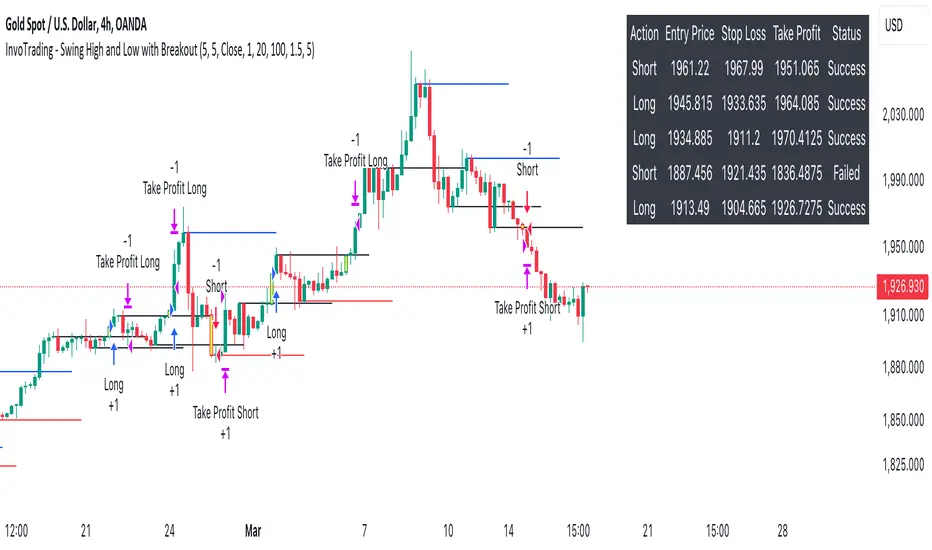
InvoTrading - Swing High and Low with BreakoutInvoTrading - Swing High and Low with Breakout Strategy
This strategy is designed to identify trading opportunities based on swing highs and lows, combined with breakout confirmations. It utilizes pivot points to detect potential reversal levels and initiates trades when the price breaks out of these levels under specific conditions.
Key Features:
- Pivot Points: The strategy calculates pivot highs and lows using customizable left and right bars. These pivots represent potential swing points in the market.
- Breakout Detection: It monitors for breakouts above pivot highs (Bullish Break of Structure - BOS) and below pivot lows (Bearish Break of Structure).
- Strong Swings (Optional): You can enable "Strong Swing" detection, which considers only those pivots where the price attempted but failed to break the pivot level, indicating stronger support or resistance.
- Trade Management: The strategy sets entry points, stop losses, and take profits based on a customizable risk-reward ratio.
- Trade Table: An optional table displays recent trades, including their status (Pending, Success, or Failed).
- Visual Aids: Customizable colors and line settings help visualize pivot points, strong swings, and breakout candles on the chart.
---
Settings:
1. Pivot Settings:
- Left Bars: Number of bars to the left of the pivot point (default: 5).
- Right Bars: Number of bars to the right of the pivot point (default: 5).
- Pivot Based On: Choose between "High/Low" or "Close" prices for pivot calculations.
2. Color Settings:
- Pivot High Color: Color for Pivot High markers (default: Blue).
- Pivot Low Color: Color for Pivot Low markers (default: Red).
- Strong Swing High Color: Color for Strong Swing High markers (default: Black).
- Strong Swing Low Color: Color for Strong Swing Low markers (default: Black).
- Breakout Candle Color (BOS): Color for the breakout candle (default: Yellow).
3. Line Settings:
- Line Width: Width of the pivot lines (default: 1).
- Line Length (Bars): Length of the pivot lines in bars (default: 20).
- Maximum Number of Lines to Keep: Limits the number of pivot lines displayed to avoid clutter (default: 100).
4. Trade Settings:
- Enable Buy and Sell Signals: Activates trade entries and exits on the chart (default: False).
- Show Trades Table: Displays a table summarizing recent trades (default: False).
- Risk-Reward Ratio: Sets the desired risk-reward ratio for trades (default: 1.5).
- Number of Trades to Display: Maximum number of recent trades shown in the table (default: 5).
- Enable Strong Trade: Only triggers trades when a "Strong Swing" is detected (default: False).
---
How It Works:
- Pivot Detection: The script identifies pivot highs and lows based on the specified number of left and right bars.
- Strong Swings: If enabled, the strategy marks a pivot as a strong swing if the price attempts to break it but closes back within the pivot level.
- Breakout Confirmation:
- Long Entry: Occurs when the price closes above a pivot high, signaling a bullish breakout. If "Strong Trade" is enabled, it must be a strong swing high.
- Short Entry: Occurs when the price closes below a pivot low, signaling a bearish breakout. If "Strong Trade" is enabled, it must be a strong swing low.
- Trade Execution: Upon a valid breakout, the strategy places a trade with a stop loss set at the previous candle's low (for longs) or high (for shorts). The take profit is calculated based on the specified risk-reward ratio.
- Trade Monitoring: The strategy updates the status of each trade (Pending, Success, Failed) based on whether the take profit or stop loss is hit.
- Visualization: Breakout candles are highlighted, and pivot lines are drawn with customizable colors and widths. Strong swings are marked distinctly.
---
Usage Tips:
- Backtesting: Before using this strategy live, backtest it on different time frames and instruments to assess its performance.
- Customization: Adjust the pivot settings and risk-reward ratio to match your trading style and the volatility of the instrument you're trading.
- Risk Management: Always use proper risk management techniques, even though the strategy calculates stop losses and take profits.
Key Zone LocatorThe "Key Locator" indicator identifies important price levels on a chart by analyzing historical data. It does this by:
Counting Touches: It calculates how many times the price touches each level within a specified period. This helps identify levels that the market frequently interacts with, which can indicate significant support or resistance.
Measuring Volume: It also sums up the trading volume at each level during the same period. High volume at a particular level can suggest strong interest or activity, making that level more significant.s based on historical market activity.
By combining these two metrics—touches and volume—the indicator highlights the most important price level on the chart, helping traders make informed decisions based on where the market has shown significant activity in the past.
Level Calculation:
The indicator first identifies the highest and lowest prices over a specified period, which is determined by the length parameter. It then divides this price range into 200 equal segments, creating potential key levels across the chart. Each segment represents a level where the price might show significant activity.
Metric Calculation:
For each of these levels, the indicator calculates two key metrics. First, it counts how many times the price touches or crosses each level during the specified period. Second, it sums up the trading volume associated with these touches at each level. This dual analysis helps in identifying levels that are not only frequently interacted with but also have substantial trading activity.
Normalization:
To facilitate comparison between different levels, the indicator normalizes both the touch count and the volume for each level to a scale from 0 to 10. This involves dividing each metric by its maximum observed value in the period and scaling it accordingly, ensuring that both metrics are on a comparable scale.
Scoring and Balancing:
Each level is assigned a score based on a weighted average of its normalized touch and volume scores. The weight_balance parameter allows users to adjust the emphasis between touches and volume. A higher weight on touches will prioritize levels frequently interacted with, while more emphasis on volume will highlight levels with significant trading activity.
Identify Key Level:
Finally, the indicator identifies the level with the highest combined score as the most significant. This key level is plotted on the chart in red, providing traders with a visual indication of potential areas of support or resistance based on historical data.
This comprehensive approach allows traders to pinpoint where crucial market activity has occurred, aiding them in making strategic decisions based on historical price behavior and trading volumes.
Please note that while the "Key Locator" indicator provides valuable insights based on historical data, it does not guarantee future performance or outcomes. Trading involves risks, and it's important to use this tool in conjunction with other analysis methods and risk management strategies. Always consider your financial situation and consult with a financial advisor if necessary before making trading decisions.

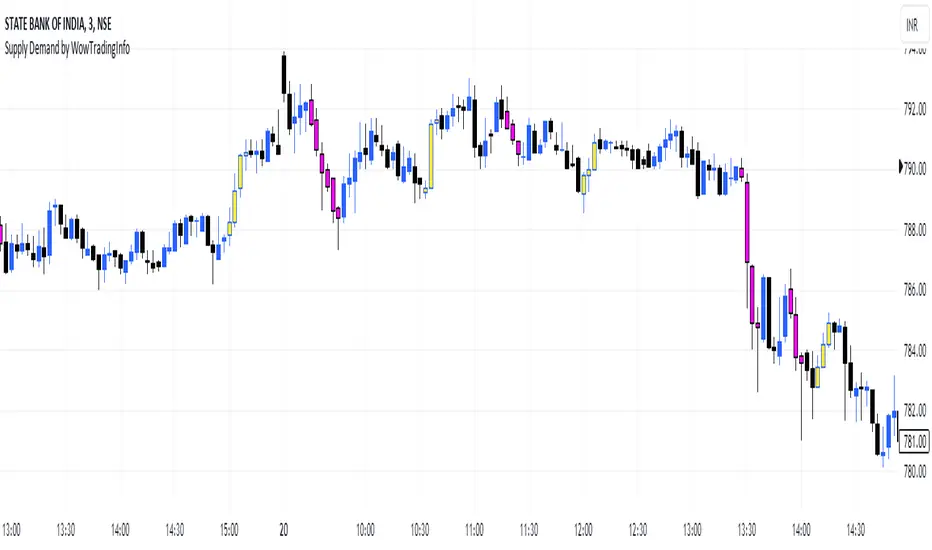
Supply Demand by WowTradingInfoThis indicator identifies supply and demand zones based on price action, which is a crucial concept for technical analysis. Supply zones represent areas where the price has historically shown selling pressure, while demand zones show areas with strong buying interest.
Explanation:
Rally-Base-Rally (RBR):
A rally is defined as a price movement where the percentage increase between the current high and the previous low.
A base is defined as a period of consolidation where price stays within a narrow range, with low volatility.
A RBR pattern is detected when a rally occurs, followed by a base, and then another rally.
Drop-Base-Drop (DBD):
A drop is identified when the price decrease between the current low and the previous high.
A DBD pattern is detected when a drop occurs, followed by a base, and then another drop.
Zone Marking:
RBR Zones are drawn with repaint the candles color as yellow (where buyers are likely to step in).
DBD Zones are drawn with repaint the candles color as pink (where sellers are likely to step in).
Example Use Case:
Rally-Base-Rally: When you see a yellow zone, it suggests that price rallied, consolidated, and is likely to rally again. It can be used as a potential demand zone.
Drop-Base-Drop: pink zones indicate that price dropped, consolidated, and may drop again. It can be used as a potential supply zone.
This script will help you automatically detect and visualize RBR and DBD patterns on your TradingView chart. These zones can provide valuable insights into areas where price may react due to past buying or selling pressure.
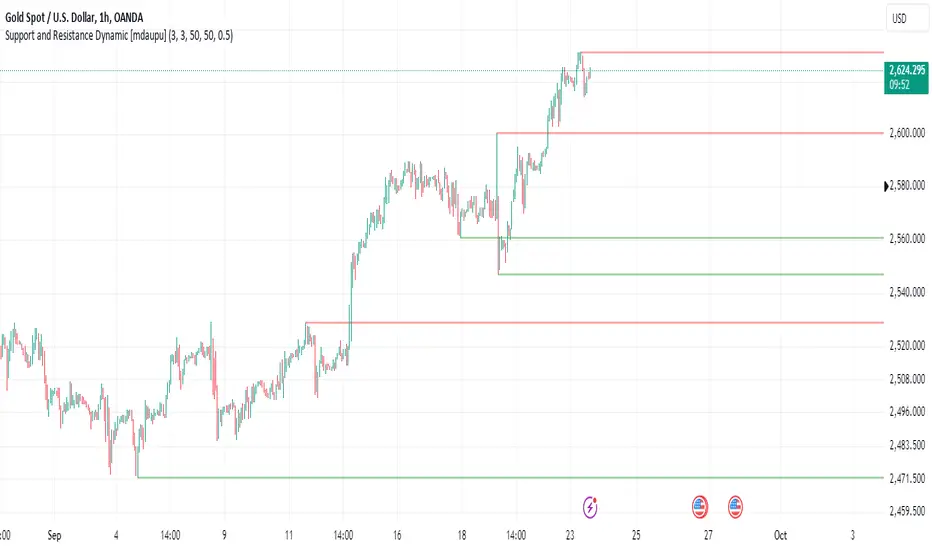
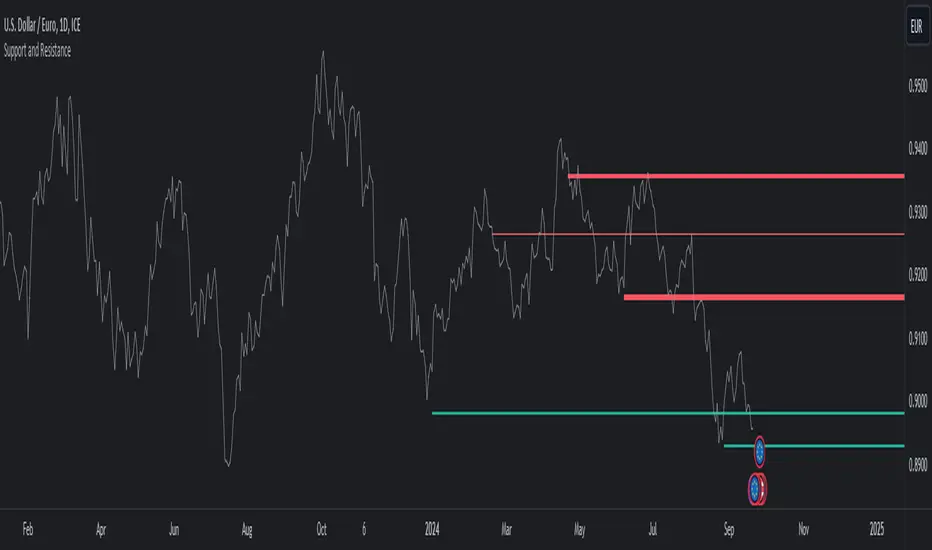
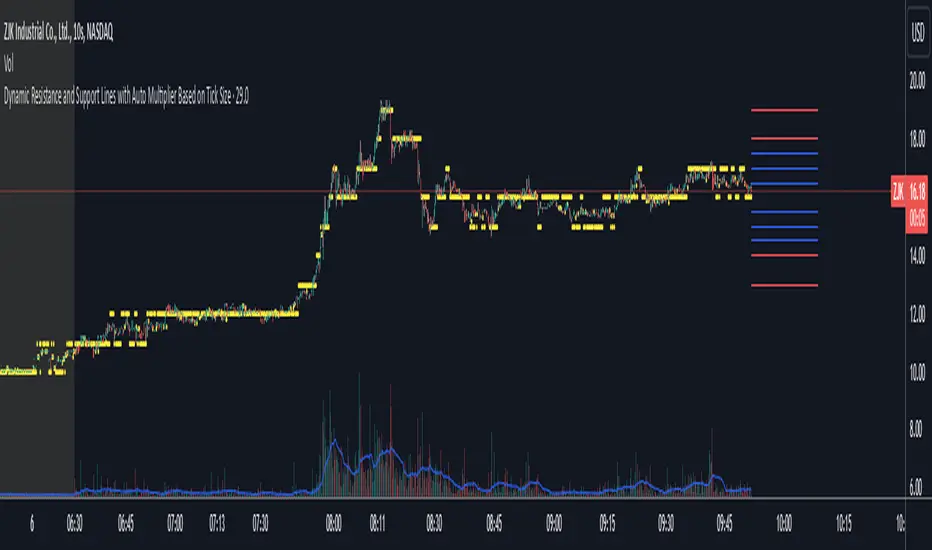
Support and Resistance DynamicThis indicator is designed to plot horizontal lines on significant Support and Resistance based on custom user-defined lookback periods. It helps traders identify key levels of support and resistance, improving their ability to detect potential trend reversals or breakout zones.
Key Features:
1. Custom Number of Support and Resistance Lines:
- The script allows users to independently control the number of horizontal lines for Support and Resistance, helping to focus on the most important levels.
2. Adjustable Lookback Period
- Customize the lookback periods for detecting support and resistance, giving you the flexibility to capture different swing points in various market conditions.
3. Minimum Difference Filter:
- The script includes a customizable minimum difference percentage filter to ensure only significant pivots are plotted, avoiding clutter and focusing on more meaningful levels.
4. Automatic Line Extension:
- Pivot high and low lines automatically extend to the right, clearly marking key levels until they are broken or surpassed by price action.
This tool is ideal for technical traders who rely on support and resistance zones for making trading decisions. Whether you are swing trading, day trading, or scalping, these key levels can help enhance your chart analysis.
How to Use:
- Customize the number of support and resistance lines to suit your strategy.
- Adjust the lookback settings to match your timeframe or market conditions.
- Fine-tune the minimum difference percentage to filter out noise and focus on stronger support and resistance.
This script provides a dynamic and customizable way to visualize support and resistance, helping you spot key turning points and make informed trading decisions.
Benito CL Levels by Melon
Code Summary:
The script plots horizontal lines at .00, .25, .50, and .75 increments around the current price on the chart. It calculates these levels by taking the integer base of the price and adding the specified increments. The user can customize the color, thickness, and style (solid, dashed, dotted) for each level individually. The script plots a specified number of lines above and below the current price, extending them across the chart to provide clear reference points for potential support and resistance levels.
Key Trading Insight:
Focus on the .00, .25, .50, and .75 levels. A failure to reclaim the .50 level often indicates a lack of momentum, leading to a potential breakdown towards the .00 or .25 levels. These levels serve as psychological or technical support and resistance points where price reactions are likely. Monitoring price action around these levels can provide useful signals for potential trend continuation or reversal.

Thrax - Intraday Market Pressure ZonesTHRAX - INTRADAY MARKET PRESSURE ZONES
This indicator identifies potential support and resistance zones based on areas of significant market pressure. It dynamically plots these zones and adjusts their visibility based on real-time price action and user-defined thresholds. The indicator is useful for traders seeking to understand intraday market pressure, visualize zones of potential price reversals, and analyze volume imbalances at critical levels.
1. Support/Resistance Zones: Wherever the price retraces significantly from its high a support zone is drawn and when it retraces significantly from it low a resistance zone is drawn. The significant retracing is measured by the wick threshold percentage. For instance, if set to 75%, it implies price retracement of 75% either from high or from low for a particular candel
Volume delat: Displays volume delta information where the zones are formed. This can be used by trader to consider only those zones where delta is significant.
2. Breakout Detection: Monitors for price breakouts beyond established zones, deleting zones that are invalidated by price movement. when the price breaks a given zone with the threshold, it is considered to be mitigated and chances of trend continuation is decent.
Candle Coloring: Uses color codes (green, red, and yellow) to represent bullish, bearish, and indecisive (doji) candles, aiding quick visual assessment.
INPUTS
1. Wick Threshold (%) : Sets the minimum wick percentage required for a candle to be considered a support or resistance candidate.
2. Breakout Threshold (%) : Determines the percentage above or below a support or resistance zone that defines a breakout condition. if breaks a zone with the set threshold then the zone will be considered mititgated.
3. Max Number of Support/Resistance Zones : Limits the maximum number of support/resistance zones displayed on the chart, ranging from 1 to 5.
4. Show Wick Percentage Labels : Toggles the display of percentage values for upper and lower wicks on each candle.
TRADE SETUP
Identifying Entry Points: Look for the formation of support or resistance zones. Wait for price to retrace to these zones. if you are willing to take risk, you can consider even zones with low delta. If you want to be more cautious you should consider zones with high delta.
Volume Confirmation: Use the volume information to confirm the strength of the zone. Strong volume differences (displayed as labels) can indicate significant market pressure at these levels.
Breakout Trades: If price breaks through a support/resistance zone by more than the breakout threshold, consider this a signal for a potential trend continuation in the breakout direction.
Risk Management: Set stop-loss levels slightly outside of the identified zones to minimize risk in case of false breakouts. This can be set in input setting for breakout threshold.
Bonus Tip : Mark your significant highs and lows from where prices have retraced multiple times in the near past and if the zone is near these levels it can serve s a strong candidate of support or resistance
Therefore, in conclusion monitor the zones, based on delta and volume presence filter out the zone, wait for price retracement to the zone, intiate the trade with stop loss below zone with a set percentage.
Support and ResistanceThis indicator, titled "Support and Resistance," is designed to identify and display key price levels based on volume and pivot points. It's a versatile tool that can be adapted for different market views and timeframes.
Key Features
Market View Options
The indicator offers three market view settings:
Short term
Standard
Long term
These settings affect the lookback periods used in calculations, allowing users to adjust the indicator's sensitivity to market movements.
Volume-Based Levels
The indicator calculates support and resistance levels using a rolling Point of Control (POC) derived from volume data. This approach helps identify price levels where the most trading activity has occurred.
Pivot Points
In addition to volume-based levels, the indicator incorporates pivot points to identify potential support and resistance areas.
Customizable Appearance
Users can adjust:
Number of lines to display (1-8)
Colors for support and resistance levels
Line thickness based on level importance
Calculation Methods
Rolling POC
The indicator uses a custom function f_rolling_poc to calculate the rolling Point of Control. This function analyzes volume distribution across price levels within a specified lookback period.
Pivot Points
Both standard and quick pivot points are calculated using the rolling POC as input, rather than traditional price data.
Level Importance
The indicator assigns importance to each level based on:
Number of touches (how often price has interacted with the level)
Duration (how long the level has been relevant)
This importance score determines the thickness of the displayed lines.
Unique Aspects
Dynamic Line Thickness: Lines become thicker when levels overlap, highlighting potentially stronger support/resistance areas.
Adaptive Coloring: The color of each line changes dynamically based on whether the current price is above or below the level, indicating whether it's acting as support or resistance.
Flexible Time Frames: The market view options allow the indicator to be easily adapted for different trading styles and timeframes.
Potential Uses
This indicator could be valuable for:
Identifying key price levels for entry and exit points
Recognizing potential breakout or breakdown levels
Understanding the strength of support and resistance based on line thickness
Adapting analysis to different market conditions and timeframes
Overall, this "Support and Resistance" indicator offers a sophisticated approach to identifying key price levels, combining volume analysis with pivot points and providing visual cues for level importance and current market position.
This Support and Resistance indicator is provided for informational and educational purposes only. It should not be considered as financial advice or a recommendation to buy or sell any security. The indicator's calculations are based on historical data and may not accurately predict future market movements. Trading decisions should be made after thorough research and consultation with a licensed financial advisor. The creator of this indicator is not responsible for any losses incurred from its use. Past performance does not guarantee future results. Use at your own risk.
Price Action Volumetric Breaker Blocks [UAlgo]The Price Action Volumetric Breaker Blocks indicator is designed to identify and visualize significant price levels in the market. It combines concepts of price action, volume analysis, and market structure to provide traders with a comprehensive view of potential support and resistance areas. This indicator identifies "breaker blocks," which are price zones where the market has shown significant interest in the past.
These blocks are created based on swing highs and lows, and are further analyzed using volume data to determine their strength. The indicator also tracks market structure shifts, providing additional context to price movements.
By visualizing these key levels and market structure changes, traders can gain insights into potential areas of price reversal or continuation, helping them make more informed trading decisions.
🔶 Key Features
Dynamic Breaker Block Identification: The indicator automatically detects and draws breaker blocks based on swing highs and lows. These blocks represent areas of potential support and resistance.
Volume-Weighted Strength Analysis: Each breaker block is analyzed using volume data to determine its bullish and bearish strength. This is visually represented by the proportion of green (bullish) and red (bearish) coloring within each block.
Market Structure Break (MSB) and Break of Structure (BOS): The indicator identifies and labels Market Structure Breaks (MSB) and Break of Structure (BOS) events, providing context to larger market trends.
Customizable Settings:
- Adjustable swing length for identifying pivot points
- Option to show a specific number of recent breaker blocks
- Choice between wick or close price for violation checks
- Toggle to hide overlapping blocks for cleaner analysis
Violation Detection: Automatically detects when a breaker block has been violated (broken through), either by wick or close price, depending on user settings.
Overlap Control: Provides an option to hide overlapping order blocks, ensuring that the chart remains clean and easy to read when multiple blocks are detected in close proximity.
🔶 Interpreting Indicator
Breaker Blocks:
Breaker blocks are key areas where the price moves through and invalidates a previously identified order block. The indicator detects a breaker block when the price violates an order block by exceeding its high or low (depending on whether it's a bullish or bearish block). This violation is determined by either the wick or the close of a candle, depending on the user's selection in the "Violation Check" setting. When a breaker block is detected, the indicator removes the violated order block from the chart, signaling that the zone is no longer relevant for future price action.
Bullish Breaker Block: This occurs when a bearish order block (red) is violated by the price closing above the block’s top boundary or when the wick surpasses this level. It signals that a prior bearish structure has been invalidated, and the market may shift to a bullish trend.
Bearish Breaker Block: This occurs when a bullish order block (teal) is violated by the price closing below the block’s bottom boundary or when the wick drops below it. It suggests that a previous bullish structure has been broken, indicating potential bearish momentum.
Market Structure Labels:
"MSB" (Market Structure Break) labels indicate a potential change in trend direction.
"BOS" (Break of Structure) labels confirm the continuation of the current trend after breaking a significant level.
Block Strength:
A block with more green indicates stronger bullish interest.
A block with more red indicates stronger bearish interest.
The relative sizes of the green and red portions show the balance of power between buyers and sellers at that level.
🔶 Disclaimer
Use with Caution: This indicator is provided for educational and informational purposes only and should not be considered as financial advice. Users should exercise caution and perform their own analysis before making trading decisions based on the indicator's signals.
Not Financial Advice: The information provided by this indicator does not constitute financial advice, and the creator (UAlgo) shall not be held responsible for any trading losses incurred as a result of using this indicator.
Backtesting Recommended: Traders are encouraged to backtest the indicator thoroughly on historical data before using it in live trading to assess its performance and suitability for their trading strategies.
Risk Management: Trading involves inherent risks, and users should implement proper risk management strategies, including but not limited to stop-loss orders and position sizing, to mitigate potential losses.
No Guarantees: The accuracy and reliability of the indicator's signals cannot be guaranteed, as they are based on historical price data and past performance may not be indicative of future results.

Dynamic Resistance and Support LinesThis script is designed to dynamically plot support and resistance lines based on full-dollar and half-dollar price levels relative to the close price on a chart. The script is particularly useful for day traders and scalpers, as it helps visualize key psychological price levels that often act as support and resistance zones in volatile and fast-moving markets in real time.
Key Features:
Dynamic Resistance and Support Levels:
Full-dollar levels: These are calculated by rounding the close price to the nearest full dollar and then extending the levels by adding and subtracting increments of 1 (e.g., $1, $2, $3).
Half-dollar levels: These are calculated by adding and subtracting 0.5 increments to the nearest full-dollar price, providing additional reference points. The historical full-dollar levels remain where support and resistance may have occurred in the past.
Extend Lines:
You can toggle whether the support and resistance lines are extended to the right, left, or both directions. This allows flexibility in projecting potential future areas of support or resistance.
Custom Line Extension:
The user can set the number of bars (or time periods) that the support and resistance lines will extend, giving control over how long the levels remain on the chart.
Color-Coded Lines:
Red lines represent full-dollar resistance and support levels.
Blue lines represent half-dollar levels, making it easy to differentiate between key psychological price zones.
Line Flexibility:
The script allows the lines to extend both left and right on the chart, making it useful for analyzing historical price action or projecting future price movements. The number of bars for extension is customizable, allowing for tailored setups.
Nearest Full Dollar Plot:
The nearest full-dollar price level is plotted as a yellow circle on the chart. This serves as a quick visual cue for traders to monitor price proximity to critical levels.
Benefits in Day Trading, Scalping, and Volatile Markets:
Visualizing Key Psychological Levels:
Full-dollar and half-dollar price levels often act as psychological barriers for traders. This script helps traders easily identify these levels, which are important in both fast-moving markets and during sideways consolidation.
Improved Decision-Making:
By automatically drawing these support and resistance levels, the script helps day traders and scalpers make quicker and more informed decisions, especially in volatile markets where every second counts.
Adaptability to Market Conditions:
The flexibility of extending lines based on trader preferences allows the user to adapt the script to various market conditions, such as high volatility or trend-based trading, providing a clear view of potential breakout or reversal areas.
Better Risk Management:
Having predefined support and resistance levels helps traders better manage risk, as these levels can act as logical areas for setting stop losses or taking profits.
This script is especially valuable for traders looking to capitalize on quick market movements or identify key entry and exit points during market volatility.
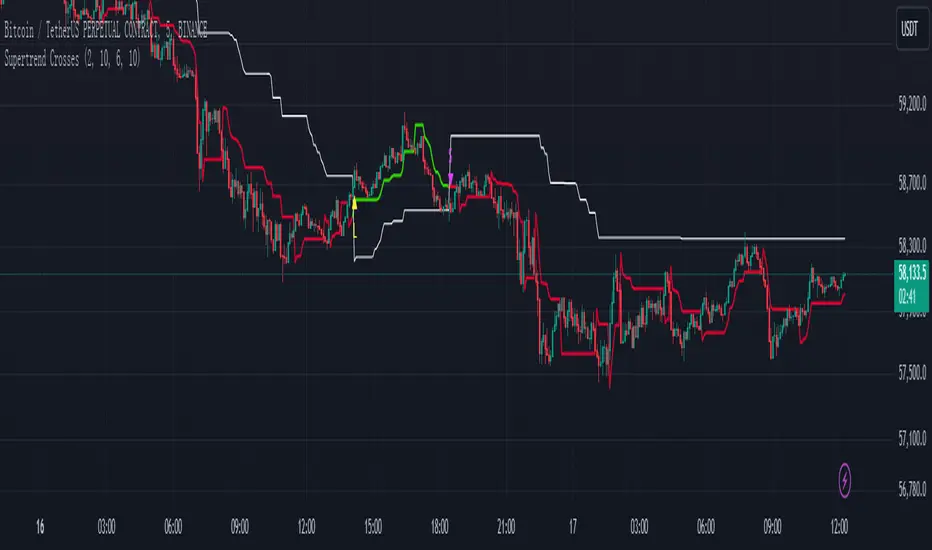
Supertrend Crosses_AITSupertrend Crosser
Overview:
The "Supertrend Crosses" indicator is a technical analysis tool that combines two Supertrend lines with different parameters to generate buy and sell signals based on their crossovers. The indicator uses color coding to visualize the market trend and provides alerts for potential trade entries.
1. Settings and Inputs:
Supertrend A:
Factor: Multiplier for the ATR (Average True Range), which determines the sensitivity of Supertrend A.
ATR Period: Number of periods used to calculate the ATR for Supertrend A.
Supertrend B:
Factor: Multiplier for the ATR, which determines the sensitivity of Supertrend B.
ATR Period: Number of periods used to calculate the ATR for Supertrend B.
2. Indicator Components:
Supertrend A:
Plotted on the chart using dynamic coloring:
Green when Supertrend A is above Supertrend B.
Red when Supertrend A is below Supertrend B.
Supertrend B:
Plotted on the chart in white color to provide a visual reference for the crossover signals.
3. Crossover Signals:
Long Signal:
Triggered when Supertrend A crosses above Supertrend B.
A yellow upward triangle ("L") is displayed on the chart below the price bar.
Short Signal:
Triggered when Supertrend A crosses below Supertrend B.
A fuchsia downward triangle ("S") is displayed on the chart above the price bar.
4. How to Use the Indicator:
Identifying Trend Changes:
When Supertrend A crosses above Supertrend B, it indicates a potential upward trend, generating a buy signal.
Conversely, when Supertrend A crosses below Supertrend B, it suggests a potential downward trend, generating a sell signal.
Signal Visualization:
Yellow "L" markers indicate long entry points (buy signals).
Fuchsia "S" markers indicate short entry points (sell signals).
Alerts:
The indicator is equipped with alert conditions for both long and short signals. Users can set up alerts in TradingView to receive notifications when these signals occur.
5. Customization:
Supertrend Parameters:
The factors and ATR periods for Supertrend A and B can be adjusted in the settings to fit different market conditions and trading strategies.
Show Signals Option:
The user can toggle the display of the buy and sell signals on the chart through the "Show Signals?" checkbox in the settings.
6. Visual Representation:
Lines:
Supertrend A: Plotted with dynamic coloring based on its relation to Supertrend B.
Supertrend B: Plotted in white for a clear reference.
Markers:
"L" (yellow) for long signals and "S" (fuchsia) for short signals are plotted on the chart at the point of crossover.
7. Alerts Setup:
Buy Signal Alert: Alerts the user when Supertrend A crosses above Supertrend B.
Sell Signal Alert: Alerts the user when Supertrend A crosses below Supertrend B.
8. Advantages:
Simple and Effective: This indicator simplifies trend identification by using crossovers of two Supertrend lines.
Customizable: The indicator's parameters can be tailored to suit different trading styles and asset classes.
Alerts: Provides alert functionality to ensure traders do not miss trading opportunities.
9. Usage Tips:
Combine with Other Indicators: For more reliable signals, consider using this indicator in conjunction with other technical analysis tools like RSI, MACD, or support and resistance levels.
Risk Management: Always use appropriate risk management techniques, such as stop-loss orders, to protect your capital.
The "Supertrend Crosses" indicator offers a straightforward approach to identifying potential trend reversals and trade entries using the crossover of two Supertrend lines. It provides clear visual signals and alert notifications, making it a valuable tool for traders looking to incorporate trend-following strategies.
Support Resistance DynamicsThe Support Resistance Dynamics indicator is an advanced technical analysis tool designed to identify and visualize key support and resistance levels in real-time. This innovative indicator stands out from traditional support and resistance tools by employing a dynamic approach that adapts to market conditions.
Key Features:
Dynamic Level Calculation: Unlike static support and resistance indicators, this tool continuously updates levels based on recent price action, providing traders with the most relevant and up-to-date information.
Logarithmic Scale Option: The indicator offers a unique logarithmic scale feature, essential for analyzing long-term trends or assets with significant price changes. This allows for more accurate level plotting across various timeframes and price ranges.
Customizable Display: Users can adjust the number of support and resistance lines displayed, allowing for a clean and uncluttered chart view while focusing on the most significant levels.
Adaptive Slope Calculation: The indicator uses an innovative approach to calculate the slope of support and resistance lines, offering options from dynamic adaptation to fixed long-term periods. This ensures the lines remain relevant in both trending and ranging markets.
Enhanced Visualization: With customizable line colors, styles, and transparency, traders can easily distinguish between support and resistance levels, improving chart readability and analysis.
Flexible Period Settings: From dynamic calculations based on recent pivots to fixed long-term periods, the indicator adapts to various trading styles and timeframes.
The Support Resistance Dynamics indicator is particularly useful for:
Identifying potential reversal points in trends
Setting more accurate entry and exit points for trades
Placing stop-loss orders with greater precision
Recognizing breakout levels for potential new trends
By combining dynamic calculation methods with customizable visual elements, this indicator provides traders with a powerful tool for market analysis. Whether you're a day trader looking for short-term opportunities or a long-term investor analyzing macro trends, the Support Resistance Dynamics indicator offers valuable insights to enhance your trading strategy.
This indicator is provided for informational and educational purposes only. It should not be considered as financial advice or a recommendation to buy or sell any financial instrument. Past performance is not indicative of future results. Trading involves significant risk of loss. Users should conduct their own research and due diligence before making any investment decisions. The creator of this indicator is not responsible for any losses incurred from its use. Always test thoroughly on demo accounts before applying to live trading.

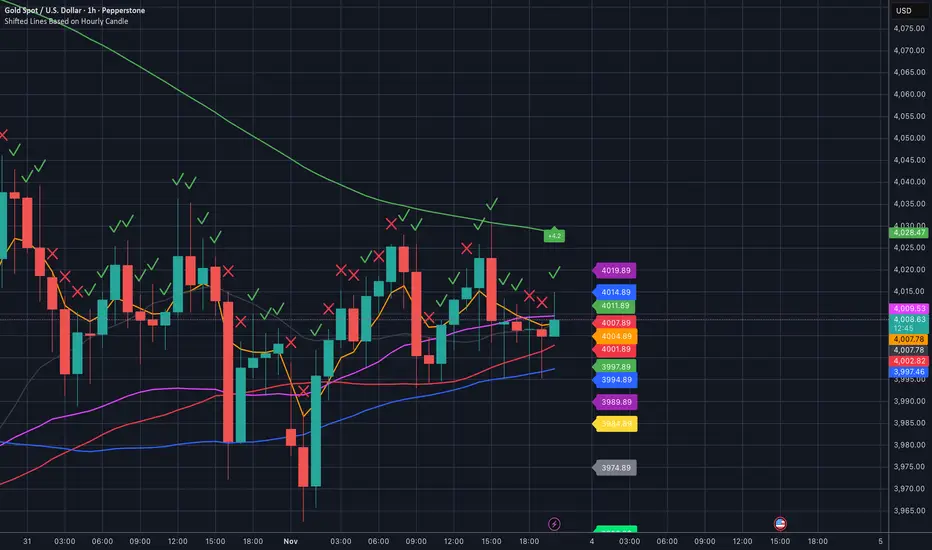
Shifted Lines Based on Hourly CandleOverview
The Shifted Lines Based on Hourly Candle indicator plots two dynamic horizontal lines on your chart, offset by a specified price amount above and below the closing price of the last completed hourly candle. These lines update every hour, providing real-time reference levels that can assist in identifying potential support and resistance zones.
How the Indicator Works
• Hourly Close Reference:
• The indicator uses the closing price of the most recent completed hourly candle as a reference point, regardless of your current chart timeframe.
• Price Offset Calculation:
• You can specify a Price Offset value, which determines how far above and below the hourly close the lines will be drawn.
• Upper Level: Calculated by adding the Price Offset to the hourly closing price.
• Lower Level: Calculated by subtracting the Price Offset from the hourly closing price.
• Dynamic Updates:
• The indicator automatically updates the positions of the lines at the start of each new hour, ensuring they always reflect the latest market data.
Settings and Parameters
Input Parameters
• Price Offset
• Description: The amount (in price units) by which the upper and lower lines are offset from the hourly closing price.
• Type: Numerical input (allows decimal values).
• Default Value: 10.0
• Usage: Adjust this value to set your desired offset distance. For instance, if you set it to 5, the upper line will be drawn 5 units above the hourly close, and the lower line will be 5 units below.
Style Settings
In the indicator’s Style tab, you’ll find the following options:
• Upper Level and Lower Level Lines:
• Color: Default is red. You can change it to any color that suits your preference.
• Line Width: Adjust the thickness of the lines for better visibility.
• Precision: Controls the number of decimal places displayed for the level values. It’s recommended to leave this at the default setting to match the instrument’s standard precision.
• Labels and Values:
• Labels on Price Scale: Enabled by default. This displays the current values of the upper and lower levels directly on the price scale, making them easily visible.
• Values in Status Line: Enabled by default. This shows the values of the levels in the status line at the top of the chart when you hover over the indicator.
Note: The default settings are optimized for general use. You don’t need to adjust them unless you have specific visualization preferences.
How to Use the Indicator
1. Adding the Indicator:
• Since the script is private, you can add it to your chart from the list of indicators you’ve been granted access to.
2. Configuring the Price Offset:
• Open the indicator settings by clicking the gear icon next to its name in the chart.
• In the Inputs tab, adjust the Price Offset to your desired value.
3. Interpreting the Lines:
• Upper Level Line:
• Represents a price level above the last hourly close, offset by your specified amount.
• Can act as a potential resistance level.
• Lower Level Line:
• Represents a price level below the last hourly close, offset by your specified amount.
• Can act as a potential support level.
4. Trading Applications:
• Support and Resistance:
• Use the lines to identify key support and resistance areas for potential entry and exit points.
• Breakout Strategies:
• Monitor price action around these levels to spot possible breakouts or reversals.
• Risk Management:
• Incorporate the levels into your stop-loss or take-profit strategies.
Practical Example
Suppose the last hourly candle closed at a price of 1,500, and your Price Offset is set to 10:
• Upper Level: 1,500 + 10 = 1,510
• Lower Level: 1,500 - 10 = 1,490
These levels will be plotted on your chart and will remain until the next hourly candle closes, at which point they will update based on the new closing price.
Notes and Tips
• Timeframe Flexibility:
• The indicator can be applied to any chart timeframe, but it always references the hourly close for consistency.
• No Need to Adjust Precision:
• The Precision setting in the Style tab is optimized for most instruments and typically doesn’t require changes.
• Visual Customization:
• Feel free to adjust the colors and line styles to integrate seamlessly with your chart’s appearance.
• Indicator Access:
• Since the script is private, only users with access can add it to their charts. The source code remains hidden to protect proprietary logic.
Relative volume zone + Smart Order Flow Dynamic S/ROverview:
The Relative Volume Zone + Smart Order Flow with Dynamic S/R indicator is designed to help traders identify key trading opportunities by combining multiple technical components. This script integrates relative volume analysis, order flow detection, VWAP, RSI filtering, and dynamic support and resistance levels to offer a comprehensive view of the market conditions. It is particularly effective on shorter timeframes (M5, M15), making it suitable for scalping and day trading strategies.
Key Components:
1. Relative Volume Zones:
• The script calculates the relative volume by comparing the current volume with the average volume over a defined lookback period (volLookback). When the relative volume exceeds a specified multiplier (volMultiplier), it indicates a high volume zone, signaling potential accumulation or distribution areas.
• Purpose: Identifies high-volume trading zones that may act as significant support or resistance, indicating possible entry or exit points.
2. Smart Order Flow Analysis:
• The indicator uses Volume Delta (the difference between buying and selling volume) and a Cumulative Delta to detect order imbalances in the market.
• Order Imbalance is identified using a moving average of the Volume Delta (orderImbalance), which helps highlight hidden buying or selling pressure.
• Purpose: Reveals market sentiment by showing whether buyers or sellers dominate the market, aiding in the identification of trend reversals or continuations.
3. VWAP (Volume Weighted Average Price):
• VWAP is calculated over a default daily length (vwapLength) to show the average price a security has traded at throughout the day, based on both volume and price.
• Purpose: Provides insight into the fair value of the asset, indicating whether the market is in an accumulation or distribution phase.
4. RSI (Relative Strength Index) Filter:
• RSI is used to filter buy and sell signals, preventing trades in overbought or oversold conditions. It is calculated using a specified period (rsiPeriod).
• Purpose: Reduces false signals and improves trade accuracy by only allowing trades when RSI conditions align with volume and order flow signals.
5. Dynamic Support and Resistance Levels:
• The script dynamically plots support and resistance levels based on recent swing highs and lows (swingLookback).
• Purpose: Identifies potential reversal zones where price action may change direction, allowing for more precise entry and exit points.
How It Works:
• Buy Signal:
A buy signal is generated when:
• The price enters a high-volume zone.
• The price crosses above a 5-period moving average.
• The cumulative delta shows more buying pressure (cumulativeDelta > SMA of cumulativeDelta).
• The RSI is below 70 (not in overbought conditions).
• Sell Signal:
A sell signal is generated when:
• The price enters a high-volume zone.
• The price crosses below a 5-period moving average.
• The cumulative delta shows more selling pressure (cumulativeDelta < SMA of cumulativeDelta).
• The RSI is above 30 (not in oversold conditions).
• Dynamic Support and Resistance Lines:
Drawn based on recent swing highs and lows, these lines provide context for potential price reversals or breakouts.
• VWAP and Order Imbalance Lines:
Plotted to show the average traded price and highlight order flow shifts, helping to validate buy/sell signals.
How to Use:
1. Apply the Indicator:
Add the script to your chart and adjust the settings to match your trading style and preferred timeframe (optimized for M5/M15).
2. Interpret the Signals:
Use the buy and sell signals in conjunction with dynamic support/resistance, VWAP, and order imbalance lines to identify high-probability trade setups.
3. Monitor Alerts:
Set alerts for significant order flow events to receive notifications when there is a positive or negative order imbalance, indicating potential market shifts.
What Makes It Unique:
This script is unique because it combines multiple market analysis tools — relative volume zones, smart order flow, VWAP, RSI filtering, and dynamic support/resistance — to provide a well-rounded, multi-dimensional view of the market. This integration allows traders to make more informed decisions by validating signals across various indicators, enhancing overall trading accuracy and effectiveness.
