Brooks 18 Bars [KintsugiTrading]Brooks 18 Bars
Overview:
This indicator allows traders to specify a time frame within each trading day and plots lines at the highest and lowest prices recorded during that period. It is particularly useful for identifying key levels of support and resistance within a specified time range.
Features:
User-Defined Time Frame: Traders can input their desired start and end times in a 24-hour format, allowing flexibility to analyze different market sessions.
High and Low Price Levels: The indicator plots lines representing the highest and lowest prices observed within the specified time frame each day.
Clear Visual Representation: The high and low lines are color-coded for easy identification, with the high & low prices in Kintsugi Trading Gold.
How to Use:
Set the Time Frame:
Adjust the "Start Time Hour" and "Start Time Minute" to define the beginning of your desired time frame.
Adjust the "End Time Hour" and "End Time Minute" to define the end of your desired time frame.
Analyze Key Levels:
Al Brooks popularized the following idea and basis for creating this indicator:
On a 5-minute chart, Bar 1 has a 20-30% chance of being the High or Low of the day.
Bar 12 has a 50% chance.
Bar 18 has an 80-90% chance.
Use the plotted lines to identify significant support and resistance levels within your specified time frame. These levels can help inform your trading decisions, such as entry and exit points.
Good luck with your trading!
Supporto e resistenza

Static S/R regions as per option chainThis Script can be used as a simple stencil to draw SR regions as per the ATM Strike prices of the stock.
The difference in the input section is the difference in between the strike prices in the option chain (for ex. Nifty Bank's difference is 100Rs).
The Script is completely input based and try to update your settings once you change a script/stock.

Candle Wick Shadows [UkutaLabs]█ OVERVIEW
The Candle Wick Shadows Indicator identifies untested wicks in real time that occur when there is an imbalance in the number of buyers and sellers at a price-level. This imbalance occurs when a market exchange receives too many of one kind of order, and not enough of its counterpoint.
Candle Wick Shadows is a powerful trading indicator that will automatically identify and label strong ranges on traders’ charts that can be incorporated into a wide variety of different trading strategies.
█ USAGE
The script automatically identifies and measures real-time ranges of imbalance between buying and selling pressure in the market using real-time price-action information. These levels indicate potential Supply and Demand zones which serve to help the trader identify areas where price has changed direction in the past due to an imbalance of buyers and sellers.
The script also allows users to mirror higher time frame Candle Wick Shadows onto lower time frame charts to gain a stronger understanding of key levels on another scale.
█ SETTINGS
Configuration
- Show Labels: Determines whether or not identification labels are drawn on the chart.
- Max CWS Display: Determines the number of Candle Wick Shadows that will be drawn on the chart. This is for each higher timeframe option that is toggled, not the total.
Current Time Frame
-Wick Shadow (On/Off): Determines whether or not wick shadows are drawn from the current time frame chart.
- Bullish Color: Determines the color of bullish wick shadows from the current time frame.
- Bearish Color: Determines the color of bearish wick shadows from the current time frame.
5 Minute (Higher Timeframe)
-Wick Shadow (On/Off): Determines whether or not wick shadows are drawn from the 5 minute time frame chart.
- Bullish Color: Determines the color of bullish wick shadows from the 5 minute time frame.
- Bearish Color: Determines the color of bearish wick shadows from the 5 minute time frame.
15 Minute (Higher Timeframe)
-Wick Shadow (On/Off): Determines whether or not wick shadows are drawn from the 15 minute time frame chart.
- Bullish Color: Determines the color of bullish wick shadows from the 15 minute time frame.
- Bearish Color: Determines the color of bearish wick shadows from the 15 minute time frame.
30 Minute (Higher Timeframe)
-Wick Shadow (On/Off): Determines whether or not wick shadows are drawn from the 30 minute time frame chart.
- Bullish Color: Determines the color of bullish wick shadows from the 30 minute time frame.
- Bearish Color: Determines the color of bearish wick shadows from the 30 minute time frame.
60 Minute (Higher Timeframe)
-Wick Shadow (On/Off): Determines whether or not wick shadows are drawn from the 60 minute time frame chart.
- Bullish Color: Determines the color of bullish wick shadows from the 60 minute time frame.
- Bearish Color: Determines the color of bearish wick shadows from the 60 minute time frame.
240 Minute (Higher Timeframe)
-Wick Shadow (On/Off): Determines whether or not wick shadows are drawn from the 240 minute time frame chart.
- Bullish Color: Determines the color of bullish wick shadows from the 240 minute time frame.
- Bearish Color: Determines the color of bearish wick shadows from the 240 minute time frame.
Daily (Higher Timeframe)
-Wick Shadow (On/Off): Determines whether or not wick shadows are drawn from the daily time frame chart.
- Bullish Color: Determines the color of bullish wick shadows from the daily time frame.
- Bearish Color: Determines the color of bearish wick shadows from the daily time frame.

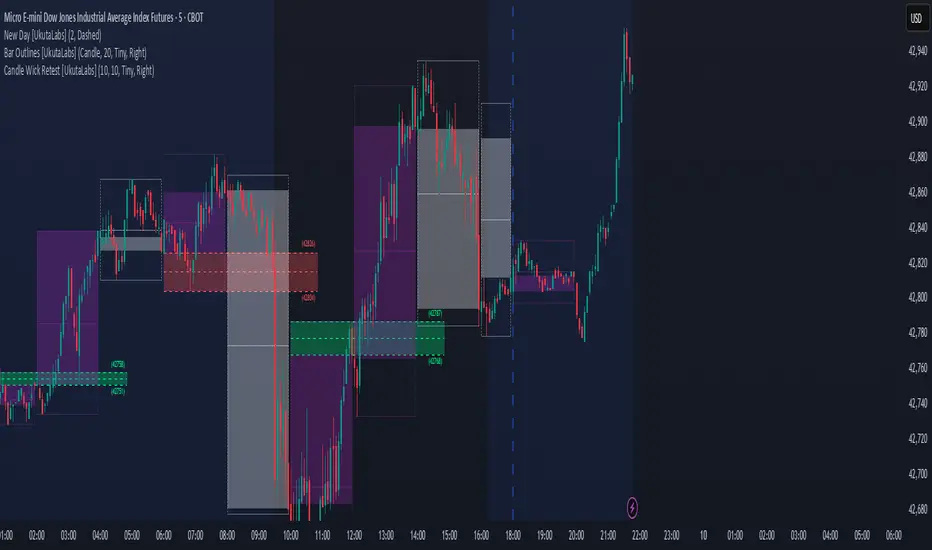
Candle Wick Retest [UkutaLabs]█ OVERVIEW
The Candle Wick Retest Indicator identifies untested wicks in real time that occur when there is an imbalance in the number of buyers and sellers at a price-level. This imbalance occurs when a market exchange receives too many of one kind of order, and not enough of its counterpoint.
Candle Wick Retest is a powerful trading indicator that will automatically identify and label strong ranges on traders’ charts that can be incorporated into a wide variety of different trading strategies.
█ USAGE
The script automatically identifies and measures real-time ranges of imbalance between buying and selling pressure in the market using real-time price-action information. These levels indicate potential Supply and Demand zones which serve to help the trader identify areas where price has changed direction in the past due to an imbalance of buyers and sellers.
The script also allows users to mirror higher time frame Candle Wick Retests onto lower time frame charts to gain a stronger understanding of key levels on another scale.
█ SETTINGS
Configuration
- Show Labels: Determines whether or not identification labels are drawn on the chart.
- Max CW Display: Determines the number of Candle Wick Retests that will be drawn on the chart. This is for each higher timeframe option that is toggled, not the total.
Current Time Frame
- Wick Retest (On/Off): Determines whether wick retests will be drawn from the current time frame chart.
- Wick Retest Bullish Color: Determines the color of bullish wick retests from the current time frame.
- Wick Retest Bearish Color: Determines the color of bearish wick retests from the current time frame.
5 Minute (Higher Timeframe)
- Wick Retest (On/Off): Determines whether wick retests will be drawn from the 5 minute chart.
- Wick Retest Bullish Color: Determines the color of bullish wick retests from the 5 minute time frame.
- Wick Retest Bearish Color: Determines the color of bearish wick retests from the 5 minute time frame.
15 Minute (Higher Timeframe)
- Wick Retest (On/Off): Determines whether wick retests will be drawn from the 15 minute time frame chart.
- Wick Retest Bullish Color: Determines the color of bullish wick retests from the 15 minute time frame.
- Wick Retest Bearish Color: Determines the color of bearish wick retests from the 15 minute time frame.
30 Minute (Higher Timeframe)
- Wick Retest (On/Off): Determines whether wick retests will be drawn from the 30 minute time frame chart.
- Wick Retest Bullish Color: Determines the color of bullish wick retests from the 30 minute time frame.
- Wick Retest Bearish Color: Determines the color of bearish wick retests from the 30 minute time frame.
60 Minute (Higher Timeframe)
- Wick Retest (On/Off): Determines whether wick retests will be drawn from the 60 minute time frame chart.
- Wick Retest Bullish Color: Determines the color of bullish wick retests from the 60 minute time frame.
- Wick Retest Bearish Color: Determines the color of bearish wick retests from the 60 minute time frame.
240 Minute (Higher Timeframe)
- Wick Retest (On/Off): Determines whether wick retests will be drawn from the 240 minute time frame chart.
- Wick Retest Bullish Color: Determines the color of bullish wick retests from the 240 minute time frame.
- Wick Retest Bearish Color: Determines the color of bearish wick retests from the 240 minute time frame.
Daily (Higher Timeframe)
- Wick Retest (On/Off): Determines whether wick retests will be drawn from the daily time frame chart.
- Wick Retest Bullish Color: Determines the color of bullish wick retests from the daily time frame.
- Wick Retest Bearish Color: Determines the color of bearish wick retests from the daily time frame.
Swing Pivots [UkutaLabs]█ OVERVIEW
The Swing Pivots indicator uses relevant price-action information to identify key levels of Support and Resistance. Traders will be able to use current day Swing Pivots as well as mirror higher time frame Swing Pivots to gain a stronger understanding of overall market strength and key levels.
The aim of this script is to improve the users trading experience by offering a versatile toolkit that can be used in a wide variety of trading strategies to help simplify the complexities of the market.
█ USAGE
Throughout the trading day, the script will automatically identify key High and Low levels in the market based on currently relevant price action information, giving users potentially strong support and resistance levels which serve to guide the trader throughout the complexities in the market.
The script will also Identify powerful Order Blocks which are clusters of orders executed at a specific price level which represent an imbalance between supply and demand. By identifying Order Blocks, the script can indicate valuable supply and demand zones which help signal potential market turning points for the trader.
Furthermore, the script allows the user to mirror higher time frame Swing Pivots onto lower time frame charts to gain a stronger understanding of overall market strength and key levels on multiple time frames from a single chart.
█ SETTINGS
Configuration
Pivot Strength: Determines the sensitivity of the pivot calculation. A higher strength will result in less pivots being drawn, and a lower strength will result in more pivots being drawn.
Current Time frame
• Display: Determines whether or not Swing Pivots from the current time frame will be drawn on the chart.
5 Minute (Higher Time Frame)
• Display: Determines whether or not Swing Pivots from the 5 minute time frame will be drawn on the chart.
15 Minute (Higher Time Frame)
• Display: Determines whether or not Swing Pivots from the 15 minute time frame will be drawn on the chart.
30 Minute (Higher Time Frame)
• Display: Determines whether or not Swing Pivots from the 30 minute time frame will be drawn on the chart.
1 Hour (Higher Time Frame)
• Display: Determines whether or not Swing Pivots from the 1 hour time frame will be drawn on the chart.
4 Hour (Higher Time Frame)
• Display: Determines whether or not Swing Pivots from the 4 hour time frame will be drawn on the chart.
Daily (Higher Time Frame)
• Display: Determines whether or not Swing Pivots from the daily time frame will be drawn on the chart.

Power Trends [UkutaLabs]█ OVERVIEW
The Power Trends Indicator is a versatile trading toolkit that offers unique insight into key price levels in the market. This script uses currently relevant price-action information to automatically detect pivot levels and use them to create powerful trendlines.
The aim of this script is to improve the trading experience of users by offering a versatile toolkit that can be used in a wide variety of trading strategies to help simplify the complexities of the market.
█ USAGE
The Power Trends Indicator will automatically identify pivot points in real-time using recent price-action information to ensure that all points being identified are relevant. Using these pivot points, the script then draws powerful trend lines that can be used as levels of resistance and support.
To ensure that only the most relevant information is being presented, only the most recent trend lines will be displayed on the user’s charts. As new trend lines are being drawn, older trend lines will become thinner so that traders can identify the most relevant lines at a glance.
The price of the most recent high and low pivot points will also be displayed on the chart and can be used as further levels of resistance and support.
When a recent pivot level is broken, it will be identified as a Break of Structure. This signifies that there may have been a change in market strength.
The Power Trends Indicator also supports multiple time frame mapping, allowing you to mirror the trend lines that would be drawn on higher time frame charts onto lower time frame charts. This feature allows traders to be aware of the market structure of multiple charts at a glance from a single chart.
When mirroring some higher time frame trend lines, lines may appear to not align properly with current time frame bars. This is done intentionally to ensure lines are being drawn accurately to their position on the higher time frame charts.
█ SETTINGS
Current Time Frame
• Display (On/Off): Determines whether or not trend lines are drawn from the current time frame.
• High Color: Determines the color of trend lines drawn on high pivots.
• Low Color: Determines the color of trend lines drawn on low pivots.
5 Minute (Higher Time Frame)
• Display (On/Off): Determines whether or not trend lines are drawn from the 5 minute higher time frame.
• High Color: Determines the color of trend lines drawn on high pivots from the 5 minute higher time frame.
• Low Color: Determines the color of trend lines drawn on low pivots from the 5 minute higher time frame.
15 Minute (Higher Time Frame)
• Display (On/Off): Determines whether or not trend lines are drawn from the 15 minute higher time frame.
• High Color: Determines the color of trend lines drawn on high pivots from the 15 minute higher time frame.
• Low Color: Determines the color of trend lines drawn on low pivots from the 15 minute higher time frame.
30 Minute (Higher Time Frame)
• Display (On/Off): Determines whether or not trend lines are drawn from the 30 minute higher time frame.
• High Color: Determines the color of trend lines drawn on high pivots from the 30 minute higher time frame.
• Low Color: Determines the color of trend lines drawn on low pivots from the 30 minute higher time frame.
60 Minute (Higher Time Frame)
• Display (On/Off): Determines whether or not trend lines are drawn from the 60 minute higher time frame.
• High Color: Determines the color of trend lines drawn on high pivots from the 60 minute higher time frame.
• Low Color: Determines the color of trend lines drawn on low pivots from the 60 minute higher time frame.
240 Minute (Higher Time Frame)
• Display (On/Off): Determines whether or not trend lines are drawn from the 240 minute higher time frame.
• High Color: Determines the color of trend lines drawn on high pivots from the 240 minute higher time frame.
• Low Color: Determines the color of trend lines drawn on low pivots from the 240 minute higher time frame.
Daily (Higher Time Frame)
• Display (On/Off): Determines whether or not trend lines are drawn from the daily time frame.
• High Color: Determines the color of trend lines drawn on high pivots from the daily higher time frame.
• Low Color: Determines the color of trend lines drawn on low pivots from the daily higher time frame.

Demand Supply Zone AlertsDemand Supply Zone Alert Indicator
This indicator functions as a scanner/screener and is designed to identify symbols with potential demand and supply zones and generate alerts based on your customized settings. It does not visually plot anything on the chart but is used to place alerts.
Key Features:
1. Demand Supply Zone Patterns:
- Drop Base Rally
- Rally Base Rally
- Rally Base Drop
- Drop Base Drop
2. Zoning Methods:
- Wick to Wick: In a demand zone, this method uses the highest high of the basing as the proximal line. For supply zones, it uses the lowest low of the basing.
- Body to Wick: In a demand zone, this method uses the highest body of the basing as the proximal line. For supply zones, it uses the lowest body of the basing.
3. Legin Methods:
- Candle Type: Based on the candle's bullish or bearish structure.
- Candle Color: Uses the candle color to determine the legin, with green indicating a rally and red indicating a drop.
4. Additional Zone Options:
- Follow Through Pattern: Zones with one legout followed by another legout, based on user-defined strength settings.
- Overnight Gap Zones: Zones formed due to overnight gaps after the basing.
- All Demand Supply Zone Structures: Includes all zones, even if they are not considered quality zones.
5. Zone Settings:
- Number of Candles in Basing: Customize the number of candles in the basing phase. For example, setting it to 3 will only identify zones with 3 or fewer basing candles.
- Legout Strength for Single Legout Pattern: Defines how strong a legout candle must be to qualify as a zone.
- Legout Strength for Follow-Through Pattern: Specifies the strength required for two consecutive legout candles to qualify as a follow-through pattern.
Functionality:
The indicator identifies zones based on a three-component structure: legin, basing, and legout. It uses an algorithm that categorizes candles as legin, basing, or legout based on their range compared to the average candle on the chart. Quality zones are defined by legout candles that are significantly larger than the average candle, while basing candles are smaller.
Once a valid zone structure is identified, the indicator will generate an alert from the list of symbols provided in the settings. Alerts will notify users according to their alert notification settings.
Usage Recommendations:
- This indicator works as a real-time scanner or screener to shortlist symbols when a valid zone is formed based on user settings.
- It aids in identifying potential demand and supply zones, but does not provide explicit buy or sell signals.
- Users should integrate this tool with their own trading plan and thoroughly evaluate any identified symbols before making trades.
Limitations:
This indicator does not provide explicit buy or sell signals. It is intended to aid in identifying symbols where demand and supply zones are being created. Users should use this tool in conjunction with their own trade plan and thoroughly evaluate any identified symbols before making any trades.
Disclaimer:
Please ensure you thoroughly evaluate and qualify any identified symbols according to your individual trade plan before making any trades.

ICT Market Structure Screener (Zeiierman)█ Overview
The ICT Market Structure Screener (Zeiierman) is designed to identify and display key market structure levels and patterns based on Smart Money Concepts. It highlights bullish and bearish structures, premium and discount levels, and generates alerts for significant market structure changes, making it a valuable tool for traders looking to understand institutional trading behaviors and market trends. A key feature of this indicator is its screener function, which allows traders to monitor multiple symbols simultaneously. This feature provides a consolidated view of the market structure for various assets, making it easier to identify trading opportunities across a diverse portfolio.
█ How It Works
The ICT Market Structure Screener operates by identifying high and low pivot points within a specified period, then analyzing these pivots to determine changes in market structure. The indicator tracks price movements and categorizes them into bullish or bearish structures, indicating potential trend reversals or continuations. By plotting premium and discount levels, it helps traders identify overbought and oversold conditions. The indicator also provides real-time updates and alerts for significant changes in the market structure.
█ Terminology
ChoCH (Change of Character): Indicates a potential reversal in market direction. It is identified when the price breaks a significant high or low, suggesting a shift from a bullish to bearish trend or vice versa.
SMS (Smart Money Shift): Represents the transition phase in market structure where smart money begins accumulating or distributing assets. It typically follows a BMS and indicates the start of a new trend.
BMS (Bullish/Bearish Market Structure): Confirms the trend direction. Bullish Market Structure (BMS) confirms an uptrend, while Bearish Market Structure (BMS) confirms a downtrend. It is characterized by a series of higher highs and higher lows (bullish) or lower highs and lower lows (bearish).
Premium: A zone where the price is considered overbought. It is calculated as the upper range of the current market structure and indicates a potential area for selling or shorting.
Mid Range: The midpoint between the high and low of the market structure. It often acts as a support or resistance level, helping traders identify potential reversal or continuation points.
Discount: A zone where the price is considered oversold. It is calculated as the lower range of the current market structure and indicates a potential area for buying or going long.
█ How to Use
The ICT Market Structure Screener allows traders to follow smart money moves in the market more effectively. By identifying key market levels and monitoring bullish and bearish structures, traders can easily spot trend changes and strong trends. The indicator's premium and discount levels help identify overbought and oversold conditions, providing valuable entry and exit points. Alerts for ChoCH, SMS, and BMS keep traders informed about significant market changes, enabling real-time adjustments to trading strategies.
The screener functionality is particularly valuable for monitoring multiple markets simultaneously. The screener table displays critical information such as current price, trend direction, signal type, and premium/discount levels for each symbol. This makes it easier to track the market structure of various assets at a glance and quickly identify trading opportunities across different markets.
Example Strategies:
⚪ Trend Following: Use the indicator to identify the current market trend (bullish or bearish) and trade in the direction of the trend. Enter trades on pullbacks to premium (for shorts) or discount (for longs) levels.
⚪ Reversal Trading: Look for ChoCH signals to identify potential trend reversals. Enter trades when the price breaks a significant high or low and confirms a change in market structure, or wait for a retest of the nearest Orderblock that was formed.
⚪ Support and Resistance: Utilize the mid-range, premium, and discount levels as support and resistance zones. Enter trades when the price approaches these levels and shows signs of reversal or continuation.
⚪ Multi-Symbol Analysis: Use the screener table to monitor multiple symbols and quickly assess their market structure. This helps in diversifying trading opportunities and managing a portfolio of assets efficiently.
█ Settings
Period: The pivot period for calculating the structure. Increasing the period captures broader trends, making the structure more representative of long-term movements. Decreasing the period focuses on shorter-term trends, increasing sensitivity.
Response: Enabling this option uses the response period instead of the pivot period, providing more flexibility in capturing short-term or long-term structures. The period for the response, which determines the structure's sensitivity. Increasing the response period smoothens the structure, making it less reactive to short-term fluctuations. Decreasing the response period makes the structure more responsive to short-term changes.
Structure Display: Choose between displaying the active range or the previous range. 'Active Range' shows real-time premium, discount, and mid-range levels based on the current structure. 'Previous Range' displays past ranges, useful for analyzing historical support/resistance levels.
Ticker Symbols: List of symbols to include in the screener. Enabling the option includes the symbol in the screener, allowing the user to track its structure. Disabling it excludes the symbol from the screener, reducing the number of tracked symbols.
-----------------
Disclaimer
The information contained in my Scripts/Indicators/Ideas/Algos/Systems does not constitute financial advice or a solicitation to buy or sell any securities of any type. I will not accept liability for any loss or damage, including without limitation any loss of profit, which may arise directly or indirectly from the use of or reliance on such information.
All investments involve risk, and the past performance of a security, industry, sector, market, financial product, trading strategy, backtest, or individual's trading does not guarantee future results or returns. Investors are fully responsible for any investment decisions they make. Such decisions should be based solely on an evaluation of their financial circumstances, investment objectives, risk tolerance, and liquidity needs.
My Scripts/Indicators/Ideas/Algos/Systems are only for educational purposes!

Pure Price Action Structures [LuxAlgo]The Pure Price Action Structures indicator is a pure price action analysis tool designed to automatically identify real-time market structures.
The indicator identifies short-term, intermediate-term, and long-term swing highs and lows, forming the foundation for real-time detection of shifts and breaks in market structure.
Its distinctive/unique feature lies in its reliance solely on price patterns, without being limited by any user-defined input, ensuring a robust and objective analysis of market dynamics.
🔶 USAGE
Market structure is a crucial aspect of understanding price action. The script automatically identifies real-time market structure, enabling traders to comprehend market trends more easily. It assists traders in recognizing both trend changes and continuations.
Market structures are constructed from three sets of swing points, short-term swings, intermediary swings, and long-term swings. Market structures associated with longer-term swing points are indicative of longer-term trends.
A market structure shift (MSS), also known as a change of character (CHoCH), is a significant event in price action analysis that may signal a potential shift in market sentiment or direction. Conversely, a break of structure (BOS) is another significant event in price action analysis that typically indicates a continuation of the prevailing trend.
However, it's important to note that while an MSS can be the first indication of a trend reversal and a BOS signifies a continuation of the prevailing trend, they do not guarantee a complete reversal or continuation of the trend.
In some cases, MSS and BOS levels may also act as liquidity zones or areas of price consolidation, rather than indicating a definitive change in market direction or continuation. Traders should approach them with caution and consider additional factors to confirm the validity of the signal before making trading decisions.
🔶 DETAILS
🔹 Market Structures
Market structures are based on the analysis of price action and aim to identify key levels and patterns in the market, where swing point detection is one of the core concepts within ICT trading methodologies and teachings.
Swing points are automatically detected solely based on market movements, without any reliance on user-defined input.
🔹 Utilizing Swing Points
Swing points are not identified in real time as they occur. While short-term swing points may be displayed with a delay of at most one bar, the identification of intermediate and long-term swing points depends entirely on market movements. Furthermore, detection is not limited by any user-defined input but relies solely on pure price action. Consequently, swing points are not typically utilized in real-time trading scenarios.
Traders often analyze historical swing points to discern market trends and pinpoint potential entry and exit points for their trades. By identifying swing highs and lows, traders can:
Recognize Trends: Swing highs and lows help traders identify the direction of the trend. Higher swing highs and higher swing lows indicate an uptrend, while lower swing highs and lower swing lows indicate a downtrend.
Identify Support and Resistance Levels: Swing highs often serve as resistance levels, known in ICT terminology as Buyside Liquidity Levels, while swing lows function as support levels, also referred to in ICT terminology as Sellside Liquidity Levels. Traders can utilize these levels to strategize entry and exit points for their trades.
Spot Reversal Patterns: Swing points can form various reversal patterns, such as double tops or bottoms, head and shoulders patterns, and triangles. Recognizing these patterns can signal potential trend reversals, allowing traders to adjust their strategies accordingly.
Set Stop Loss and Take Profit Levels: In the context of ICT teachings, swing levels represent specific price levels where a concentration of buy or sell orders is anticipated. Traders can target these liquidity levels/pools to accumulate or distribute their positions, essentially using swing points to establish stop loss and take profit levels for their trades.
Overall, swing points provide valuable information about market dynamics and can assist traders in making more informed trading decisions.
🔶 SETTINGS
🔹 Structures
Swings and Size: Toggles the visibility of the structure's highs and lows, assigns an icon corresponding to the structures, and controls the size of the icons.
Market Structures: Toggles the visibility of the market structures.
Market Structure Labels: Controls the visibility of labels that highlight the type of market structure.
Line Style and Width: Customizes the style and width of the lines representing the market structure.
Swing and Line Colors: Customizes colors for the icons representing highs and lows, and the lines and labels representing the market structure.
🔶 RELATED SCRIPTS
Market-Structures-(Intrabar).
Buyside-Sellside-Liquidity.

Fibonacci IntraDay Range [UkutaLabs]█ OVERVIEW
The Fibonacci IntraDay Range is a powerful trading tool that combines recent price action data with key Fibonacci ratios to identify strong levels of support and resistance.
The purpose of this script is to simplify the trading experience of users by identifying and labelling strong levels of support and resistance that they should be aware of.
█ USAGE
At the beginning of each trading day, the Fibonacci IntraDay Range indicator will calculate the average total range of the past 14 trading days. This average will be drawn on either side of the open, then several more levels will be drawn between them using Fibonacci ratios.
These levels can be treated as levels of support and resistance that can be incorporated into many different trading strategies.
Each line will also have an identifying label so traders will know at a glance what each line represents. These labels can be toggled in the settings.
█ SETTINGS
Configuration
• Show Labels: Determines whether or not labels will be drawn on each line.
• Display Mode: Determines the number of days to load.
• Font Size: Determines the font size of labels.
• Text Alignment: Determines the alignment of labels on their respective line.

Inversion Fair Value Gaps [TradingFinder] IFVG ICT Signal| Alert🔵 Introduction
🟣 Inversion Fair Value Gap (IFVG)
An ICT Inversion Fair Value Gap, or reverse FVG, occurs when a fair value gap fails to hold its price, resulting in the price moving beyond and breaking the gap. This situation marks the initial change in price momentum.
Generally, prices respect fair value gaps and continue in their trend direction. However, when a fair value gap is breached, it transforms into an inversion fair value gap, signaling a potential short-term reversal or a subsequent change in direction.
🔵 How to Use
🟣 Identifying an Inversion Fair Value Gap
To spot an IFVG, you must first identify a fair value gap.
Inversion fair value gaps can be categorized into two types :
🟣 Bullish Inversion Fair Value Gap
A bullish IFVG occurs when a bearish fair value gap is invalidated by the price closing above it.
Steps to identify it :
Identify a bearish fair value gap.
When the price closes above this gap, it becomes a bullish inversion fair value gap.
This gap acts as a support level, pushing the price upwards and indicating a shift in momentum from sellers to buyers.
🟣 Bearish Inversion Fair Value Gap
A bearish IFVG happens when a bullish fair value gap fails, with the price closing below it.
Steps to identify it :
Identify a bullish fair value gap.
When the price closes below this gap, it becomes a bearish inversion fair value gap.
This gap acts as a resistance level, pushing the price downwards and indicating a shift in momentum from buyers to sellers.
🔵 Settings
🟣 Global Settings
Show All Inversion FVG: If disabled, only the most recent FVG will be displayed.
IFVG Validity Period (Bar): Determines the maximum duration (in number of candles) that the FVG and IFVG remain valid.Switching Colors Theme Mode: Includes three modes: "Off", "Light", and "Dark". "Light" mode adjusts colors for light mode use, "Dark" mode adjusts colors for dark mode use, and "Off" disables color adjustments.
🟣 Logic Settings
FVG Filter : This refines the number of identified FVG areas based on a specified algorithm to focus on higher quality signals and reduce noise.
Types of FVG filters :
Very Aggressive Filter : Adds a condition where, for an upward FVG, the last candle's highest price must exceed the middle candle's highest price, and for a downward FVG, the last candle's lowest price must be lower than the middle candle's lowest price. This minimally filters out FVGs.
Aggressive Filte r: Builds on the Very Aggressive mode by ensuring the middle candle is not too small, filtering out more FVGs.
Defensive Filter : Adds criteria regarding the size and structure of the middle candle, requiring it to have a substantial body and specific polarity conditions, filtering out a significant number of FVGs.
Very Defensive Filter : Further refines filtering by ensuring the first and third candles are not small-bodied doji candles, retaining only the highest quality signals.
Mitigation Level FVG and IFVG : Options include "Proximal", "Distal", or "50 % OB" modes, which you can choose based on your needs. The "50 % OB" line is the midpoint between distal and proximal.
🟣 Display Settings
Show Bullish IFVG : Toggles the display of demand-related boxes.
Show Bearish IFVG : Toggles the display of supply-related boxes.
🟣 Alert Settings
Alert Inversion FVG Mitigation : Enables alerts for Inversion FVG mitigation.
Message Frequency : Determines the frequency of alerts. Options include 'All' (every function call), 'Once Per Bar' (first call within the bar), and 'Once Per Bar Close' (final script execution of the real-time bar). Default is 'Once per Bar'.
Show Alert Time by Time Zone : Configures the time zone for alert messages. Default is 'UTC'.
Display More Info : Provides additional details in alert messages, including price range, date, hour, and minute. Set to 'Off' to exclude this information.

GL Gann Swing IndicatorIntroduction
The GL Gann Swing Indicator is a versatile tool designed to help traders identify market trends, support and resistance areas, and potential reversals. This indicator applies the principles of Gann Swing Charts, a technique developed by W.D. Gann, which focuses on market swings to determine the overall direction and turning points of price action. Gann Swing Charts are a time-tested method of technical analysis that simplifies price action by focusing on significant highs and lows, thereby eliminating market noise and providing a clearer view of the trend.
By analyzing price action and determining swing directions and turning points, the indicator filters out market noise using four distinct bar types:
Up Bar: Higher High, Higher Low
Down Bar: Lower High, Lower Low
Inside Bar: Lower High, Higher Low
Outside Bar: Higher High, Lower Low
This approach helps traders to:
Identify the primary trend direction.
Determine key support and resistance levels.
Recognize potential reversal points.
Filter out minor price fluctuations that do not affect the overall trend.
Features
Bar Types: Display bar types by checking the Show Bar Type box in the indicator's settings. Up bars appear as green upward-pointing triangles, down bars as red downward-pointing triangles, inside bars as grey circles, and outside bars as blue diamonds. These visual aids help traders quickly identify the type of bar and its significance.
Break Lines: These lines highlight when the price rises above a previous swing high or falls below a prior swing low. Green lines indicate breaks of swing highs, while red lines indicate breaks of swing lows. Break lines are enabled by default but can be turned off in the indicator's settings. Break lines provide visual confirmation of trend continuation or reversal.
Bar Count: Bar counts help determine if a swing is overextended and if a reversal is likely. This feature is off by default but can be enabled in the indicator's settings. Users can set a minimum bar count to focus on significant swings. Analyzing the number of bars in a swing can help traders gauge the strength and potential exhaustion of a trend.
Swing MA (Moving Averages): This feature plots the average of a user-defined number of previous swing highs and lows. Options are available to add two moving averages, allowing for both fast and slow averages. Swing MAs can be enabled in the indicator's settings. These moving averages smooth out the price data, making it easier to identify the underlying trend direction.
Why This Indicator is Useful
The GL Gann Swing Indicator is particularly useful for several reasons:
Trend Identification: By focusing on significant price swings, the indicator helps traders identify the primary trend direction, making it easier to align trades with the overall market movement.
Noise Reduction: The indicator filters out minor price fluctuations, allowing traders to focus on meaningful market movements and avoid being misled by short-term volatility.
Support and Resistance Levels: By highlighting key swing highs and lows, the indicator helps traders identify crucial support and resistance levels, which are essential for making informed trading decisions.
Potential Reversals: The indicator's ability to identify overextended swings and potential reversal points can help traders anticipate market turning points and adjust their strategies accordingly.
Customizability: With options to display bar types, break lines, bar counts, and swing moving averages, traders can customize the indicator to suit their specific trading style and preferences.
By incorporating Gann Swing principles, the GL Gann Swing Indicator offers traders a powerful tool to enhance their technical analysis, improve their trading decisions, and ultimately achieve better trading outcomes.

Heiken Ashi Ribbon [UkutaLabs]█ OVERVIEW
The Heiken Ashi Ribbon is a powerful trading tool that creates a strong ribbon that indicates market strength. This ribbon is created using four moving averages that use Heiken Ashi values (high, low, open and close) as its input values.
The ribbon will also be colored green, red or grey depending on whether or not its direction aligns with current market strength.
█ USAGE
The Heiken Ashi Ribbon is created using a series of four moving averages that uses values from the Heiken Ashi bars as its inputs. The user has the ability to select whether the moving averages are EMAs or SMAs, as well as the ability to control the period of the moving averages.
If the moving average calculated using the Heiken Ashi Open is below the moving average calculated using the Heiken Ashi Close, the ribbon will be colored green, indicating a bullish trend. If the moving average calculated using the Heiken Ashi Open is above the moving average calculated using the Heiken Ashi Open, the ribbon will be colored red, indicating a bearish trend.
This indicator also uses a series of hidden EMAs to determine market strength. If these EMAs do not align with the direction of the Heiken Ashi Ribbon, the Ribbon will instead be colored grey, indicating uncertainty in the market, as well as a possible reversal.
█ SETTINGS
Configuration
• Moving Average Type: Determines whether or not the Heiken Ashi Moving Averages will be drawn as EMAs or SMAs.
• Moving Average Period: Determines the period of the Heiken Ashi Moving Averages.
Moving Average
• Moving Average Input: Determines the input values for the hidden EMAs.

Candle Body Support/Resistance [LuxAlgo]The Candle Body Support/Resistance indicator is a tool that provides Support/Resistance levels from high-volatility candles, a concept originally described by Steve Nison in "Beyond Candlesticks".
Users can define the candle body percentage used to set the detected support/resistance levels. Occurrences of price testing the returned levels are highlighted using user-customizable dots.
🔶 USAGE
Support/Resistance levels are drawn from volatile candles, that is candles having a body (range between opening and closing price) whose magnitude is larger than the Volatility Threshold , which is determined by the multiplicative factor of an ATR (Average True Range) using a user set length.
The level starts from the opening price +/- a percentage of the open-close range. Users can adjust the percentage of the candle body used as support/resistance levels respectively, with higher percentage values returning levels prone to get reached sooner by the price.
A test is considered valid when a wick passes through the Support/Resistance level while the closing price is not breaking it.
Two modes are included, Trailing and Historical , both affecting the displayed elements of the indicator, these are described in the sub-section below.
🔹 Historical
The Historical Mode will draw a separate line from every Volatile Candle . When this line is tested, a dot will be drawn.
In the above example, the red resistance line was tested once until a bullish volatile candle formed, which closed just below the resistance level. The resistance level was tested again, after which the newly created support level was broken quickly, and the price decreased. These levels proved helpful later, acting as resistance/support levels (illustrated by the extra manually drawn dashed white lines).
To prevent cluttering Support/Resistance , lines will be deleted when the line is mitigated and hasn't been tested.
When a Support/Resistance line reaches its Maximum Line Length , it will also be deleted when it has not been tested.
🔹 Trailing
When a new volatile candle of the same type (bullish/bearish) appears while the Support/Resistance isn't broken, this line will be updated with the values of the new volatile candle. This creates a trailing line and a less cluttered chart.
Unlike the Historical mode , a line will not be deleted after a while or when it is mitigated. Instead, the line won't be updated anymore. A new line will start from the next found volatile candle.
Using the same situation as the Historical Mode example, we can note the future significance of old support/resistance levels (illustrated by the extra manually drawn dashed white lines).
The user can switch between these 2 modes, each offering a unique perspective on the market. This provides a more in-depth examination of the market, enhancing the user's trading analysis.
Using a copy of our indicator while using both modes can also be helpful.
🔶 DETAILS
The Support level is the opening price of a bullish volatile candle plus a user-set percentage of the candle's body, while the Resistance level is the opening price of a bearish volatile candle minus a percentage of the candle's body.
The following example illustrates the ATR with the multiplicative factor (Volatility Threshold) where the body of Volatile candles exceeds the ATR limits. Changing the Volatility Threshold and ATR length gives users extra flexibility to adjust to their needs.
🔹 Max Line Length
When using the Historical Mode and the duration of a displayed level reaches the user-set Max Line Length value, the level will return to the last test or be deleted when it has not been tested.
🔶 SETTINGS
Display Mode: Display mode of the indicator.
Support %: Sets the distance of the Support Line from the opening price relative to the candle body.
Resistance %: Sets the distance of the Resistance Line from the opening price relative to the candle body.
🔹 Filter
Length ATR: Amount of bars for the calculation of the Average True Range.
Volatility Threshold: multiplicative factor of ATR.
Max Line Length: Maximum allowed duration/length (in bars) of a Support/Resistance level.

Spiral Levels [ChartPrime]SPIRAL LEVELS
⯁ OVERVIEW
The Spiral Levels [ ChartPrime ] indicator, designed for use on TradingView and developed with Pine Script™ , leveraging a combination of traditional pivot points and spiral geometry to visualize support and resistance levels on the chart. By plotting spirals from pivot points, the indicator provides a distinctive perspective on potential price movements.
It's an experiment inspired from spirals in the Pine documentation and the concept of using spirals to add padding/offsets to SR zones in a market (an idea we plan to expand on in the future).
◆ USAGE
● Identifying Pivot Points: The indicator identifies significant pivot highs and lows based on user-defined criteria.
● Filtered Pivot Points: Pivot points for spirals are filtered using volume and high/low thresholds to ensure they are significant.
● Spiral Visualization: Spirals are plotted from these pivots, indicating potential future support and resistance levels or as liquidity zones.
Additionally, the plotted levels can serve as liquidity zones where the price might attempt to grab liquidity, providing a deeper understanding of market behavior at significant volume levels.
● Volume-Based Coloring: Spirals are colored based on volume data, providing additional context about the strength of the price movement.
● Labeling and Line Extensions: Labels display volume information, and lines extend from the end of the spirals to the current bar for clarity.
● Spiral Rotation: By adjusting the "Number of spiral rotations" input, you can control the number of rotations each spiral makes around a pivot point, offering more detailed insights. This also allows you to control the distance of levels from a pivot. More rotations will extend the spiral further from the pivot point, potentially identifying support and resistance levels or liquidity zones at greater distances.
This modification emphasizes that the number of rotations not only provides more detailed insights but also affects the spatial distribution of the identified levels relative to the pivot point.
⯁ USER INPUTS
● Pivots
Left Bars: Determines the number of bars to the left of the pivot.
Right Bars: Determines the number of bars to the right of the pivot.
● Filter
Volume Filter: Sets the threshold for volume filtering.
High & Low Filter: Sets the threshold for filtering pivot highs and lows.
● Spiral
Spirals Shown: Specifies the number of spirals to be displayed on the chart.
Number of spiral rotations: Sets the number of rotations for each spiral.
X Scale: Adjusts the horizontal scale of the spirals.
Y Scale: Adjusts the vertical scale of the spirals, relative to the ATR(200).
Reverse Spirals: Option to reverse the direction of the spirals.
⯁ TECHNICAL NOTES
The indicator uses Pine Script's polyline feature for smooth spiral rendering.
It implements a custom cross detection function to manage line and label visibility.
The script is optimized to limit calculations to the last 1000 bars for performance.
It automatically manages the number of displayed elements to prevent clutter and ensure smooth performance.
The Spiral Levels ChartPrime indicator offers a unique and visually engaging method to identify potential support and resistance levels. By integrating volume data and pivot points with spiral geometry, traders can gain valuable insights into market dynamics and make more informed trading decisions.

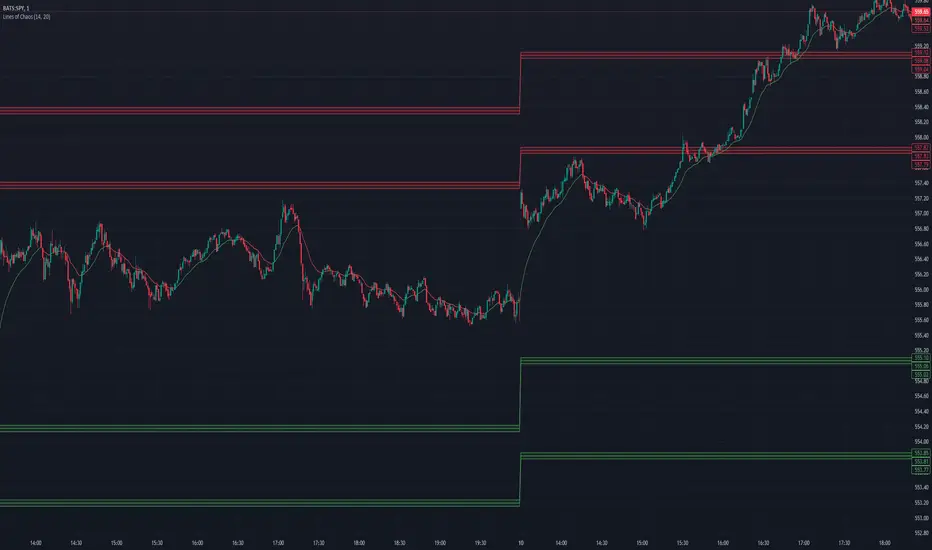
Lines of Chaos (ATR/ADR Levels)Lines of Chaos Indicator
This script is designed to provide traders with ATR (Average True Range) and ADR (Average Daily Range) support and resistance levels.
How it Works:
Support and Resistance Lines: The script plots ATR/ADR-based support and resistance lines based on a moving average of the last ATR/ADR Length days, the previous day's close, and the current day's open. Changing the ATR/ADR Length value changes the number of days of data to average.
EMA: The EMA is colored red when the ticker is potentially bearish. The EMA is colored green when the ticker is potentially bullish. Changing the EMA Length changes the number of data bars to average.
Default Settings: The default settings are optimized for most trading environments.
Key Features:
ATR & ADR Calculation: You can use ATR, ADR, or both. ATR is recommended for most scenarios.
Customizable Lengths: Adjust the ATR/ADR Length to refine the average calculation to your preference, with 14 being the standard value.
EMA for Market Bias: The EMA helps determine the ticker bias. It is colored green when the market is above the average price and red when below. This allows you to more easily determine whether or not the ADR/ATR levels are valid.
Versatile Usage: Suitable for various trading types, ensuring broad applicability across different market conditions.
How to Use:
Bounces off Levels: When the price bounces off a support/resistance level, the price will likely respect this level. This indicates that the price is unlikely to exceed the ticker's average volatility.
Breakthroughs of Levels: When the price breaks through a support/resistance level, the price will likely continue beyond this level. This indicates that the price has moved beyond that ticker's average volatility.