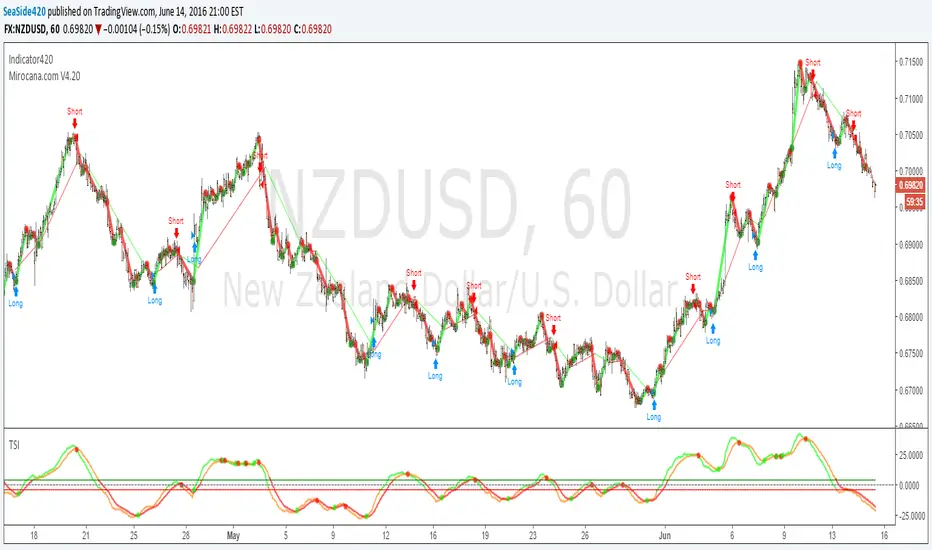
True Strength Index (TSI)

Trader Set - Volume MomentumThis is a Momentum indicator but on "Volume" The formula is heavily tweaked version of TSI with chance of using different averaging types, the period numbers are fixed and user don't need to type anything for them!
Please don't contact me for getting access, these tools are available for my students only. These are part of my "methodology" that I teach. The English version of the website and learning material is under development and I will announce it under each related script when they are ready so that those who are interested can participate in the course.
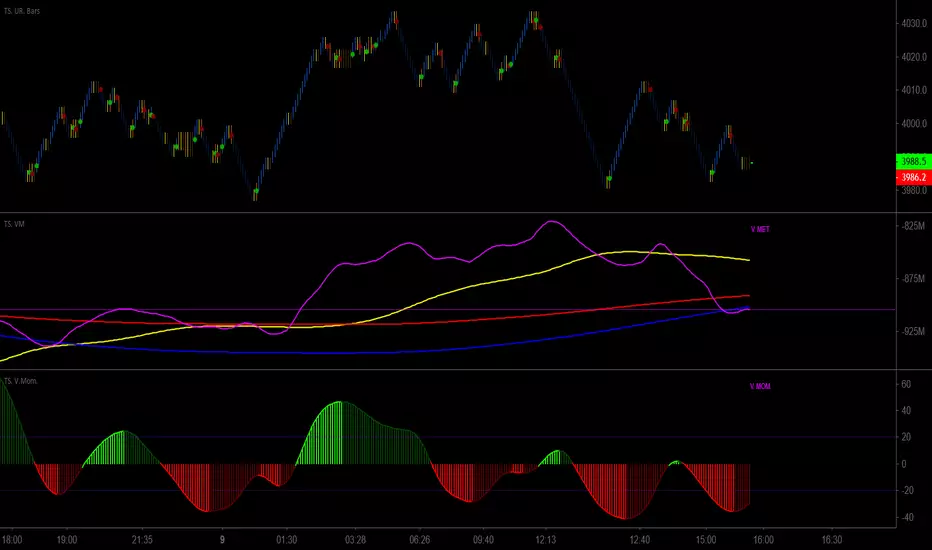
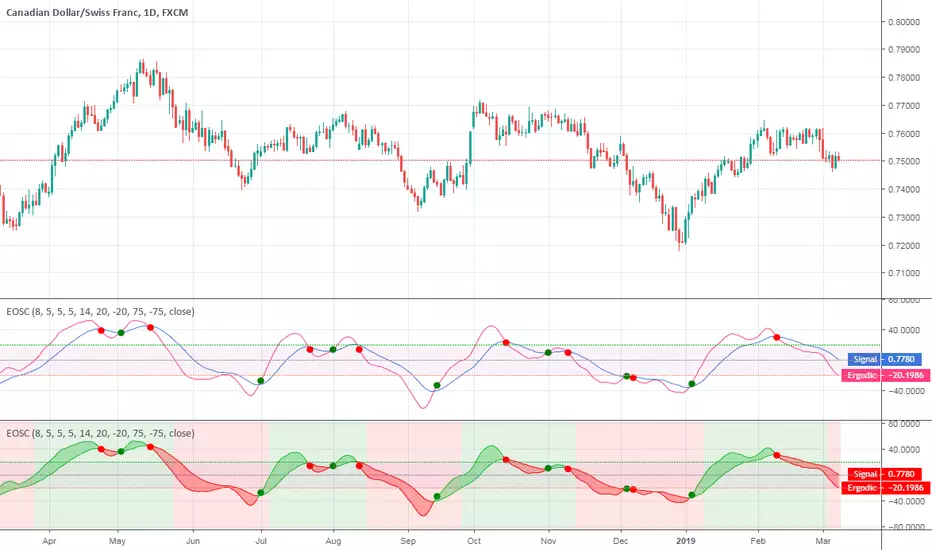
Trader Set - Ergodic MomentumThis is a price momentum indicator that is based on Ergodic formula (TSI), but the formula is tweaked and different types of averaging is allowed. by changing the type of average calculation and some predefined values (totally different from what is suggested by now) we get a nasty indicator that can easily be used both for cycle observation side by side with momentum of the price itself !
Please don't contact me for getting access, these tools are available for my students only. These are part of my "methodology" that I teach. The English version of the website and learning material is under development and I will announce it under each related script when they are ready so that those who are interested can participate in the course.


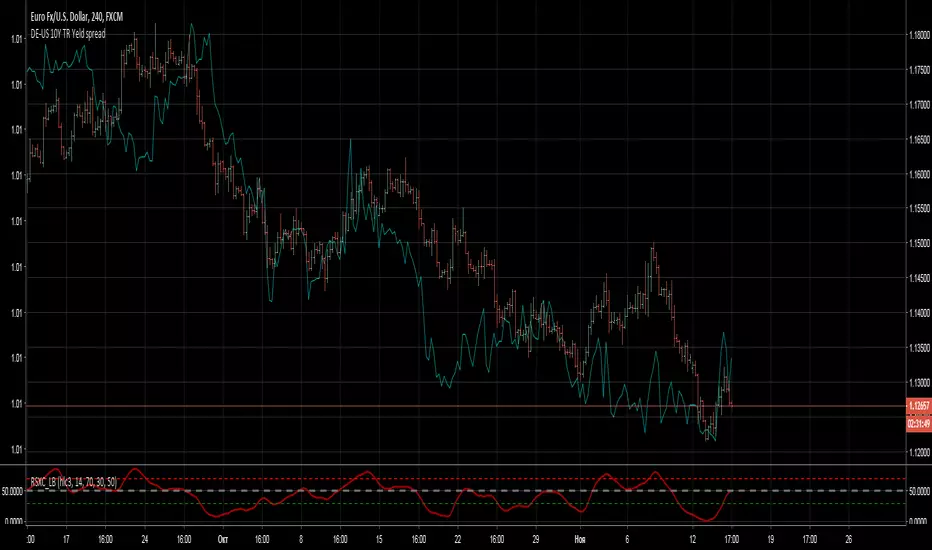
DE and US 10Y bonds spreadDE and US 10Y bonds spread
spread of DE and US 10 year bonds yield
The euro should follow it.
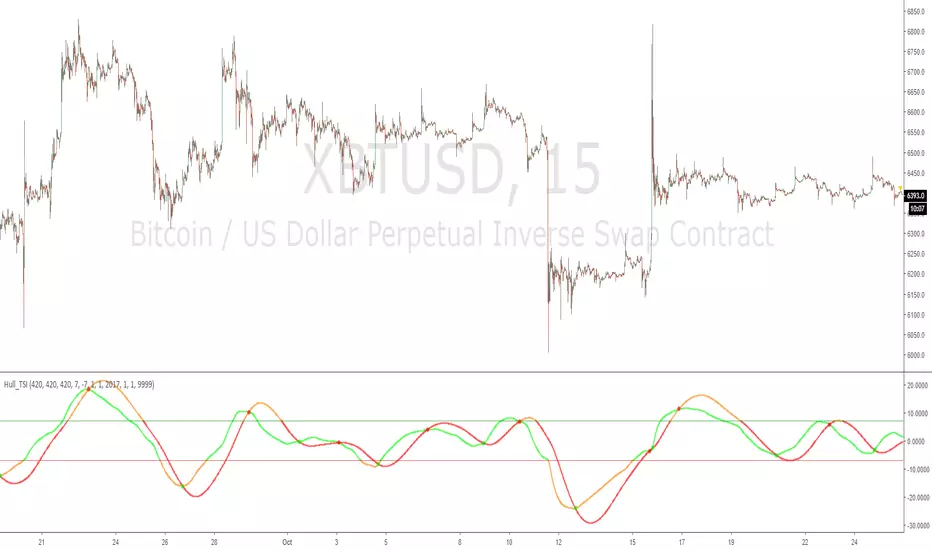
Hull_TSITrue Strength Index, but Exponential Moving Average taken out and replaced with Hull Moving Average
increase the values for increased timeframes i found good on 1hour chart 700,700,700 (instead of 420)
this is the indicator version, hopefully Alert friendly with each plot named
🥢Crypto-Sticks: True Strength Index 1.0 by Cryptorthyhms🥢 Crypto-Sticks™ True Strength Index
A new series of indicators brought to you by Cryptorthyhms...giving you an alternate look at your trusted favorites!
🚀 Indicator Specific Info
Signal Line can be configured in options, but I personally prefer heiken candles to the signal line.
⛔Please remember that you may have to adjust the overbought and oversold levels to suit the volatility of the instrument you are working with. In the future I will implement a feature that does this automatically, but for now its manual.
The OB/OS zones are given in two levels, because often you can find a line of best fit that will hit "small movements" and one that will hit "big movements." In this case I chose 25 and -25 for the small zones. For the bigger zones I chose 50 and -50.
Heiken Ashi candles adds some more clear trend changing points which can be executed at the second candle going in either direction. Other coins/charts will require their own strategy - you could potentially have to tweak that parameter. In this example you would enter on 2nd green, exit on 2nd red. Here is the Heiken Ashi example:
Volume weighting the HA candles adds a different dimension to the indicator which I have to explore more fully. On this particular indicator it adds alot -1.51% more noise, and I dont particularly care for it, but YMMV. Example of what I mean:
💭Please leave me any ideas or feedback you have!
🚫If you use volume weighting you should be on heiken candles.
🚀 Crypto-Sticks General Info
🚧This series isnt polished 100%, and I have some more options I will add in the future. But for now, I want to just release them, as I am not sure when I will have the time to put more work into them (many other big projects I am working on).
📊Its basically reinterpretations of all your favorite indicators. I calculate the values a little bit differently than normal, but the end result is creating a candlestick chart (for the indicator!). Then I added the option to plot them as Heiken Ashi candles to smooth out noise and make signaling easier. I recommend using the indicator on this setting.
🔊Lastly I implemented a Volume Weighting system for them all which simply integrates volume into the formulas for these indicators. For the most part this feature is experimental and doesn't provide huge utility (yet - I have other ways I want to try it as well - just no time). Though on some of the indicators it already shows great promise.
👍Enjoying this indicator or find it useful? Please give me a like and follow! There are many more indicators to be released in this series, not to mention I post crypto analysis and other free indicators regularly.
💬Questions? Comments? Want to get access to an entire suite of proven trading indicators? Come visit us on telegram and chat, or just soak up some knowledge. We make timely posts about the market, news, and strategy everyday. Our community isnt open only to subscribers - everyone is welcome to join.

Price Strength Indicator by drnkThis indicator tries to help you conclude bullish or bearing trends by showing
if the price trend is stronger or weaker than short EMA , compared to a long EMA reference which is zero line.
For now please do not use it below 15 min timeframes.

SMI-VIX-SPY-NDX-Index
This script offers an SMI index of VIX, SPY, and NDX. Rather than overlaying VIX, NDX and SPY on the same chart.
It's much easier to see the correlation between VIX's price and NDX / SPY price in this manner.
Thanks to Buckkets & William Blau for the TSI smoothing method.

Ergodic OscillatorErgodic Oscillator indicator script.
Ergodic Oscillator is based on True Strength Index (TSI) by William Blau.
Bitcoin Momentum TSIChart based on True Strength Indicator
It was improved to show same information as Squeeze Momentum Indicator by LazyBear,
but it seems to have better and quicker response to changes and was tested on Bitcoin mainly.
Enjoy it!
BITFINEX:BTCUSD


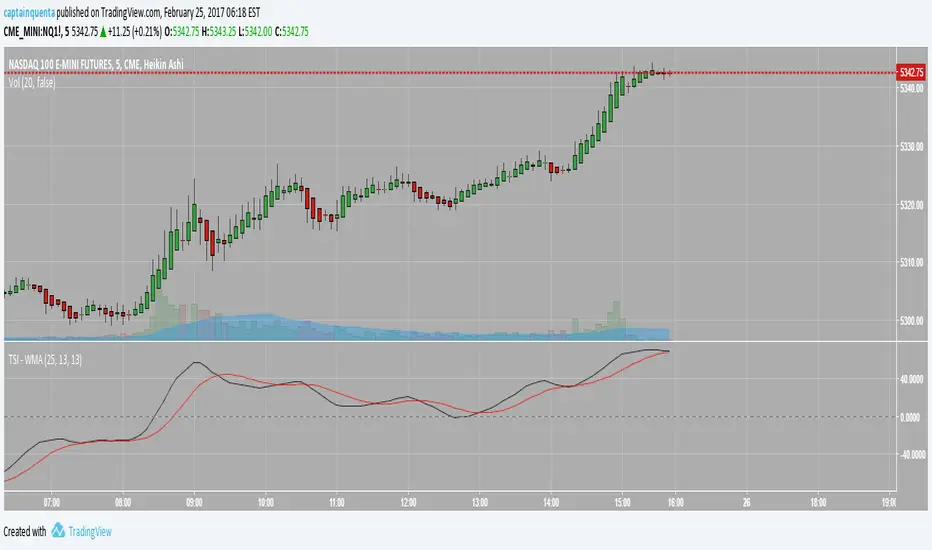
True Strength Indicator - WMAThis is the base Tradingview TSI indicator but with the WMA (weighted moving average) versus the base EMA. CME_MINI:ES1! CME_MINI:NQ1! CBOT_MINI:YM1! CME:E61!
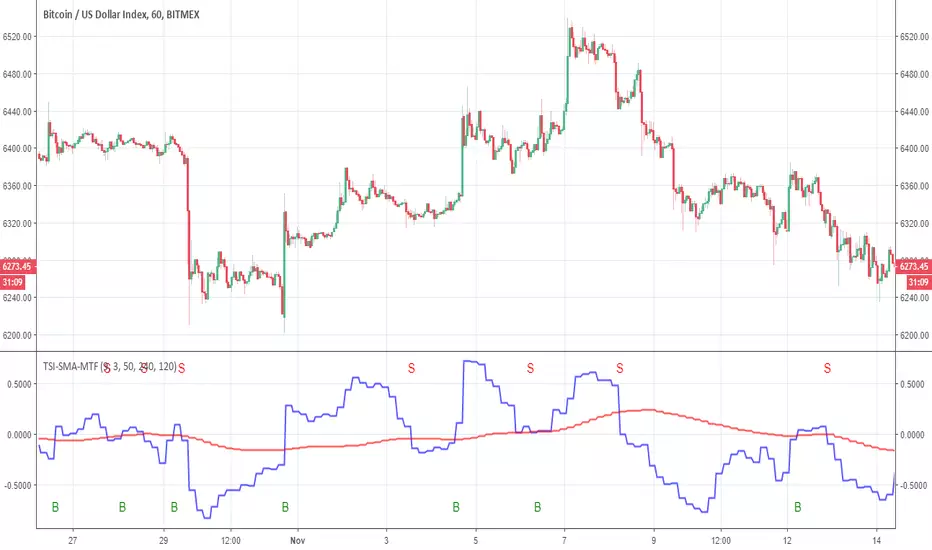
True Strength Indicator MTFHere is an example of a script showing a multi-time frame of TSI.
Chart below compares FX EURUSD Daily TSI to 1H TSI
Here is an updated version
study("True Strength Indicator MTF", shorttitle="TSI MTF")
resCustom = input(title="Timeframe", type=resolution, defval="60" )
long = input(title="Long Length", type=integer, defval=25)
short = input(title="Short Length", type=integer, defval=13)
signal = input(title="Signal Length", type=integer, defval=13)
price = close
double_smooth(src, long, short) =>
fist_smooth = ema(src, long)
ema(fist_smooth, short)
pc = change(price)
double_smoothed_pc = double_smooth(pc, long, short)
double_smoothed_abs_pc = double_smooth(abs(pc), long, short)
tsi_value = 100 * (double_smoothed_pc / double_smoothed_abs_pc)
tsi = security(tickerid, resCustom,tsi_value)
plot(tsi, color=black)
plot(ema(tsi, signal), color=red)
hline(0, title="Zero")

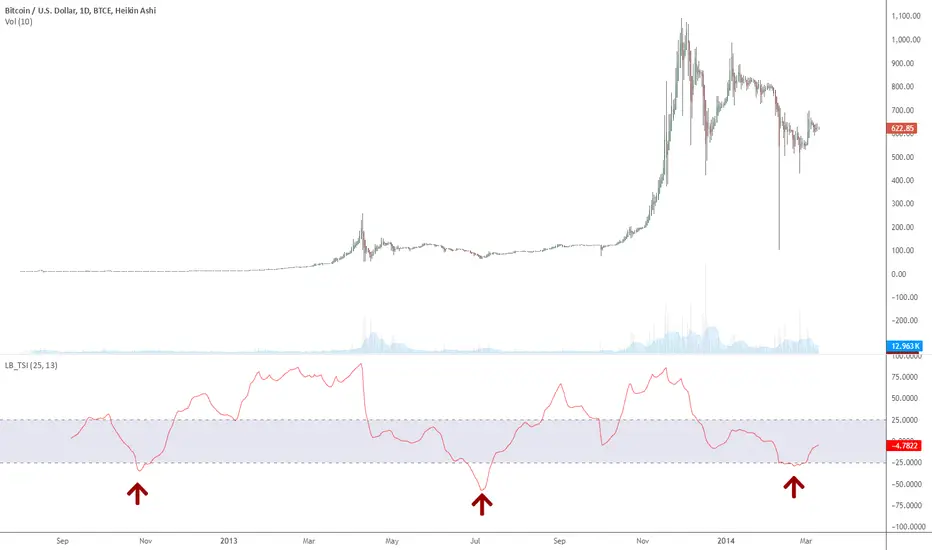
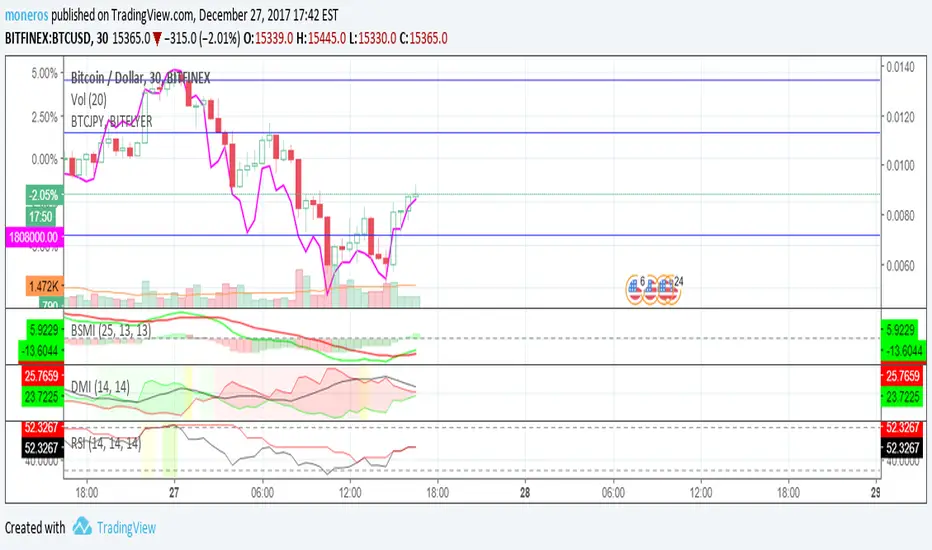
Indicator: True Strength IndexTSI is a "double smoothed" indicator. It is used just like RSI. Overbought and oversold levels differ. They are marked by the indicator.
BTCe shows only 3 oversold conditions so far, the last one being just days ago.