Crypto Grail Crypto Grail — Advanced Multi-Factor Market Intelligence System
Crypto Grail is an institutional-grade multi-factor trading system designed to identify high-probability market conditions through structured trend analysis, volatility modeling, volume diagnostics and candle-level momentum evaluation. The tool operates as an adaptive decision framework that highlights only the most meaningful market alignments while filtering out low-quality noise.
Core Trend Architecture
Crypto Grail builds directional bias using a layered trend framework that integrates:
• EMA21, EMA50 and EMA200 structural mapping
• SuperTrend confirmation
• ADX trend-strength assessment
• EMA-spread evaluation for macro bias
This architecture allows Crypto Grail to distinguish impulsive directional movement from non-directional consolidation phases with high precision.
Quality Scoring Engine
Every potential long or short setup is processed through a quantitative scoring model that evaluates:
• Trend alignment across EMA structure
• SuperTrend directional confirmation
• ADX intensity
• RSI zone positioning
• Candle delta (close-location value)
• Volume deviation relative to baseline
• Volatility state (compressed / normal / explosive)
• Movement percentage vs recent history
• Impulse strength within the current bar
Only setups that satisfy the required quality threshold are eligible for display.
Volatility Regime Modeling
The system dynamically identifies volatility regimes by analyzing:
• ATR-based volatility gradient
• Recent movement amplitude
• Candle impulse relative to volatility envelope
• Expansion and compression cycles
• Chaotic transitions and unstable bursts
This allows the script to identify when the market environment supports sustained follow-through versus when conditions are structurally noisy.
Volume Deviation Framework
Crypto Grail evaluates volume behavior using a rolling baseline to detect:
• Genuine volume expansion
• Volume contraction
• Spike clusters
• Impulse confirmation with volume alignment
Volume states are incorporated directly into the quality-scoring engine, ensuring signals appear only when supported by underlying market participation.
Early & Hybrid Entry Logic
Two optional entry modes expand the system’s capability during dynamic phases:
• Early Mode: identifies strong impulse shifts confirmed by volume + delta
• Hybrid Mode: merges early detection with trend-filtered confirmation
These modes enable more aggressive entries without compromising structural integrity.
Sideways Market Filter
The system includes a consolidation-detection layer that restricts signal generation during:
• Flat ranges
• Low-energy volatility clusters
• ADX-weak trend environments
• EMA compression zones
This significantly increases average signal reliability.
Integrated Trade Simulation Engine
Crypto Grail includes a full visual trade-simulation module featuring:
• ATR-based dynamic stop loss
• Risk-to-reward take profit engine
• Optional ATR trailing stop
• Trade cooldown control
• Complete entry/exit marking
• SL/TP visualization
• Automatic exit-reason tagging
This makes each signal structurally transparent and easy to analyze.
Market Condition Panel
A real-time performance and condition dashboard displays:
• Total trades
• Wins and losses
• Long/short distribution
• Early-entry analytics
• Volume regime
• Volatility regime
• Trend condition
• Current directional bias
This provides ongoing contextual insight during live market conditions.
System Purpose
Crypto Grail is designed as a professional decision-support system that isolates high-probability market structures through multi-layer technical validation. The tool does not guarantee results and should be used with proper risk management.
Volatilità

[CT] Donchian Histogram w/Candle ColorsDonchian Histogram, originally created by RafaelZioni and enhanced with optional price bar coloring, is a momentum-style oscillator that shows where the current close sits inside a dynamic Donchian channel and how that position is evolving over time. The script calculates a rolling high and low over a multi-session lookback period based on your chosen Donchian timeframe, then normalizes the close within that range to create a percentage position between the recent high and low. This normalized value is smoothed with a signal length and plotted as a histogram around a zero line, making it easy to see whether price is pressing toward the upper side of its recent range, the lower side, or oscillating near the middle. Positive values indicate that price is trading closer to the Donchian high, negative values indicate price is closer to the Donchian low, and the magnitude of the histogram reflects how strongly price is favoring one side of the range. The color logic highlights this state visually: stronger positive conditions can be shown in teal, moderate positive conditions in lime, stronger negative conditions in red, and neutral or transitional states in orange. The script also includes an option to color the actual chart candles with the same colors as the histogram, so traders can see Donchian-based pressure directly on the main price chart without constantly looking down at the lower pane. The indicator works on completed bars using standard highest/lowest and moving average functions, so it behaves like a normal oscillator and does not use any lookahead tricks. It is best used as a contextual tool to gauge whether price is pushing to the edges of its recent range or reverting toward balance, and to visually synchronize that information with candle colors when desired.

Regime MapRegime Map — Volatility State Detector
This indicator is a PineScript friendly approximation of a more advanced Python regime-analysis engine.
The original backed identifies market regimes using structural break detection, Hidden-Markov Models, wavelet decomposition, and long-horizon volatility clustering. Since Pine Script cannot execute these statistical models directly, this version implements a lightweight, real-time proxy using realised volatility and statistical thresholds.
The purpose is to provide a clear visual map of evolving volatility conditions without requiring any heavy offline computation.
________________________________________
Mathematical Basis: Python vs Pine
1. Volatility Estimation
Python (Realised Volatility):
RVₜ = √N × stdev( log(Pₜ) − log(Pₜ₋₁) )
Pine Approximation:
RVₜ = stdev( log(Pₜ) − log(Pₜ₋₁), lookback )
Rationale:
Realised volatility captures volatility clustering — a key characteristic of regime transitions.
________________________________________
2. Regime Classification
Python (HMM Volatility States):
Volatility is modelled as belonging to hidden states with different means and variances:
State μ₁, σ₁
State μ₂, σ₂
State μ₃, σ₃
with state transitions determined by a probability matrix.
Pine Approximation (Z-Score Regimes):
Zₜ = ( RVₜ − mean(RV) ) / stdev(RV)
Regime assignment:
• Regime 0 (Low Vol): Zₜ < Zₗₒw
• Regime 1 (Normal): Zₗₒw ≤ Zₜ ≤ Zₕᵢgh
• Regime 2 (High Vol): Zₜ > Zₕᵢgh
Rationale:
Z-scores provide clean statistical boundaries that behave similarly to HMM state separation but are computable in real time.
________________________________________
3. Structural Break Detection vs Rolling Windows
Python (Bai–Perron Structural Breaks):
Segments the volatility series into periods with distinct statistical properties by minimising squared error over multiple regimes.
Pine Approximation:
Rolling mean and rolling standard deviation of volatility over a long window.
Rationale:
When structural breaks are not available, long-window smoothing approximates slow regime changes effectively.
________________________________________
4. Multi-Scale Cycles
Python (Wavelet Decomposition):
Volatility decomposed into long-cycle (A₄) and short-cycle components (D bands).
Pine Approximation:
Single-scale smoothing using long-horizon averages of RV.
Rationale:
Wavelets reveal multi-frequency behaviour; Pine captures the dominant low-frequency component.
________________________________________
Indicator Output
The background colour reflects the active volatility regime:
• Low Volatility (Green): trending behaviour, cleaner directional movement
• Normal Volatility (Yellow): balanced environment
• High Volatility (Red): sharp swings, traps, mean-reversion phases
Regime labels appear on the chart, with a status panel displaying the current regime.
________________________________________
Operational Logic
1. Compute log returns
2. Calculate short-horizon realised volatility
3. Compute long-horizon mean and standard deviation
4. Derive volatility Z-score
5. Assign regime classification
6. Update background colour and labels
This provides a stable, real-time map of market state transitions.
________________________________________
Practical Applications
Intraday Trading
• Low-volatility regimes favour trend and breakout continuation
• High-volatility regimes favour mean reversion and wide stop placement
Swing Trading
• Compression phases often precede multi-day trending moves
• Volatility expansions accompany distribution or panic events
Risk Management
• Enables volatility-adjusted position sizing
• Helps avoid leverage during expansion regimes
________________________________________
Notes
• Does not repaint
• Fully configurable thresholds and lookbacks
• Works across indices, stocks, FX, crypto
• Designed for real-time volatility regime identification
________________________________________
Disclaimer
This script is intended solely for educational and research purposes.
It does not constitute financial advice or a recommendation to buy or sell any instrument.
Trading involves risk, and past volatility patterns do not guarantee future outcomes.
Users are responsible for their own trading decisions, and the author assumes no liability for financial loss.

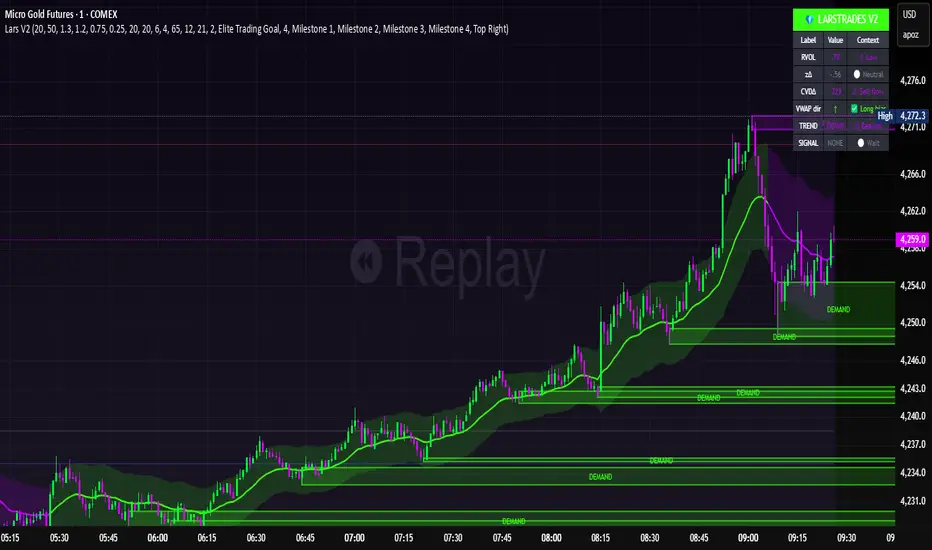
LarsTrades Order Flow ZonesLarsTrades Order Flow Zones
**Important:
-Futures charts only!
-Trust the default settings
-best on 2min or lower timeframe.
-if indicator error in replay mode: exit, ctrl+r - it will reset.
This indicator builds a full trade workflow from raw order flow imbalances. It finds aggressive buy and sell imbalances, promotes the strongest ones into key levels, and manages each level through its entire life cycle. Every level becomes a visual zone on the chart that updates in real time as the market moves.
It is built for short-term traders who want clarity, speed, and a structured decision process based on imbalances instead of guesswork.
If you rely on order flow, imbalance zones, or systematic retest setups, this tool helps you stay consistent and understand the story behind each move.
BT Volume & Volatility Spike
The BT Spike Indicator is aimed at identifying significant spikes in trading volume and price volatility on cryptocurrency or futures charts. It helps traders spot potential reversal or momentum shifts by combining volume analysis with volatility measures. The core logic revolves around detecting when volume surges above its historical average while volatility (measured via ATR) also spikes, signaling unusual market activity that could precede breakouts, pullbacks, or trend changes.
Key features include:
Inputs: Customizable parameters like lookback periods for averages (e.g., 14-bar EMA for volume), ATR length (default 14), and spike thresholds (e.g., volume multiplier of 2x the average).
Visuals: Plots bars or shapes on the chart for spike detections (e.g., green for bullish spikes, red for bearish), with optional alerts for real-time notifications.
Versions: We iterated on it, adding features like better alert conditions and visual signals, but rolled back to a simplified v0.1 for reliability, removing some experimental bug-prone elements like multi-timeframe checks.
BT Spike is a volume & volatility signal meant to alert traders that a move could begin soon, and is a supplementary tool to highlight confluence for existing high-probability setups.

Institutional Orderflow - CT Institutional Orderflow - CT
Overview
This indicator translates VIX futures dynamics into equity price implications, revealing institutional hedging flows and vol pricing's gravitational pull on price, where overpriced volatility signals compression and upside support, while underpriced levels flag expansion risks and downside pressure.
It maps VX deviations to equity levels via historical correlations, anchored by the Bull Bear Bias (BBB), a contango midpoint concept from Matt Cowart at Rocketscooter that sets VX1! fair value as the midpoint between front-month (VX1!) and second-month (VX2!) contracts at monthly rolls.
VX itself quantifies the distribution of options strikes around the underlying price over time, essentially the market's priced-in dispersion of potential outcomes, tied to expiration distance, with volatility inversely proportional to liquidity (fewer transactions in high-vol environments reduce flow and amplify moves).
Interpretation
- VX1! (Front-Month VIX Futures) : Gauges 30-day (±7 days, or 23-37 days to expiration) SPX implied volatility via forward options pricing, capturing medium-term hedging landscapes. Dealers, managing gamma exposure from longer-dated options, hedge by delta-adjusting underlying positions; rising VX1! reflects widening strike distributions (higher fear), prompting protective equity sales that pressure prices; falls toward BBB indicate narrowing distributions (calm), easing hedges and fostering liquidity-driven rallies as transaction frequency rises.
- VIX1D (1-Day Expected Volatility) : Focuses on ultra-short-dated (e.g., 0DTE) P.M.-settled options, measuring immediate strike clustering and gamma intensity near expiration. Closer-dated options heighten dealer sensitivity; spikes signal concentrated hedging bursts, eroding liquidity and fueling intraday volatility with sharp price reversals; declines promote hedging unwind, boosting transaction flow and short-term stability.
- VVIX (Volatility of VIX) : Assesses the implied volatility of VIX options (the "vol of vol"), revealing uncertainty in the vol forecast itself. Elevated VVIX denotes aggressive dealer repositioning across VIX strikes, forecasting erratic VX swings and reduced equity liquidity; subdued levels imply stable distributions, enhancing flow and trend persistence. BBB projections adjust dynamically: low VVIX (<80) constrains overshoots for reversion trades, while high (>110) expands them amid panic hedging.
- BBB Relationship : VX1! above BBB highlights over-distributed (expensive) vol, where dealers unwind hedges as time decays, inverting low liquidity into upside momentum; below BBB warns of under-distributed (cheap) vol, with sparse transactions amplifying expansion risks. Shorter tenors (VIX1D) drive tactical, gamma-fueled price action, contrasting VX1!'s strategic horizon, with VVIX scaling the intensity.
Key Features
- Target Line (Anchored) : Locks at swing violations as enduring support (green, below price) or resistance (red, above), fusing BBB's vol equilibrium with technical anchors to spotlight dealer hedge confluences in strike distributions.
- Magnet Line (Dynamic) : Mirrors live VX1!/BBB shifts, plotting "implied fair" price (blue above for unwind pull; orange below for hedge drag), linking term structure evolution to liquidity-driven gravity.
- Fear Scenario Line : Forecasts price erosion from a 10%+ VX1! surge above BBB, calibrated by VVIX for vol-of-vol amplification, defining dealer panic thresholds where low-liquidity spikes cascade.
- Overshoot Projection : Predicts interim extensions past targets, modulated by VIX1D (near-term gamma flares) and VVIX (distribution uncertainty), relating expiration proximity to heightened swings before time-decay reversion.
- Candle Coloring and SMA Trends : Tracks near-term VX1!/VVIX/VIX1D flows via gradient-colored candles (strong/medium/weak bullish/bearish based on SMA deviations), visualizing realtime options dynamics; green shades signal hedging unwind (rising liquidity, upside bias), red indicates expansion (dealer sales, downside drag). Recommended: VX1! Trend for long-term confluences (Tue-Thu swings); VIX1D Trend or VX1! + VIX1D for short-term (Mon/Fri scalps); add VVIX for regime shifts.
- Swing Boxes : Denote aggressive VX spikes (fear hedging bets) or de-escalations (position realizations), highlighting gamma-driven reversals where dealers rebalance, often preceding liquidity surges or drains in price action.
- Table Metrics : Condenses VX1!/BBB skew, VVIX regimes, VIX1D pulses, and contango cues, correlating options tenor gradients to price flow and hedging mechanics.

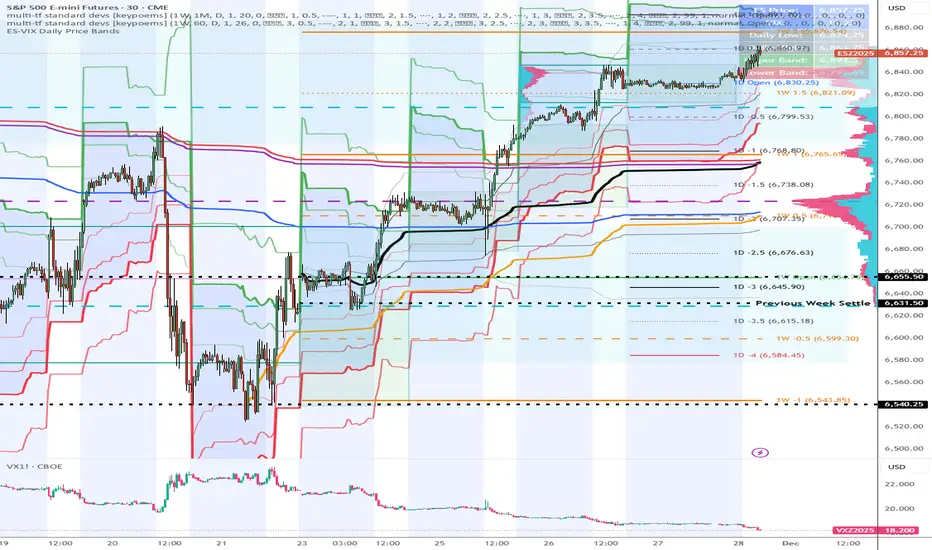
ES-VIX Daily Price Bands - Inner and OuterES-VIX Daily Price Bands
This indicator plots dynamic intraday price bands for ES futures based on real-time volatility levels measured by the VIX (CBOE Volatility Index). The bands evolve throughout the trading day, providing volatility-adjusted price targets.
Formulas:
Upper Band = Daily Low + (ES Price × VIX ÷ √252 ÷ 100)
Lower Band = Daily High - (ES Price × VIX ÷ √252 ÷ 100)
The calculation uses the square root of 252 (trading days per year) to convert annualized VIX volatility into an expected daily move, then scales it as a percentage adjustment from the current day's extremes.
Features:
Real-time band calculation that updates throughout the trading session
Upper band (green) extends from the current day's low
Lower band (red) contracts from the current day's high
Inner upper band (green) at 50% of expected move
Inner lower band (red) at 50% of expected move
Middle Inner upper band (green) at 80% of expected move
Middle Inner lower band (red) at 80% of expected move
Outer upper band (green) at 150% of expected move
Outer lower band (red) at 150% of expected move
Shaded zone between bands for visual clarity
Information table displaying:
Current ES price and VIX level
Running daily high and low
Current upper and lower band values
DTR OI IndicatorThe DTR OI Indicator is a multi-exchange open interest indicator designed for futures traders.
It aggregates OI from multiple exchanges to provide a unified and more reliable view of market positioning.
MAIN FUNCTIONS
• Open Interest Candles
• Open Interest Delta
• Delta × Relative Volume
• Open Interest RSI
• Threshold-based alerts for unusually large OI increases or decreases
• Optional OI EMA smoothing
PROFILE SYSTEM
Includes an OI-based distribution profile similar to a volume profile.
Shows Value Area, POC, and structural nodes based on OI activity within the visible chart range.
WHAT IT HELPS IDENTIFY
• Liquidations and rekt events
• Aggressive long/short buildup
• Position unwinds ahead of reversals
• OI-driven levels of interest
• Momentum confirmation (Delta × rVOL)
• Trend exhaustion (OI RSI)
NOTES
• Works across several exchanges for broader accuracy
• Coin or USD quoting supported
• Profile mode is resource-intensive
• No repainting
Ideal for traders who rely on OI, delta, and market positioning to understand futures flows and liquidity shifts.

FinPile Momentum📊 FinPile Momentum Indicator - User Guide
What Is This Indicator?**
A visual momentum histogram that sits below your price chart, giving you an instant read on whether momentum is bullish, bearish, or neutral. Designed for day traders who need to make fast decisions.
**The Basics: Grade System**
| Grade | Color | Score | What It Means | Action |
|-------|-------|-------|---------------|--------|
| **A+** | Bright Green | +60 to +100 | Everything aligned bullish | ✅ STRONG BUY |
| **A** | Green | +40 to +59 | Strong upward momentum | ✅ BUY |
| **B** | Light Green | +20 to +39 | Mild bullish momentum | ⚠️ MAYBE - be careful |
| **C** | Gray | -19 to +19 | No clear direction | ❌ NO TRADE - wait |
| **D** | Orange | -20 to -39 | Mild bearish momentum | ⚠️ Caution |
| **E** | Red | -40 to -59 | Bearish momentum | 🔴 AVOID longs |
| **F** | Dark Red | -60 to -100 | Strong downward momentum | 🔴 SHORT or stay out |
How to Read the Histogram**
A+ ──────── +60 ────────
A ──────── +40 ──────── ← GREEN ZONE = BUY
B ──────── +20 ────────
═════════ C ════════ 0 ═════════ ← GRAY = NO TRADE
D ──────── -20 ────────
E ──────── -40 ──────── ← RED ZONE = AVOID/SHORT
F ──────── -60 ────────
**Tall green bars above +40** = Strong momentum, look for long entries
**Bars near zero (gray)** = Choppy/no direction, stay out
**Tall red bars below -40** = Bearish momentum, avoid longs or short
### **Warning Symbols**
| Symbol | Meaning | What To Do |
|--------|---------|------------|
| ⚠️ | Exhaustion detected (climax top or bottom) | Expect potential reversal |
| ⚡ | Parabolic move | Too fast, pullback likely |
**The Info Table (Top Right)**
| Row | What It Shows |
|-----|---------------|
| **MOMENTUM** | Current grade (A+, A, B, C, D, E, F) |
| **Score** | Exact number (-100 to +100) |
| **Accel** | 🚀 ACCEL (speeding up) / 💨 DECEL (slowing down) / ➖ STEADY |
| **vs IWM/SPY** | 🟢 OUT (outperforming) / 🔴 UNDER (underperforming) |
| **Mode** | Current smoothing mode and EMA length |
**3 Smoothing Modes**
| Mode | Best For | How It Works |
|------|----------|--------------|
| **⚡ Quick & Clean** (Default) | Scalping, fast day trading | EMA(5) + threshold filter - responsive but no flickering |
| **🐢 Slow & Reliable** | Swing trading, patient traders | Longer lookback + EMA(8) - very smooth, fewer false signals |
| **🎯 Adaptive** | Volatile stocks, changing conditions | Adjusts EMA based on volatility - smart and automatic |
**How to change:** Settings → Smoothing → Smoothing Mode
---
### **Quick Decision Framework**
#### ✅ GO LONG when:
- Grade is **A+ or A** (green histogram above +40)
- Acceleration shows **🚀 ACCEL** (momentum increasing)
- vs IWM shows **🟢 OUT** (beating the market)
- No warning symbols (⚠️ or ⚡)
#### ❌ STAY OUT when:
- Grade is **C** (gray histogram near zero)
- Acceleration shows **💨 DECEL** while in a trade
- Score is bouncing between grades (indecision)
#### 🔴 GO SHORT or EXIT LONGS when:
- Grade is **E or F** (red histogram below -40)
- vs IWM shows **🔴 UNDER** (lagging market)
- Warning symbol ⚠️ appears at highs
---
### **Combining with Price Action**
| Momentum | Price Action | Decision |
|----------|--------------|----------|
| A/A+ rising | Breaking resistance | ✅ Strong buy |
| A/A+ but DECEL | At resistance | ⚠️ Wait for confirmation |
| B flat | Consolidating | ❌ No trade yet |
| C choppy | Ranging | ❌ Stay out |
| D/E falling | Breaking support | 🔴 Short or exit longs |
| F with ⚠️ | Capitulation low | 👀 Watch for bounce |
---
### **Settings Recommendations**
#### For Small Caps / Low Float:
```
Benchmark: IWM
Smoothing Mode: Adaptive
```
#### For Large Caps (AAPL, MSFT, etc.):
```
Benchmark: SPY
Smoothing Mode: Quick & Clean
```
#### For Volatile Meme Stocks:
```
Benchmark: IWM
Smoothing Mode: Adaptive
Adaptive High Vol EMA: 3
```
#### For Smoother Signals:
```
Smoothing Mode: Slow & Reliable
Slow Mode: Lookback Mult: 2.5
Slow Mode: EMA Length: 10
```
---
### **Pro Tips**
1. **Don't fight the color** - If histogram is red, don't go long hoping for reversal
2. **Watch for acceleration changes** - 🚀→💨 while price is rising = momentum fading, tighten stops
3. **Grade + Acceleration combo:**
- A + 🚀 ACCEL = Best setup
- A + 💨 DECEL = Momentum fading, be cautious
- C + 🚀 ACCEL = Potential breakout coming
4. **Use with the main indicator** - Momentum histogram for timing, main FinPile Institutional for levels and full analysis
5. **Background color** - When background turns green/red, momentum is strong (above +40 or below -40)
---
### **Example Trade**
```
You see:
┌─────────────────────────┐
│ MOMENTUM │ A │ ← Good grade
│ Score │ 52 │ ← Solid score
│ Accel │ 🚀 ACCEL │ ← Increasing!
│ vs IWM │ 🟢 OUT │ ← Beating market
│ Mode │ ⚡ QUICK │
└─────────────────────────┘
Histogram: Tall green bar above +40 line
Decision: ✅ LONG - All signals aligned
```
---
### **Quick Reference Card**
```
🟢 GREEN (A+/A) + 🚀 ACCEL + 🟢 OUT = BUY
⚪ GRAY (C) = NO TRADE
🔴 RED (E/F) + 💨 DECEL + 🔴 UNDER = SHORT/EXIT
⚠️ WARNING = Expect reversal

MFM - Light Context HUD (Free)Overview
MFM Light Context HUD is the free version of the Market Framework Model. It gives you a fast and clean view of the current market regime and phase without signals or chart noise. The HUD shows whether the asset is in a bullish or bearish environment and whether it is in a volatile, compression, drift, or neutral phase. This helps you read structure at a glance.
Asset availability
The free version works only on a selected list of five assets.
Supported symbols are
SP:SPX
TVC:GOLD
BINANCE:BTCUSD
BINANCE:ETHUSDT
OANDA:EURUSD
All other assets show a context banner only.
How it works
The free version uses fixed settings based on the original MFM model. It calculates the regime using a higher timeframe RSI ratio and identifies the current phase using simplified momentum conditions. The chart stays clean. Only a small HUD appears in the top corner. Full visual phases, ratio logic, signals, and auto tune are part of the paid version.
The free version shows the phase name only. It does not display colored phase zones on the chart.
Phase meaning
The Market Framework Model uses four structural phases to describe how the market behaves. These are not signals but context layers that show the underlying environment.
Volatile (Phase 1)
The market is in a fast, unstable or directional environment. Price can move aggressively with stronger momentum swings.
Compression (Phase 2)
The market is in a contracting state. Momentum slows and volatility decreases. This phase often appears before expansion, but it does not predict direction.
Drift (Phase 3)
The market moves in a more controlled, persistent manner. Trends are cleaner and volatility is lower compared to volatile phases.
No phase
No clear structural condition is active.
These phases describe market structure, not trade entries. They help you understand the conditions you are trading in.
Cross asset context
The Market Framework Model reads markets as a multi layer system. The full version includes cross asset analysis to show whether the asset is acting as a leader or lagger relative to its benchmark. The free version uses the same internal benchmark logic for regime detection but does not display the cross asset layer on the chart.
Cross asset structure is a core part of the MFM model and is fully available in the paid version.
Included in this free version
Higher timeframe regime
Current phase name
Clean chart output
Context only
Works on a selected set of assets
Not included
No forecast signals
No ratio leader or lagger logic
No MRM zones
No MPF timing
No auto tune
The full version contains all features of the complete MFM model.
Full version
You can find the full indicator here:
payhip.com
More information
Model details and documentation:
mfm.inratios.com
Disclaimer
The Market Framework Model (MFM) and all related materials are provided for educational and informational purposes only. Nothing in this publication, the indicator, or any associated charts should be interpreted as financial advice, investment recommendations, or trading signals. All examples, visualizations, and backtests are illustrative and based on historical data. They do not guarantee or imply any future performance. Financial markets involve risk, including the potential loss of capital, and users remain fully responsible for their own decisions. The author and Inratios© make no representations or warranties regarding the accuracy, completeness, or reliability of the information provided. MFM describes structural market context only and should not be used as the sole basis for trading or investment actions.
By using the MFM indicator or any related insights, you agree to these terms.
© 2025 Inratios. Market Framework Model (MFM) is protected via i-Depot (BOIP) – Ref. 155670. No financial advice.

2t's MA 50, MA 150, ATRThis indicator displays three key technical signals on the chart:
SMA 50 – Short-term trend direction
SMA 150 – Medium-term trend direction
ATR – Market volatility (Average True Range)
Line colors and lengths can be customized in the settings.
The ATR is plotted on the same chart for quick volatility reference without needing a separate panel.
This tool is designed for traders who want a clean, lightweight view of trend strength and volatility in a single indicator.

AIO+TX by Lucky-cbtThis system is not built on ordinary moving averages or textbook filters. It is a multi‑dimensional mathematical engine that interprets market rhythm through dynamic ratios, geometric alignments, and adaptive oscillations.
📐 Geometric Layering: The script measures the relative curvature of price trajectories against long‑term baselines, using proportional spacing rules derived from harmonic progressions.
🔄 Cross‑Dimensional Ratios: Instead of simple crossovers, it applies ratio‑based transitions where short‑term momentum vectors intersect with deep‑time anchors, producing signals only when multiple dimensions align.
📊 Volumetric Amplification: Market participation is filtered through a power‑law multiplier, ensuring that only statistically significant surges are considered valid.
🌫️ Cloud Dynamics: A dual‑span envelope evaluates whether price is floating above or below its equilibrium surface, acting as a probabilistic barrier rather than a fixed line.
🎯 Directional Memory: The algorithm embeds a trend memory function, smoothing directional impulses into a weighted regime that flips only after confirmation thresholds are satisfied.
🌀 Oscillatory Balance: Instead of naming RSI or CCI, the system checks whether the oscillatory balance remains within a bounded corridor, rejecting extremes that would otherwise distort the signal.
⚡ Adaptive Stretch: Volatility is normalized through a stretch‑compression model, where expansion and contraction are raised to fractional exponents, ensuring resilience across market conditions.
🔒 Confluence Gate: No single metric is decisive. Only when all mathematical gates unlock simultaneously does the system permit a directional flip, marking the chart with precision labels.

@Unwind Pressure Detector - AUDITED v3.0SQUEEZE → UNWIND PRESSURE DETECTOR v3.0
The first indicator that not only finds oversold squeezes… but tells you exactly when the move is exhausting and it’s time to take profits.
Fully audited, clean Pine Script v6, zero repainting, zero lag tricks.
WHAT IT DOES
• Detects high-probability squeeze setups (RSI + Volume + VIX + Trend confluence)
• Scores pressure from 0–115 with dynamic sensitivity (Low to Extreme)
• Identifies CRITICAL zones where explosive moves are most likely
• Most importantly → flags the UNWIND when trapped shorts are finally covering and the rally is running out of fuel (perfect profit-taking signal)
FEATURES
• Real-time pressure dashboard (top-right)
• Color-coded background zones (Critical = red, High = orange)
• Smart anti-spam labels with ATR offset
• Three alert conditions:
→ Squeeze Setup
→ Critical Squeeze
→ Unwind / Take Profit
• Works on all markets & timeframes (stocks, forex, crypto, futures)
WHY THIS VERSION IS DIFFERENT
- v3.0 completely rewrote the unwind logic (now requires rally + sharp pressure drop)
- No false unwinds during strong trends
- Built for real trading, not just pretty screenshots
100% Open Source • Fully commented • Free to modify & rep, I want this in the public library forever.
Created with love for the TradingView community
Drop a ♥ and follow if you find it useful!
#squeeze #ttmsqueeze #unwind #volatility #vix #takeprofits #smartmoney

ES-VIX Daily Price Bands - Inner bands (80% and 50%)ES-VIX Daily Price Bands
This indicator plots dynamic intraday price bands for ES futures based on real-time volatility levels measured by the VIX (CBOE Volatility Index). The bands evolve throughout the trading day, providing volatility-adjusted price targets.
Formulas:
Upper Band = Daily Low + (ES Price × VIX ÷ √252 ÷ 100)
Lower Band = Daily High - (ES Price × VIX ÷ √252 ÷ 100)
The calculation uses the square root of 252 (trading days per year) to convert annualized VIX volatility into an expected daily move, then scales it as a percentage adjustment from the current day's extremes.
Features:
Real-time band calculation that updates throughout the trading session
Upper band (green) extends from the current day's low
Lower band (red) contracts from the current day's high
Inner upper band (green) at 50% of expected move
Inner lower band (red) at 50% of expected move
Middle Inner upper band (green) at 80% of expected move
Middle Inner lower band (red) at 80% of expected move
Shaded zone between bands for visual clarity
Information table displaying:
Current ES price and VIX level
Running daily high and low
Current upper and lower band values

ES-VIX Daily Price Bands - Inner bandsES-VIX Daily Price Bands
This indicator plots dynamic intraday price bands for ES futures based on real-time volatility levels measured by the VIX (CBOE Volatility Index). The bands evolve throughout the trading day, providing volatility-adjusted price targets.
Formulas:
Upper Band = Daily Low + (ES Price × VIX ÷ √252 ÷ 100)
Lower Band = Daily High - (ES Price × VIX ÷ √252 ÷ 100)
The calculation uses the square root of 252 (trading days per year) to convert annualized VIX volatility into an expected daily move, then scales it as a percentage adjustment from the current day's extremes.
Features:
Real-time band calculation that updates throughout the trading session
Upper band (green) extends from the current day's low
Lower band (red) contracts from the current day's high
Inner upper band (green) at 50% of expected move
Inner lower band (red) at 50% of expected move
Shaded zone between bands for visual clarity
Information table displaying:
Current ES price and VIX level
Running daily high and low
Current upper and lower band values

kira 3 mins scalp3-min Strict Scalping HA + PSAR + RSI + 1:2 RR
Purpose: 3-minute scalping using Heikin Ashi candles, Parabolic SAR, and RSI with strict entry rules and automatic 1:2 risk:reward.
Logic:
Entry: 3rd consecutive HA candle with no wick (bullish for buy, bearish for sell)
Filters:
Buy: PSAR below candle + RSI > 50
Sell: PSAR above candle + RSI < 50
SL & TP:
Buy SL: lowest low of last 3 candles
Buy TP: entry + 2×(entry−SL)
Sell SL: highest high of last 3 candles
Sell TP: entry − 2×(SL−entry)
Signals: Triangles plotted on chart; alerts available
Use: Apply on 3-min chart. Enter on 3rd candle meeting conditions; follow SL/TP for 1:2 RR.

ES-VIX Daily Price BandsES-VIX Daily Price Bands
This indicator plots dynamic intraday price bands for ES futures based on real-time volatility levels measured by the VIX (CBOE Volatility Index). The bands evolve throughout the trading day, providing volatility-adjusted price targets.
Formulas:
Upper Band = Daily Low + (ES Price × VIX ÷ √252 ÷ 100)
Lower Band = Daily High - (ES Price × VIX ÷ √252 ÷ 100)
The calculation uses the square root of 252 (trading days per year) to convert annualized VIX volatility into an expected daily move, then scales it as a percentage adjustment from the current day's extremes.
Features:
Real-time band calculation that updates throughout the trading session
Upper band (green) extends from the current day's low
Lower band (red) contracts from the current day's high
Shaded zone between bands for visual clarity
Information table displaying:
Current ES price and VIX level
Running daily high and low
Current upper and lower band values

@Complete Squeeze Cycle Detector v2.0 FINALDescription:
The Complete Squeeze Cycle Detector identifies and tracks the full lifecycle of squeeze formations, from pre-squeeze consolidation through active squeeze periods to squeeze completion. The indicator systematically detects the characteristic conditions that precede and accompany squeeze events.
The indicator monitors multiple factors associated with squeeze development including:
• Volatility compression relative to recent volume activity
• Elevated market stress conditions as measured by VIX levels
• Momentum compression through rate of change measurements across multiple time periods
• Alignment of multiple exponential moving averages indicating consolidation
The squeeze cycle is classified into three distinct phases: Pre-Squeeze Setup, Active Squeeze, and Squeeze Complete. Each phase is identified based on threshold levels of multiple compression metrics, with adjustable sensitivity settings to control the strictness of detection.
The indicator provides visual identification of each phase through labels, background coloring, and an optional dashboard, allowing users to distinguish between the preparation phase where volatility contracts, the active squeeze phase where compression reaches critical levels, and the completion phase where the squeeze releases and directional movement resumes.
This systematic approach enables users to identify squeeze formations throughout their complete development cycle rather than focusing only on the breakout phase.

Santhosh Zero lag Trend change AlertThis indicator alert whenever these is a change in trend direction. Change input to match with your Asset/Index. This works well in all time frame, I recommend this for Scalping and Position trading

ES-VIX Expected Daily MoveThis indicator calculates the expected daily price movement for ES futures based on current volatility levels as measured by the VIX (CBOE Volatility Index).
Formula:
Expected Daily Move = (ES Price × VIX Price) / √252 / 100
The calculation converts the annualized VIX volatility into an expected daily move by dividing by the square root of 252 (the approximate number of trading days per year).
Features:
Real-time calculation using current ES futures price and VIX level
Histogram visualization in a separate pane for easy trend analysis
Information table displaying:
Current ES futures price
Current VIX level
Expected daily move in points
Expected daily move as a percentage

Elite Energy Alpha MatrixThe Elite Energy Alpha Matrix indicator provides comprehensive analysis of the energy sector, focusing on the complex relationships between crude oil benchmarks, natural gas, energy-related ETFs, and the performance dynamics across various energy sub-sectors.
The indicator tracks multiple energy price data sources including WTI crude oil, Brent crude, natural gas, and oil ETFs, enabling detailed monitoring of price relationships and divergences within the energy complex.
Key analytical components include:
• Correlation analysis between major energy benchmarks
• Multi-timeframe examination of energy price relationships
• Sector rotation detection within energy sub-sectors including integrated oil majors, exploration and production companies, oilfield services, refiners, pipelines, and renewable energy
• Performance monitoring across different energy market segments
The indicator provides a structured framework for analyzing the internal dynamics of the energy sector, identifying periods of alignment or divergence between different energy price instruments, and monitoring relative performance across energy sub-sectors.
This approach enables users to assess the consistency of price movements across the energy complex and identify situations where different components of the energy market are exhibiting divergent behavior, which can provide insight into the underlying drivers affecting the sector.2.6s

Dynamic Ratchet Trend Strategy [VIX Filter]Overview This strategy is a long-only trend-following system designed to capture major market moves while strictly managing downside risk through a state-machine based "Ratchet" exit logic. It incorporates a volatility filter using the CBOE VIX index to stay out of (or exit) the market during high-stress environments.
Key Features
1. Multi-Condition Entries The strategy looks for momentum shifts and trend breakouts using four Simple Moving Averages (25, 50, 100, 200).
Momentum Cross: SMA 25 crossover above SMA 50.
Trend Breakouts: A specific "3-Bar Breakout" logic above the SMA 50, 100, or 200. This requires the price to hold above the SMA for 3 consecutive bars after being below it, reducing false signals compared to simple closes.
2. VIX Volatility Filter Before entering any trade, the script checks the CBOE:VIX.
Filter: If VIX is above the threshold (default 32), new entries are blocked.
Panic Exit: If you are in a position and the VIX spikes above the threshold, the strategy executes an immediate "Panic Exit" to preserve capital during market crashes.
3. The "Ratchet" Exit System (3 Stages) Unlike a standard trailing stop, this strategy uses a 3-stage dynamic exit mechanism that tightens as profits grow:
Stage 0 (Initial Risk): Standard percentage-based Stop Loss from the entry price.
Stage 1 (The Lock-In): Triggered when profit hits 10% (configurable).
Unique Logic: Instead of trailing from the highest high, the stop is calculated based on the price at the exact moment this stage was triggered. It "steps up" once and holds, securing the initial move without being prematurely stopped out by normal volatility.
Stage 2 (Trailing Mode): Triggered when profit hits 15% (configurable).
The strategy switches to a classic Trailing Stop, following the percentage distance from the Highest High.
4. Emergency Backup A "Dead Cross" (SMA 25 crossing under SMA 50) acts as a final fail-safe to close positions if the trend reverses completely before hitting a stop.
Settings & Inputs
SMAs: Customize the lengths for all four moving averages.
VIX Filter: Toggle the filter on/off and set the panic threshold.
Exit Logic: Fully customizable percentages for Initial SL, Stage 1 Trigger/Distance, and Stage 2 Trigger/Trailing Distance.
Disclaimer This script is for educational purposes only. Past performance is not indicative of future results. Always manage your risk appropriately.

Market Regime Storyline v6Title: Market Regime Storyline
Description:
The Market Regime Storyline indicator identifies and displays the current market condition or "regime" through a comprehensive framework that combines trend direction and volatility analysis.
The indicator classifies market conditions into four distinct regimes:
Uptrend: Price is above the trend moving average with short-term momentum confirming upward movement
Downtrend: Price is below the trend moving average with short-term momentum confirming downward movement
Squeeze: Low normalized volatility indicating a period of consolidation and potential impending breakout
Chop: Sideways, range-bound price action with no clear directional bias and normal volatility
Key features include:
• Clear identification of the dominant market regime with visual background coloring
• Continuous display of the current regime and normalized volatility level in the upper-left corner
• Labels marking transitions between different market regimes
• Subtle background coloring that provides visual context without visual clutter
The indicator combines trend determination (using an exponential moving average and momentum confirmation) with volatility normalization to provide a complete picture of the prevailing market environment. This regime identification helps traders adapt their strategies to the current market conditions, whether trending, consolidating, or ranging.
This approach recognizes that different trading strategies perform optimally in different market environments, allowing users to adjust their approach based on whether the market is exhibiting trending behavior, preparing for a volatility expansion, or trading in a range-bound manner.
Category: Trend Analysis
Tags: Market Regime, Trend Identification, Volatility Squeeze, Market Conditions, Consolidation, Trending, Range-Bound, Regime Change, Volatility Normalization, Market Environment
Recommended Publishing Information:
The Market Regime Storyline indicator is designed to provide traders with a clear, unambiguous identification of the prevailing market condition. By categorizing market behavior into distinct regimes, the indicator enables users to:
Determine whether the market is exhibiting directional trending behavior that favors trend-following strategies
Identify periods of low volatility consolidation (squeezes) that often precede significant directional moves
Recognize range-bound, non-directional market conditions where mean reversion or breakout strategies may be more appropriate
The indicator uses a combination of trend filtering through a primary moving average and momentum confirmation, along with normalized volatility measurement, to provide a robust regime classification system. The normalized volatility component helps distinguish between true consolidation periods (squeezes) and typical sideways movement (chop), providing additional context for anticipating potential changes in market behavior.
This regime-based approach acknowledges the reality that all trading strategies do not perform equally well in all market environments, and provides a framework for adapting trading approaches to the prevailing market conditions.
The combination of these classification elements and the clear visual presentation makes this indicator particularly useful for traders who need to adjust their strategy depending on whether the market is in a trending, consolidating, or range-bound state.
