2-Day Volume Weighted Average Price (VWAP)This indicator extends TradingView’s built-in VWAP by calculating a volume-weighted average price over a continuous two-day window (yesterday + today), anchoring VWAP at the start of yesterday’s session and carrying it through to today’s close, but only plotting the segment that falls within the current trading session—yesterday’s data feeds into the calculation to ensure today’s VWAP reflects the prior session’s volume and price action, while the line drawn on your chart always begins at today’s session open.
Standard Deviation Bands: Optional ±1σ, ±2σ, and ±3σ envelopes, exactly as in the default VWAP, but based on the rolling two-day data.
Volumeanalysis

Project SynthIntroducing Project Synth !
Inspired by Pace of Tape and Cumulative Delta I created Project Synth in order to aggregate volume flow data across multiple marketsfor two primary reasions:
Traditional orderflow tools are not available on Tradingview. My script attempts to bring an original; calculus-based approach to creating not only an alternative for traditional orderflow tools, but also a more accurate one.
In order to detect genuine buying and selling pressure that cannot be easily manipulated. I did this because while I've always enjoyed concept behind both of those tools, I did not think they captured enough data to be useful. By analyzing assets that move together (positive correlation) and assets that move inversely (negative correlation), my system aims to fix the fundamental problems with those indicators and create an objective view of market sentiment based on aggregate orderflow.
Some more detailed explanations (using QQQ and SQQQ as an example):
Inverse Market Dynamics (QQQ vs SQQQ):
In an inverse market like SQQQ, aggressive buyers hit the ask when they expect the underlying (QQQ) to fall, while passive buyers wait on the bid hoping for cheaper inverse exposure. When QQQ rallies, SQQQ sees aggressive selling (people dumping their bearish bets) hitting bids, while passive sellers sit on the ask hoping to exit at better prices. The aggression flows opposite to the underlying market direction.
Why Utilizing Both Markets Provides A More Accurate Delta:
Watching both QQQ and SQQQ gives cross-validation - real buying pressure in QQQ should coincide with selling pressure in SQQQ. If you see buying in QQQ but also buying in SQQQ, that's a conflicting signal suggesting the move might be artificial or driven by other factors. The inverse relationship acts as a confirmation filter, making false signals much harder to generate.
Multiple Markets = Authentic Pressure:
The more unique, important markets you track, the harder it becomes to create fake delta moves. Real institutional buying/selling pressure affects multiple correlated assets simultaneously in predictable patterns - you can't easily manipulate tech stocks, treasury bonds, VIX, and currency pairs all at once to create a false signal. Each additional market acts as a fraud detection layer, ensuring the delta measurement reflects genuine ecosystem-wide buying and selling pressure rather than isolated manipulation or noise.
My Suggestions For Usage:
In order to keep the explanation simple and short for now, I suggest using it just like a cumulative delta indicator. For example: let's say you were watching CME_MINI:ES1! , and you had a resistance level at 6000. When the price reaches your resistance level, you would be looking for a significant divergence between price and Delta. Price : rising, Delta : falling. This means that even though the price was going up, strong and aggressive sellers are jumping in more and more, this can be used as a confirmation tool for a resistance level.
Notes For Moderators, Authors and Users:
Firstly, to the best of my knowledge, I have not been able to find many tools built around the concept of cumulative delta or pace of tape. While I know there are a couple projects, none to the magnitude of synthetically recreating these tools via an algorithm designed around basic calculus principles. While tools like Volume Delta are built in, they do not attempt to capture an accurate picture of aggregated orderflow from what I understand.
Secondly, it needs to be noted that tool aims to create an approximation of buying and selling pressure. To my knowledge it is not possible to create an accurate full picture, at least not within the limitations of Tradingview.

Visual ProwessVisual Prowess: Ultimate Visual of Price Action Indicator
Overview
Visual Prowess is a Pine Script indicator that integrates Trend, Momentum, Strength/Weakness, Money Flow, and Volatility into a single, intuitive interface. Scaled from 0 to 100, it provides traders with clear bullish (>50) and bearish (<50) zones. Visual Prowess is made up of several data components which will be explained below. All these components have custom thresholds that lead to Green Dot Buy Signals and Red Dot sell signals. Designed for multi-timeframe analysis, it helps traders anticipate market moves with precision seeing behind the scenes of price action.
The fundamental inputs of price action are made up of different variables -- the components of Trend Strength, Volatility, Momentum, Money Flow/Volume and Overbought/Oversold. These are very important inputs market makers use. From what I've learned in my trading journey (always still learning), this is the data I value most important. This is why I combined all these components into one indicator.....to be an ultimate visual—this extrapolation of different pieces of data is the Visual Prowess.
What It Does
Visual Prowess combines five key market factors into a unified score (0-100) to assess market conditions by examining the price action like an x-ray aka Visual Prowess:
• Trend Direction & Strength (Green and Red Wave) : Identifies bullish (green clouds) or bearish (red clouds) trend. This data is designed to illustrate the trend by the color, and its strength by the height (score).
How it is Calculated = Data is derived from price action-- comparing the current and previous price highs and lows to measure the strength of upward (+) or downward (-) price movements, smoothed over a period and expressed as a percentage of the price range.
• Momentum (Blue and White Wave): Tracks price acceleration via a custom momentum oscillator, displayed as blue (positive) or white (negative) waves.
How it is Calculated = Data is calculated by subtracting a longer-term exponential moving average from a shorter-term exponential moving average to measure momentum and trend direction. Momentum strength is measured by height on 0-100 score, and color dictates the trend-- Blue up, White down.
• Strength Index (Purple Line): Measures overbought/oversold conditions with a normalized index, derived from price deviation.
How it is Calculated = Strength Index is calculated by comparing the average of price gains to the average of price losses over a specified period, expressed as a value between 0 and 100 to measure momentum and identify overbought or oversold conditions.
• Money Flow: Monitors capital inflows and outflows using a modified Money Flow Index, shown as green (buying) or red (selling) circles.
How it is Calculated = The Money Flow is calculated by using price and volume data to measure buying and selling pressure, comparing positive and negative money flow over a specified period to produce a value between 0 and 100, indicating overbought or oversold conditions and more importantly where the money is moving, + or -.
• Volatility: Gauges market volatility, marked by colored crosses (blue for low, red for high). Blue illustrates low volatility which is key for big moves either + or -; red to illustrate when price action is extremely overheated either + or -.
How it is Calculated = The volatility is calculated by the creator of the BBWP The_Caretaker. This excellent work is calculated using the width of the iconic indicator the Bollinger Bands (the difference between the upper and lower bands divided by the middle band (the moving average), expressed as a percentage to show how volatile the price is relative to its recent average.
Originality
Unlike traditional multi-indicator dashboards, Visual Prowess uses a combination of specific open-source indicators which I believe to be the most important inputs in price action-- trend, momentum, strength, money flow, and volatility into an all-in-one visual ratioed on a 0-100 scale. This unique synthesis of data reduces noise, prioritizes signal alignment, and a look behind the scenes of price action to see deeper into the movement – This combination of indicators has custom thresholds, when these components in alignment with each other hit certain parameters; it leads to key custom price action signals -- Green Dot Buy and Red Dot Sell signals.
There is also a bonus indicator….. a Yellow Triangle. When you see this, it is rare and strong. It only prints when strength index reaches extreme lows at the same time volatility reaches extreme highs…. It then waits to print the yellow triangle upon a third condition= which is price action is back in bullish/positive zone. This Yellow triangle is meant to be strong reversals of Macro Trend lows.
How to Use the Visual Prowess Components:
• Add to Chart: Apply Visual Prowess to any timeframe (recommended: higher timeframes 12H, 1D, 2D, 3D for optimal signals).
• Interpret Zones: Values >50 indicate bullish conditions (green background); <50 signal bearish conditions (red background).
Wait for Green Dot Buy signal for buys and Red Dot Sell signals for sells. One can read each component individually to gauge the price action and predict before the buy signal prints; all of those components merged together is what leads to the buy and sell signals. The story of what’s to come can be seen at lower timeframes before the higher timeframes print, that is a key way to gauge projections of bull or bear prints to come.
HOW TO READ EACH DATA COMPONENT
TREND CLOUDS: Green/red clouds show trend direction; vivid colors tied to number/ score on the 0-100 scale indicate strength of the trend.
Bull Conditions
Green cloud illustrates the trend is bullish. The height is correlated to the trend’s strength—this height is also aligned with colors, more transparent green is weak, then it gets more opaque being medium strength, and the most vibrant is the strongest. How to ride the bull condition is by seeing this transformation of trend get from weak to strong, until it tops out and the wave points down losing strength which alludes to the bear condition.
Bear Conditions
Vice versa with the bear condition. Different shades of red tie into the strength of the bear trend. How to read when things are about to get bearish, is by seeing bull trend shift levels of strength (Example- medium to weak). This transition of bull strength getting weaker is the start, once it gets to weak bear it has commenced until bearish strength tops out before it begins to get weaker leading to the next bull phase.
MOMENTUM WAVES: Blue waves above 50 suggest bullish momentum; white waves below 50 warn of bearish shifts.
Bull Conditions
Good to look at flips of white wave to blue in bearish zones to see the tide turning= guaranteed bullish when safely gets above and holds above 50 zone.
Bear Conditions
Vice versa for Bearish side of this momentum wave being blue wave turning white in bullish zone aiming down to break below 50 zone to confirm bearish descent.
STRENGTH INDEX: Values >80 indicate overbought; <20 suggest oversold. Look for “Bull” or “Bear” labels for divergences.
Bull Conditions
Above 50 level is key, so seeing price action break from below 50 to above 50 is strong buy condition until it gets overbought.
Bear Conditions
Once conditions are too overbought and falling making lower lows (especially when price action is climbing or staying sideways) it is indicating strength is getting weaker. When this indicator fights 50 level and breaks down below 50 level bearish conditions are coming until it gets to an oversold level.
MONEYFLOW: Green circles signal buying pressure; red circles indicate selling.
Bull Conditions
Green circles show money flow is positive so that’s a good sign of upward price action to come, and again above 50 level is bullish conditions
Bear Conditions
Red circles show money flow is negative so that’s a bad sign of price action to come, pointing down and breaking below 50 level is no good. It can have corrections in bullish scenario keep in mind seeing red doesn’t mean trend is over z9could be in higher low scenario).
VOLATILITY: Blue crosses (<25% volatility) suggest breakout potential; red crosses (>75%) warn of overheated markets.
Bull Conditions
This is a very important indication. Big volatile moves can move either direction + or -. When all other components look positive/bullish and this is signalling blue crosses it means a big move is coming and will most likely be in the upward direction –If all other components align/lean bullish.
Another bullish scenario is when price action is down large and red crosses are forming. This indicates that the downward move is overheated (red x’s are rare). This extremely oversold condition can be great buying opportunities when volatility is hot printing red x’s.
Bear Conditions
When all other components look negative/bearish and this is signalling blue crosses it means a big move is coming and will most likely be in the downward direction –If all other components align/lean bearish.
Another bearish scenario is when price action is up large and red crosses are forming. This indicates that the upward move is overheated (red x’s are rare). This extremely overbought condition can be great selling opportunities when volatility is hot printing red x’s.
*****All these components in alignment of hitting each pertaining important threshold--is what prints the green dot and sell signals to trade by. It is not black and white; each component has a sweet spot fine tuned to be triggered through analysis of what is happening individually to each component and how it is reacting to the price action data.
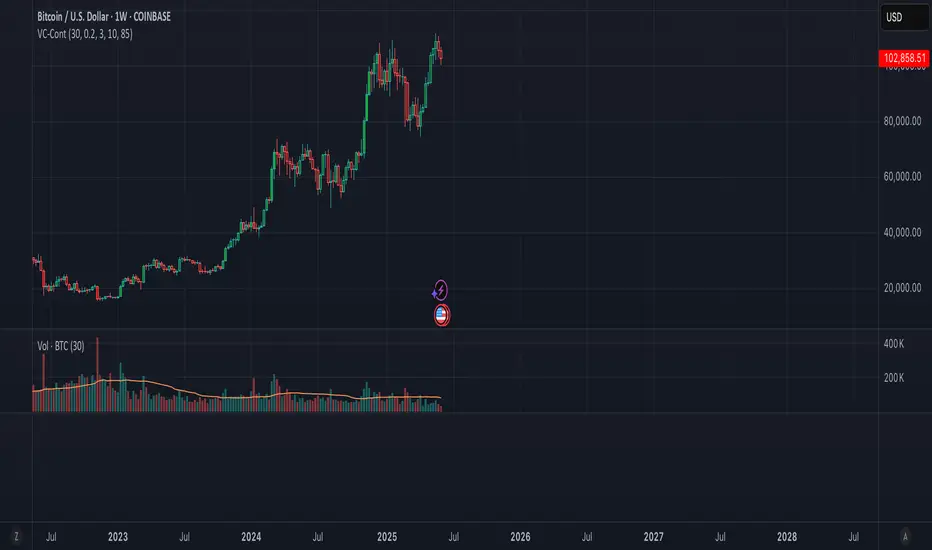
EXAMPLE= Taking a look at the screenshot (Perfect Scenario)
Bullish Examination
- Taking a look at the 2-D timeframe on BTC
x>50
x= all components traveling to the bullish zone. Blue wave, Strength Index with bullish divergence accumulation, Money Flow Positive with Green Trend Wave starting, with teal low volatility cross→→→ leads to Green Dot Buy Signal print…. And the big rise speaks for itself with price action and the big mountain wave of the Green Trend Wave.
This rise leads to
↓↓↓↓
Bearish Examination
Strength Index gets really high at 80 scale, Red X’s showing extremely heated Volatility, Money Flow turning red and sloping down, Trend Wave peaking starting to roll over, Blue Momentum Wave transitioning to white, bearish divergence of price action related to Strength Index→→→ leads to Red Dot Sell Signal print… and the flush speaks for itself when all components fall below 50 level with Trend wave turning red
All this is forecasted in the data, showing weakness before weakness and showing strength before strength. It works because every single piece of important elements in data of price action is incorporated in this all-in-one indicator…. Which leads to the reasoning of me calling this indicator the Visual Prowess, for its unprecedent sharpness of visual observation.
****This is a passion script incorporating every piece of data I value important when reading a chart — to see current perspective of a chart and to help foresee future projection of direction Up or Down. Any community feedback is greatly appreciated. Ongoing work will be done on this script as new thoughts and fine tuning will continuously be done for infinity, as this is my personal go to model for data on the markets.

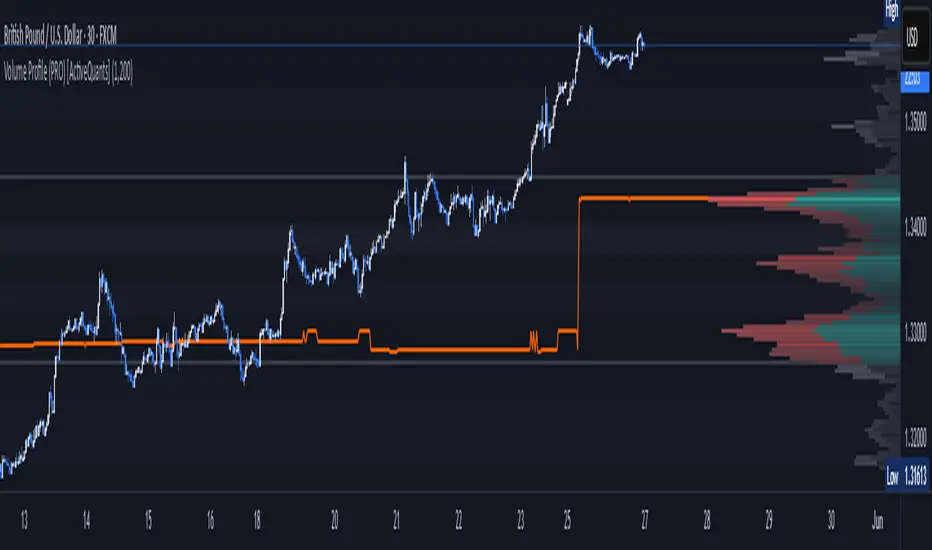
Volume Profile (PRO) [ActiveQuants]The Volume Profile (PRO) indicator is an advanced analytical tool designed to provide traders with a deep understanding of market dynamics by displaying trading activity across different price levels over a specified period. By meticulously plotting volume distribution , this indicator helps identify significant price zones, such as areas of high acceptance ( High Volume Nodes - HVNs ), rejection ( Low Volume Nodes - LVNs ), Volume Peaks Clusters , Volume Troughs Clusters , the Point of Control (POC) , and the Value Area (VA) . This insight is crucial for spotting potential support/resistance levels, assessing market sentiment, and making more informed trading decisions.
This indicator operates on the principle that price levels with higher traded volume hold greater significance, often acting as pivotal points for future price movements. Conversely, areas with low volume typically indicate less agreement on price, leading to quicker price transitions. The Volume Profile (PRO) offers extensive customization to tailor the analysis to your specific needs and trading style.
█ KEY FEATURES
Comprehensive Volume Analysis: Visualize volume distribution horizontally, revealing key price levels based on actual traded volume.
Dynamic Profile Calculation: Uses a rolling lookback period to keep the profile relevant to recent price action.
Point of Control (POC): Automatically identifies and plots the price level with the highest traded volume within the profile period. Available as a "Regular" (fixed for the current profile) or "Developing" line that tracks its evolution bar-by-bar.
Value Area (VA): Highlights the price range where a specified percentage (typically 70%) of the total volume was traded. Also available as "Regular" or "Developing" VAH (Value Area High) and VAL (Value Area Low) lines.
High and Low Volume Nodes (HVNs & LVNs): Option to automatically detect and highlight a specified number of the highest volume concentration zones (HVNs) and lowest volume zones (LVNs) within the profile. These are crucial for identifying support/resistance and areas of potential quick price movement.
Volume Peaks and Troughs Detection: Identify statistically significant high-volume (Peaks) and low-volume (Troughs) rows relative to their neighbors, either as single rows or clusters. These can pinpoint precise levels of interest.
Multiple Volume Display Types: Choose to display volume as:
- Up/Down: Shows buying and selling volume side-by-side for each row.
- Total: Shows the aggregate volume for each row.
- Delta: Shows the difference between buying and selling volume for each row, highlighting imbalances.
Extensive Customization: Fine-tune lookback period, number of rows, profile width, horizontal placement, Value Area percentage, colors for all elements, and specific parameters for node/peak/trough detection.
Visual Enhancements:
- Optional gradient colors for volume bars.
- Display volume figures directly on rows.
- Background shading for the Value Area and the entire Profile range.
- Price labels for POC, VAH, VAL, Profile High, and Profile Low.
Integrated Alert System: Pre-built alert conditions for critical volume profile events. (See section on "█ SETTING UP ALERTS " for more details).
█ USER INPUTS
The settings panel is organized into distinct sections:
- Calculation Settings:
Lookback: Number of most recent bars for profile calculation.
Number of Rows: Resolution of the volume profile.
Profile Width: Relative horizontal length of the volume bars.
Horizontal Offset: Horizontal positioning of the profile.
Value Area (%): Percentage of volume to include in the Value Area.
Volume: Display type ("Up/Down", "Total", "Delta").
Profile Placement: "Right" or "Left" side of the chart.
- Appearance:
Volume Profile On/Off: Toggle visibility of the entire profile.
Rows Border Width & Color: Customize the outline of volume rows.
Gradient Colors: Enable/disable gradient coloring for volume bars.
Row Volume: Display numerical volume on each row.
VAH (Value Area High): Display type ("None", "Regular", "Developing"), Color, Price Label, Line Width.
VAL (Value Area Low): Display type ("None", "Regular", "Developing"), Color, Price Label, Line Width.
Profile High Price Label & Color: Toggle and customize.
Profile Low Price Label & Color: Toggle and customize.
Value Area Up/Down Color: Colors for up/down volume within VA.
Profile Up/Down Color: Colors for up/down volume outside VA.
Total Volume Color: For "Total" volume display type.
Delta Volume Positive/Negative Color: For "Delta" volume display type.
POC (Point of Control): Display type ("None", "Regular", "Developing"), Color, Line Width, Price Label.
Value Area Background & Color: Enable and customize VA background shading.
Profile Background & Color: Enable and customize profile range background shading.
Volume Nodes:
Highest Volume Nodes & Color: Number of HVNs to highlight and their color.
Lowest Volume Nodes & Color: Number of LVNs to highlight and their color.
Volume Peaks: Detection type ("None", "Single Row", "Cluster"), Color.
Compared Neighbors (Peaks): Number of neighboring rows to compare against for peak detection.
Minimum Peak Ratio (Peaks): Volume ratio required for a row to be considered a peak.
Volume Troughs: Detection type ("None", "Single Row", "Cluster"), Color.
Compared Neighbors (Troughs): Number of neighboring rows to compare against for trough detection.
Minimum Trough Ratio (Troughs): Volume ratio required for a row to be considered a trough.
█ SETTING UP ALERTS
The Volume Profile (PRO) indicator comes with a comprehensive set of pre-configured alert conditions to notify you of key market events related to volume structure. To set up an alert:
Click the " Alert " button (clock icon) on TradingView's right-hand toolbar or top panel.
In the " Condition " dropdown, select " Volume Profile (PRO) ".
A second dropdown will appear, allowing you to choose from the following specific alert conditions built into the script:
- POC Price Change: Triggers when the Point of Control price level changes.
- POC Crossover: Triggers when the closing price crosses over the POC line and is now above it.
- POC Crossunder: Triggers when the closing price crosses under the POC line and is now below it.
- Close Inside Value Area: Triggers when the closing price enters the Value Area.
- Close Outside Value Area: Triggers when the closing price exits the Value Area.
- Close Inside High Volume Node: Triggers when the closing price enters a detected High Volume Node.
- Close Inside Low Volume Node: Triggers when the closing price enters a detected Low Volume Node.
- Close Inside Volume Peak: Triggers when the closing price enters a detected Volume Peak row.
- Close Inside Volume Peak Cluster: Triggers when the closing price enters the area of a Volume Peak cluster.
- Close Inside Volume Trough: Triggers when the closing price enters a detected Volume Trough row.
- Close Inside Volume Trough Cluster: Triggers when the closing price enters the area of a Volume Trough cluster.
Choose your preferred " Trigger " option:
- " Only Once ": The alert triggers the first time the condition is met.
- " Once Per Bar Close ": ( Recommended for most profile signals ) The alert triggers only after the current bar closes if the condition was true on that closed bar. This ensures signals are based on confirmed price action.
Customize the alert name, message, and notification preferences.
Click " Create ".
█ STRATEGY EXAMPLES
The following examples are for illustrative purposes only to demonstrate how the Volume Profile (PRO) can be used. They are not financial advice. Always conduct thorough backtesting and research.
1. POC as Dynamic Support/Resistance
Goal: Identify potential bounces or rejections from the Point of Control.
Setup: Enable "POC Line" (Regular or Developing) and observe price interaction.
Entry (Long):
- Price approaches the POC from above and shows signs of holding (e.g., bullish candlestick patterns, deceleration).
- Enter on confirmation of support at the POC.
Entry (Short):
- Price approaches the POC from below and shows signs of rejection (e.g., bearish candlestick patterns).
- Enter on confirmation of resistance at the POC.
Management: Stop-loss beyond the recent swing pivot or the POC itself after a confirmed break. Target the next significant volume node (HVN/LVN) or Value Area boundary.
2. Trading Low Volume Nodes (LVNs) as "Vacuum Zones"
Goal: Capitalize on rapid price movement through LVNs and their potential to become support/resistance once traversed.
Setup: Enable "Lowest Volume Nodes" to identify LVNs.
Entry (Long):
- Price breaks decisively above an LVN.
- Look for a retest of the top of the LVN as support. Enter long on confirmation.
Entry (Short):
- Price breaks decisively below an LVN.
- Look for a retest of the bottom of the LVN as resistance. Enter short on confirmation.
Concept: Price is expected to move quickly through LVNs (volume vacuum). Once price has passed through an LVN, that area of prior low acceptance can act as a new support/resistance zone.
Management: Stop-loss beyond the retested LVN. Target the next HVN or significant price level.
█ CONCLUSION
The Volume Profile (PRO) indicator offers a sophisticated and highly customizable approach to volume analysis. By providing clear visualizations of POC, Value Area, HVNs, LVNs, and Volume Peaks/Troughs, along with integrated alerts and developing levels, this tool empowers traders to identify critical price zones, understand market structure, and develop more nuanced trading strategies. Whether you're looking for precise entry points, areas of support and resistance, or confirmation of market sentiment, this Volume Profile indicator is an invaluable addition to your technical analysis toolkit.
█ IMPORTANT NOTES
⚠ Lookback vs. Calculated Bars Relationship: The value set in the " Lookback " input ( Calculation Settings ) must be less than half of the number of bars the indicator is set to calculate on your chart (referred to as " Calculated bars " in the script, typically controlled by TradingView's historical data loading or a calc_bars_count setting within the script's indicator() declaration – in this script, it is 1200 bars by default). For example, if "Calculated bars" is 1200, your Lookback should be less than 600. The default Lookback of 500 respects this. Setting a Lookback too high relative to available calculated bars can lead to errors or incorrect profile rendering.
⚠ Parameter Optimization: The default settings are starting points. Always adjust indicator parameters (Lookback, Number of Rows, VA%, etc.) based on the specific asset, its volatility, and the timeframe you are trading. Thorough backtesting is crucial.
⚠ Context is Key: Volume Profile is powerful, but its signals are best interpreted within the broader market context (trend, news, other technical indicators).
⚠ Lookback vs. Profile Stability: A shorter lookback makes the profile very responsive to recent action but less stable. A longer lookback provides more stable levels but may lag in fast-moving markets.
⚠ Number of Rows: Higher row counts offer more granularity but can impact performance and may show too much noise. Lower row counts offer a broader view but may obscure finer details.
⚠ Alert Confirmation: Using " Once Per Bar Close " for alerts is generally recommended to ensure signals are based on confirmed price action.
█ RISK DISCLAIMER
Trading involves a substantial risk of loss and is not suitable for all investors. The Volume Profile (PRO) indicator is provided for educational and informational purposes only . It does NOT constitute financial advice or a recommendation to buy or sell any asset. Indicator signals identify potential patterns based on historical data but do not guarantee future price movements or profitability. Always conduct your own thorough research, utilize multiple sources of information, and implement robust risk management practices before making any trading decisions. Past performance is not indicative of future results.
📊 Happy trading! 🚀
Volume Candle Color (Continuous)Volume-Based Candle Color Indicator (Continuous Gradient)
Overview
Transform your charts with this advanced volume visualization tool that colors candles based on relative volume intensity using a smooth, continuous gradient . Unlike traditional step-based volume indicators, this script provides nuanced color transitions that make volume anomalies instantly visible.
Key Features
Continuous Color Gradient
Smooth transitions - No more discrete color steps
High volume = Bright, opaque colors that demand attention
Low volume = Faded, transparent colors that blend into background
Real-time adaptation to market conditions
Full Customization Control
Volume Range Settings: Define min/max volume ratios for optimal sensitivity
Transparency Control: Adjust brightness levels from 0-95%
Custom Colors: Choose your preferred bullish/bearish base colors
Moving Average Period: Customize the volume comparison timeframe (default: 30)
Enhanced Visualization
Optional Info Panel: Real-time display of volume metrics
Volume Ratio Plot: Additional pane showing volume ratio trends
Clean Interface: Non-intrusive overlay that enhances price action
How It Works
The indicator calculates relative volume by comparing current volume to a Simple Moving Average (SMA) of volume over your chosen period. This ratio is then mapped to a continuous color scale:
Volume Ratio > 2.0: Maximum intensity (brightest colors)
Volume Ratio 1.0: Average volume (medium intensity)
Volume Ratio < 0.5: Below average (most transparent)
Bullish Candles (Close > Open): Green gradient
Bearish Candles (Close < Open): Red gradient
Trading Applications
Volume Spread Analysis (VSA)
Perfect companion for VSA traders who need to quickly identify:
Climactic volume at key support/resistance levels
No demand situations with low volume
Professional money accumulation/distribution patterns
Breakout Confirmation
High volume breakouts: Immediately visible with bright colors
False breakouts: Revealed by low volume (faded colors)
Volume divergences: Spotted instantly through color intensity changes
Market Structure Analysis
Support/Resistance tests: Volume validation through color brightness
Trend strength: Continuous color feedback on volume participation
Market phases: Easy identification of accumulation vs distribution
Why Choose This Indicator?
Advantages Over Traditional Volume Indicators:
Instant Visual Feedback: No need to look at separate volume bars
Continuous Scale: More precise than discrete level systems
Customizable Sensitivity: Adapt to any market or timeframe
Clean Charts: Maintains focus on price action while adding volume context
Universal Application: Works on all instruments and timeframes
Settings Guide
Essential Settings:
Volume MA Period (30): Longer periods = smoother baseline, shorter = more sensitive
Min Volume Ratio (0.2): Lower values = more sensitivity to low volume
Max Volume Ratio (3.0): Higher values = accommodate extreme volume spikes
Transparency Range (10-85%): Adjust visual contrast to your preference
Pro Tips:
Day Trading: Use 10-20 period MA for quick volume changes
Swing Trading: Use 30-50 period MA for broader volume context
Lower transparency range (0-70%) for subtle effects
Higher transparency range (20-90%) for dramatic contrasts
Best Practices
Combine with Price Action: Use volume colors to confirm price patterns
Multiple Timeframes: Apply on different timeframes for comprehensive analysis
Market Context: Adjust sensitivity based on market volatility periods
Backtesting: Test settings on historical data before live trading
Perfect For:
Volume Spread Analysis practitioners
Breakout traders seeking confirmation
Market structure analysts
Anyone wanting cleaner, more intuitive volume visualization
Technical Specifications
Pine Script v6 - Latest version compatibility
Overlay Indicator - Works directly on price charts
Minimal Performance Impact - Optimized calculations
All Market Types - Stocks, Forex, Crypto, Futures
Transform your volume analysis today! Experience the difference continuous color gradients make in identifying high-probability trading opportunities.
Like and follow for more innovative trading tools!
PhenLabs - Market Fluid Dynamics📊 Market Fluid Dynamics -
Version: PineScript™ v6
📌 Description
The Market Fluid Dynamics - Phen indicator is a new thinking regarding market analysis by modeling price action, volume, and volatility using a fluid system. It attempts to offer traders control over more profound market forces, such as momentum (speed), resistance (thickness), and buying/selling pressure. By visualizing such dynamics, the script allows the traders to decide on the prevailing market flow, its power, likely continuations, and zones of calmness and chaos, and thereby allows improved decision-making.
This measure avoids the usual difficulty of reconciling multiple, often contradictory, market indications by including them within a single overarching model. It moves beyond traditional binary indicators by providing a multi-dimensional view of market behavior, employing fluid dynamic analogs to describe complex interactions in an accessible manner.
🚀 Points of Innovation
Integrated Fluid Dynamics Model: Combines velocity, viscosity, pressure, and turbulence into a single indicator.
Normalized Metrics: Uses ATR and other normalization techniques for consistent readings across different assets and timeframes.
Dynamic Flow Visualization: Main flow line changes color and intensity based on direction and strength.
Turbulence Background: Visually represents market stability with a gradient background, from calm to turbulent.
Comprehensive Dashboard: Provides an at-a-glance summary of key fluid dynamic metrics.
Multi-Layer Smoothing: Employs several layers of EMA smoothing for a clearer, more responsive main flow line.
🔧 Core Components
Velocity Component: Measures price momentum (first derivative of price), normalized by ATR. It indicates the speed and direction of price changes.
Viscosity Component: Represents market resistance to price changes, derived from ATR relative to its historical average. Higher viscosity suggests it’s harder for prices to move.
Pressure Component: Quantifies the force created by volume and price range (close - open), normalized by ATR. It reflects buying or selling pressure.
Turbulence Detection: Calculates a Reynolds number equivalent to identify market stability, ranging from laminar (stable) to turbulent (chaotic).
Main Flow Indicator: Combines the above components, applying sensitivity and smoothing, to generate a primary signal of market direction and strength.
🔥 Key Features
Advanced Smoothing Algorithm: Utilizes multiple EMA layers on the raw flow calculation for a fluid and responsive main flow line, reducing noise while maintaining sensitivity.
Gradient Flow Coloring: The main flow line dynamically changes color from light to deep blue for bullish flow and light to deep red for bearish flow, with intensity reflecting flow strength. This provides an immediate visual cue of market sentiment and momentum.
Turbulence Level Background: The chart background changes color based on calculated turbulence (from calm gray to vibrant orange), offering an intuitive understanding of market stability and potential for erratic price action.
Informative Dashboard: A customizable on-screen table displays critical metrics like Flow State, Flow Strength, Market Viscosity, Turbulence, Pressure Force, Flow Acceleration, and Flow Continuity, allowing traders to quickly assess current market conditions.
Configurable Lookback and Sensitivity: Users can adjust the base lookback period for calculations and the sensitivity of the flow to viscosity, tailoring the indicator to different trading styles and market conditions.
Alert Conditions: Pre-defined alerts for flow direction changes (positive/negative crossover of zero line) and detection of high turbulence states.
🎨 Visualization
Main Flow Line: A smoothed line plotted below the main chart, colored blue for bullish flow and red for bearish flow. The intensity of the color (light to dark) indicates the strength of the flow. This line crossing the zero line can signal a change in market direction.
Zero Line: A dotted horizontal line at the zero level, serving as a baseline to gauge whether the market flow is positive (bullish) or negative (bearish).
Turbulence Background: The indicator pane’s background color changes based on the calculated turbulence level. A calm, almost transparent gray indicates low turbulence (laminar flow), while a more vibrant, semi-transparent orange signifies high turbulence. This helps traders visually assess market stability.
Dashboard Table: An optional table displayed on the chart, showing key metrics like ‘Flow State’, ‘Flow Strength’, ‘Market Viscosity’, ‘Turbulence’, ‘Pressure Force’, ‘Flow Acceleration’, and ‘Flow Continuity’ with their current values and qualitative descriptions (e.g., ‘Bullish Flow’, ‘Laminar (Stable)’).
📖 Usage Guidelines
Setting Categories
Show Dashboard - Default: true; Range: true/false; Description: Toggles the visibility of the Market Fluid Dynamics dashboard on the chart. Enable to see key metrics at a glance.
Base Lookback Period - Default: 14; Range: 5 - (no upper limit, practical limits apply); Description: Sets the primary lookback period for core calculations like velocity, ATR, and volume SMA. Shorter periods make the indicator more sensitive to recent price action, while longer periods provide a smoother, slower signal.
Flow Sensitivity - Default: 0.5; Range: 0.1 - 1.0 (step 0.1); Description: Adjusts how much the market viscosity dampens the raw flow. A lower value means viscosity has less impact (flow is more sensitive to raw velocity/pressure), while a higher value means viscosity has a greater dampening effect.
Flow Smoothing - Default: 5; Range: 1 - 20; Description: Controls the length of the EMA smoothing applied to the main flow line. Higher values result in a smoother flow line but with more lag; lower values make it more responsive but potentially noisier.
Dashboard Position - Default: ‘Top Right’; Range: ‘Top Right’, ‘Top Left’, ‘Bottom Right’, ‘Bottom Left’, ‘Middle Right’, ‘Middle Left’; Description: Determines the placement of the dashboard on the chart.
Header Size - Default: ‘Normal’; Range: ‘Tiny’, ‘Small’, ‘Normal’, ‘Large’, ‘Huge’; Description: Sets the text size for the dashboard header.
Values Size - Default: ‘Small’; Range: ‘Tiny’, ‘Small’, ‘Normal’, ‘Large’; Description: Sets the text size for the metric values in the dashboard.
✅ Best Use Cases
Trend Identification: Identifying the dominant market flow (bullish or bearish) and its strength to trade in the direction of the prevailing trend.
Momentum Confirmation: Using the flow strength and acceleration to confirm the conviction behind price movements.
Volatility Assessment: Utilizing the turbulence metric to gauge market stability, helping to adjust position sizing or avoid choppy conditions.
Reversal Spotting: Watching for divergences between price and flow, or crossovers of the main flow line above/below the zero line, as potential reversal signals, especially when combined with changes in pressure or viscosity.
Swing Trading: Leveraging the smoothed flow line to capture medium-term market swings, entering when flow aligns with the desired trade direction and exiting when flow weakens or reverses.
Intraday Scalping: Using shorter lookback periods and higher sensitivity to identify quick shifts in flow and turbulence for short-term trading opportunities, particularly in liquid markets.
⚠️ Limitations
Lagging Nature: Like many indicators based on moving averages and lookback periods, the main flow line can lag behind rapid price changes, potentially leading to delayed signals.
Whipsaws in Ranging Markets: During periods of low volatility or sideways price action (high viscosity, low flow strength), the indicator might produce frequent buy/sell signals (whipsaws) as the flow oscillates around the zero line.
Not a Standalone System: While comprehensive, it should be used in conjunction with other forms of analysis (e.g., price action, support/resistance levels, other indicators) and not as a sole basis for trading decisions.
Subjectivity in Interpretation: While the dashboard provides quantitative values, the interpretation of “strong” flow, “high” turbulence, or “significant” acceleration can still have a subjective element depending on the trader’s strategy and risk tolerance.
💡 What Makes This Unique
Fluid Dynamics Analogy: Its core strength lies in translating complex market interactions into an intuitive fluid dynamics framework, making concepts like momentum, resistance, and pressure easier to visualize and understand.
Market View: Instead of focusing on a single aspect (like just momentum or just volatility), it integrates multiple factors (velocity, viscosity, pressure, turbulence) to provide a more comprehensive picture of market conditions.
Adaptive Visualization: The dynamic coloring of the flow line and the turbulence background provide immediate, adaptive visual feedback that changes with market conditions.
🔬 How It Works
Price Velocity Calculation: The indicator first calculates price velocity by measuring the rate of change of the closing price over a given ‘lookback’ period. The raw velocity is then normalized by the Average True Range (ATR) of the same lookback period. Normalization enables comparison of momentum between assets or timeframes by scaling for volatility. This is the direction and speed of initial price movement.
Viscosity Calculation: Market ‘viscosity’ or resistance to price movement is determined by looking at the current ATR relative to its longer-term average (SMA of ATR over lookback * 2). The further the current ATR is above its average, the lower the viscosity (less resistance to price movement), and vice-versa. The script inverts this relationship and bounds it so that rising viscosity means more resistance.
Pressure Force Measurement: A ‘pressure’ variable is calculated as a function of the ratio of current volume to its simple moving average, multiplied by the price range (close - open) and normalized by ATR. This is designed to measure the force behind price movement created by volume and intraday price thrusts. This pressure is smoothed by an EMA.
Turbulence State Evaluation: A equivalent ‘Reynolds number’ is calculated by dividing the absolute normalized velocity by the viscosity. This is the proclivity of the market to move in a chaotic or orderly fashion. This ‘reynoldsValue’ is smoothed with an EMA to get the ‘turbulenceState’, which indicates if the market is laminar (stable), transitional, or turbulent.
Main Flow Derivation: The ‘rawFlow’ is calculated by taking the normalized velocity, dampening its impact based on the ‘viscosity’ and user-input ‘sensitivity’, and orienting it by the sign of the smoothed ‘pressureSmooth’. The ‘rawFlow’ is then put through multiple layers of exponential moving average (EMA) smoothing (with ‘smoothingLength’ and derived values) to reach the final ‘mainFlow’ line. The extensive smoothing is designed to give a smooth and clear visualization of the overall market direction and magnitude.
Dashboard Metrics Compilation: Additional metrics like flow acceleration (derivative of mainFlow), and flow continuity (correlation between close and volume) are calculated. All primary components (Flow State, Strength, Viscosity, Turbulence, Pressure, Acceleration, Continuity) are then presented in a user-configurable dashboard for ease of monitoring.
💡 Note:
The “Market Fluid Dynamics - Phen” indicator is designed to offer a unique perspective on market behavior by applying principles from fluid dynamics. It’s most effective when used to understand the underlying forces driving price rather than as a direct buy/sell signal generator in isolation. Experiment with the settings, particularly the ‘Base Lookback Period’, ‘Flow Sensitivity’, and ‘Flow Smoothing’, to find what best suits your trading style and the specific asset you are analyzing. Always combine its insights with robust risk management practices.

FII SMART KEY LEVELSIntroducing the **Global Institutional Flow Indicator (GIFI)**—your all-in-one guide to the levels that matter most, powered by real-time foreign institutional activity. GIFI seamlessly adapts to any market—be it NSE and BSE equities, major cryptocurrencies, or the world’s most liquid forex pairs—so you never miss a beat.
Key Features:
Foreign Institutional Footprint
Tracks aggregated buy and sell volumes of FIIs (Foreign Institutional Investors) and equivalent large players across markets, highlighting where “smart money” is concentrating their capital.
* **Dynamic Support & Resistance Levels**
Automatically calculates high-conviction zones—zones where institutional orders have previously clustered—so you can pinpoint ultra-reliable levels for entries, exits, and stop placements.
* **Multi-Asset Compatibility**
One unified indicator that works out of the box on NSE and BSE stocks, top crypto tokens, and major FX crosses. No need to switch tools when you move between markets.
* **Trend-Aligned Signals**
Overlays institutional levels on your favorite trend filters—moving averages, ADX, or MACD—so you only trade in the direction that big players are committing.
* **Volume-Weighted Confirmation**
Confirms level-breaks and bounces with volume delta analysis, ensuring you’re following genuine institutional commitment rather than retail noise.
* **Adaptive Timeframes**
From 5-minute scalps to daily swing setups, GIFI adjusts its sensitivity so you capture the most meaningful levels on any timeframe.
**Why It Works:**
Foreign institutions often leave telltale footprints when they build or unwind positions at scale. GIFI decodes those footprints into actionable levels—revealing where the “smart money” is most willing to buy or sell. When price approaches one of these institutional zones, you gain:
* **Higher Probability Entries**
Enter trades alongside large-ticket players rather than against them.
* **Optimized Risk Management**
Place stops just beyond genuine institutional commitment zones, reducing the odds of false breakouts.
* **Clearer Exit Strategies**
Target profit levels where institutions are likely to take profits or enter fresh positions.
Whether you’re scalping Nifty futures, swing-trading mid-cap stocks, riding crypto trends, or trading EUR/USD, the Global Institutional Flow Indicator equips you with the insights you need to trade confidently—knowing you’re aligning with the forces that really move the markets.
Impulse Profile Zones [BigBeluga]🔵 OVERVIEW
Impulse Profile Zones is a volume-based tool designed to highlight high-impact candles and visualize hidden liquidity zones inside them using microstructure data. It’s ideal for identifying volume concentration and potential reaction points during impulsive market moves.
Whenever a candle exceeds a specified size threshold, this indicator captures its structure and overlays a detailed intrabar volume profile (from a 10x lower timeframe), allowing traders to analyze the distribution of interest within powerful market impulses.
🔵 CONCEPTS
Filters candles that exceed a user-defined threshold by size.
For qualifying candles, retrieves lower timeframe price and volume data.
Divides the candle’s body into 10 volume bins and calculates the volume per zone. Highlights the bin with the highest volume as the Point of Control (POC) .
Each POC line extends forward until a new impulse is detected.
🔵 FEATURES
Impulse Candle Detection:
Triggers only when a candle’s body size is larger than the defined threshold.
Lower Timeframe Profiling:
Aggregates 10-bin volume data from a lower timeframe (typically 1/10 of current TF).
Volume Distribution Bars:
Each bin displays a stylized bar using unicode block characters (e.g., ▇▇▇, ▇▇ or ▇--).
The bar size reflects the relative volume intensity.
POC Zone Mapping:
The bin with the highest volume is marked with a bold horizontal line.
Its value is labeled and extended until the next valid impulse.
🔵 HOW TO USE
Use large candle profiles to assess which price levels inside a move were most actively traded.
Watch the POC line as a magnet for future price interaction (support/resistance or reaction).
Combine with market structure or order block indicators to identify confluence levels.
Adjust the “Filter Large Candles” input to detect more or fewer events based on volatility.
🔵 CONCLUSION
Impulse Profile Zones is a hybrid microstructure tool that bridges lower timeframe volume with higher timeframe impulse candles. By revealing where most of the volume occurred inside large moves, traders gain a deeper view into hidden liquidity, enabling smarter trade entries and more confident profit-taking zones.

ADR, ATR & VOL OverlayThis is a combined version of 2 of my other indicators:
ADR / ATR Overlay
VOL / AVG Overlay
This indicator will display the following as an overlay on your chart:
ADR
% of ADR
ADR % of Price
ATR
% of ATR
ATR % of Price
Custom Session Volume
Average For Selected Session
Volume Percentage Comparison
Description:
ADR : Average Day Range
% of ADR : Percentage that the current price move has covered its average.
ADR % of Price : The percentage move implied by the average range.
ATR : Average True Range
% of ATR : Percentage that the current price move has covered its average.
ATR % of Price : The percentage move implied by the average true range.
Custom Session Volume : User chosen time frame to monitor volume
Average For Selected Session : Average for the custom session volume
Volume Percentage Comparison : Current session compared to the average (calculated at session close)
Options:
ADR/ATR:
Time Frame
Length
Smoothing
Volume:
Set Custom Time Frame For Calculations
Set Custom Time Frame For Average Comparison
Set Custom Time Zone
Table:
Enable / Disable Each Value
Change Text Color
Change Background Color
Change Table location
Add/Remove extra row for placement
ADR / ATR Example:
The ADR and ATR can be used to provide information about average price moves to help set targets, stop losses, entries and exits based on the potential average moves.
Example: If the "% of ADR" is reading 100%, then 100% of the asset's average price range has been covered, suggesting that an additional move beyond the range has a lower probability.
Example: "ADR % of Price" provides potential price movement in percentage which can be used to asses R/R for asset.
Example: ADR (D) reading is 100% at market close but ATR (D) is at 70% at close. This suggests that there is a potential (coverage) move of 30% in Pre/Post market as suggested by averages.
Custom Volume Session Example:
Set indicator to 30 period average. Set custom time frame to 9:30am to 10:30am Eastern/New York.
When the time frame for the calculation is closed, the indicator will provide a comparison of the current days volume compared to the average of 30 previous days for that same time frame and display it as a percentage in the table.
In this example you could compare how the first hour of the trading day compares to the previous 30 day's average, aiding in evaluating the potential volume for the remainder of the day.
Notes:
Times must be entered in 24 hour format. (1pm = 13:00 etc.)
Volume indicator is for Intra-day time frames, not > Day.
How I use these values:
I use these calculations to determine if a ticker symbol has the necessary range to achieve target gains, to determine if the price oscillation is within "normal" ranges to determine if the trading day will be choppy, and to determine placement of stops and targets within average ranges in combination with support, resistance and retracement levels.

VOL & AVG OverlayCustom Session Volume Versus Average Volume
Description:
This indicator will create an overlay on your chart that will show you the following information:
Custom Session Volume
Average For Selected Session
Percentage Comparison
Options:
Set Custom Time Frame For Calculations
Set Custom Time Frame For Average Comparison
Set Custom Time Zone
Enable / Disable Each Value
Change Text Color
Change Background Color
Change Table location
Example:
Set indicator to 30 period average. Set custom time frame to 9:30am to 10:30am Eastern/New York.
When the time frame for the calculation is closed , the indicator will provide a comparison of the current days volume compared to the average of 30 previous days for that same time frame and display it as a percentage in the table.
In this example you could compare how the first hour of the trading day compares to the previous 30 day's average, aiding in evaluating the potential volume for the remainder of the day.
Notes:
Times must be entered in 24 hour format. (1pm = 13:00 etc.)
This indicator is for Intra-day time frames, not > Day.
If you prefer data in this format as opposed to a plotted line, check out my other indicator: ADR & ATR Overlay

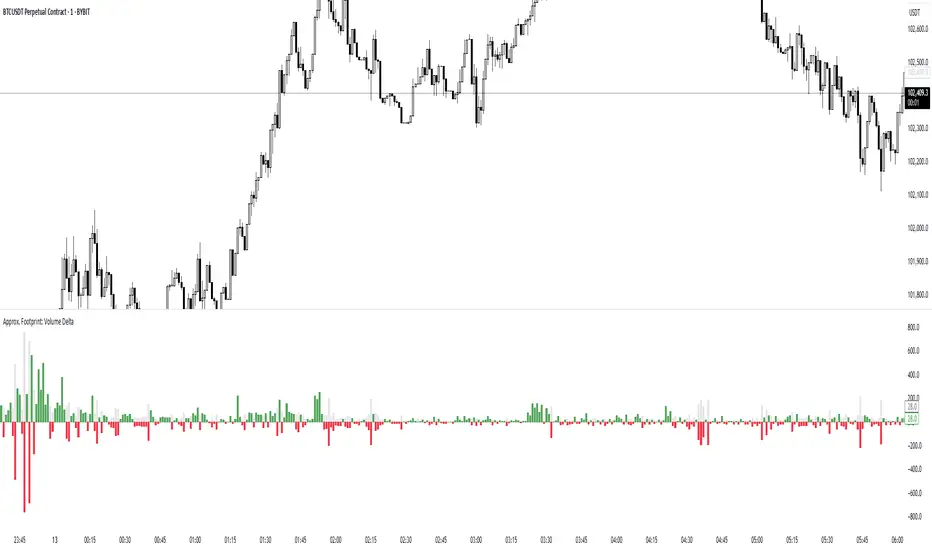
Approx. Footprint: Volume DeltaThis indicator brings you a simplified “footprint” view by charting the volume delta—the imbalance between bullish and bearish volume—alongside total bar volume.
Delta Bars: Green/red columns show where buyers (close > open) or sellers (close < open) dominated each bar.
Total Volume: Semi-transparent gray columns in the background give you overall context.
No Hidden Data: Works on any symbol/timeframe without tick-by-tick or bid/ask feeds.
Use it to quickly spot bars with strong buying or selling pressure, identify momentum shifts, and confirm breakouts or reversals—all within TradingView’s standard volume streams.
Multi-Layer Volume Profile [BigBeluga]A powerful multi-resolution volume analysis tool that stacks multiple profiles of historical trading activity to reveal true market structure.
This indicator breaks down total and delta volume distribution across time at four adjustable depths — enabling traders to spot major POCs, volume shelves, and zones of price acceptance or rejection with unmatched clarity.
🔵 KEY FEATURES
Multi-Layer Volume Profiles:
Up to 4 separate volume profiles are stacked on the chart:
- Profile 1: Full period
- Profile 2: Half-length
- Profile 3: Quarter-length
- Profile 4: One-eighth-length
This layering helps traders assess confluence across different time horizons.
Custom Bin Resolution:
Each profile uses a customizable number of bins to control visual precision.
More bins = higher granularity, fewer bins = smoother profile.
Precise POC Highlighting:
The price level with the maximum traded volume in each profile is highlighted with a thick blue POC line.
This key level shows the most accepted price for each period.
Total and Delta Volume Labels:
- Total Volume: Displays cumulative volume over the profile period at the top of the profile box.
- Delta Volume: The difference between bullish and bearish volume is labeled at the base, showing directional pressure.
Positive delta = buyer dominance, negative delta = seller dominance.
Range Levels:
Each profile includes horizontal reference lines showing its high, low, bounds.
These edges often align with price reaction zones and become future resistance/support.
🔵 HOW IT WORKS
For each active profile, the indicator:
- Collects price range (highs/lows) across the selected `length`
- Divides this range into equal bins
- Assigns volume into bins based on candle close location
- Aggregates volume per bin to form the profile (polylines)
Separately tracks:
- Total volume (sum of all candles in range)
- Delta volume (sum of candle volumes: positive for bullish, negative for bearish closes)
Highlights the bin with maximum volume (POC)
and marks it with a thick blue line.
Adds auxiliary lines for high/low of each profile box
and total/delta volume tags with tooltips.
🔵 USAGE
Spot Acceptance Zones:
Thick, flat areas on the profile show where price stayed longest — ideal for building positions.
Identify Rejection Zones:
Thin volume areas signal price rejection and are often used for stop placement or entries.
Delta Confirmation:
Use strong positive/negative delta readings as directional bias confirmation for breakout trades.
Confluence Detection:
Watch for overlapping POCs between layers to identify extremely strong support/resistance zones.
🔵 CONCLUSION
Multi-Layer Volume Profile equips traders with a deeply layered market structure view.
Whether you're scalping intraday levels or analyzing macro support zones, the ability to stack volume perspectives, visualize directional delta, and anchor POCs provides an edge in anticipating market moves.
Use this tool to validate entries, confirm structure, and make more informed, volume-aware trading decisions.

Multi-Indicator Swing [TIAMATCRYPTO]v6# Strategy Description:
## Multi-Indicator Swing
This strategy is designed for swing trading across various markets by combining multiple technical indicators to identify high-probability trading opportunities. The system focuses on trend strength confirmation and volume analysis to generate precise entry and exit signals.
### Core Components:
- **Supertrend Indicator**: Acts as the primary trend direction filter with optimized settings (Factor: 3.0, ATR Period: 10) to balance responsiveness and reliability.
- **ADX (Average Directional Index)**: Confirms the strength of the prevailing trend, filtering out sideways or choppy market conditions where the strategy avoids taking positions.
- **Liquidity Delta**: A volume-based indicator that analyzes buying and selling pressure imbalances to validate trend direction and potential reversals.
- **PSAR (Optional)**: Can be enabled to add additional confirmation for trend changes, turned off by default to reduce signal filtering.
### Key Features:
- **Flexible Direction Trading**: Choose between long-only, short-only, or bidirectional trading to adapt to market conditions or account restrictions.
- **Conservative Risk Management**: Implements fixed percentage-based stop losses (default 2%) and take profits (default 4%) for a positive risk-reward ratio.
- **Realistic Backtesting Parameters**: Includes commission (0.1%) and slippage (2 points) to reflect real-world trading conditions.
- **Visual Signals**: Clear buy/sell arrows with customizable sizes for easy identification on the chart.
- **Information Panel**: Dynamic display showing active indicators and current risk settings.
### Best Used On:
Daily timeframes for cryptocurrencies, forex, or stock indices. The strategy performs optimally on assets with clear trending behavior and sufficient volatility.
### Default Settings:
Optimized for conservative position sizing (5% of equity per trade) with an initial capital of $10,000. The backtesting period (2021-2023) provides a statistically significant sample of varied market conditions.

Order Block Matrix [Alpha Extract]The Order Block Matrix indicator identifies and visualizes key supply and demand zones on your chart, helping traders recognize potential reversal points and high-probability trading setups.
This tool helps traders:
Visualize key order blocks with volume profile histograms showing liquidity distribution.
Identify high-volume price levels where institutional activity occurs.
rank historical order blocks and analyze their strength based on volume.
Receive alerts for potential trading opportunities based on price-block interactions.
🔶 CALCULATION
The indicator processes chart data to identify and analyze order blocks:
Order Block Detection
Inputs:
Price action patterns (consolidation areas followed by breakouts).
Volume data from current and lower timeframes.
User-defined lookback periods and thresholds.
Detection Logic:
Identifies consolidation areas using a dynamic range comparison.
Confirms breakout patterns with percentage threshold validation.
Maps volume distribution across price levels within each order block.
🔶Volume Analysis
Volume Profiling:
Divides each order block into configurable grid segments.
Maps volume distribution across price segments within blocks.
Highlights zones with highest volume concentration.
Strength Assessment:
Calculates total block volume and relative strength metrics.
Compares block volume to historical averages.
Determines probability of reversal based on volume patterns.
isConsolidation(len) =>
high_range = ta.highest(high, len) - ta.lowest(high, len)
low_range = ta.highest(low, len) - ta.lowest(low, len)
avg_range = (high_range + low_range) / 2
current_range = high - low
current_range <= avg_range * (1 + obThreshold)
🔶 DETAILS
Visual Features
Volume Profile Histograms:
Color-coded bars showing volume concentration within order blocks.
Gradient coloring based on relative volume (high volume = brighter colors).
Bull blocks (green/teal) and bear blocks (red) with varying opacity.
Block Visualization:
Dynamic box sizing based on volume concentration.
Optional block borders and background fills.
Volume labels showing total block volume.
Screener Table:
Real-time analysis of order block metrics.
Shows block direction, proximity, retest count, and volume metrics.
Color-coded for quick reference.
Interpretation
High Volume Areas: Zones with institutional interest and potential reversal points.
Block Direction: Bullish blocks typically support price, bearish blocks typically resist price.
Retests: Multiple tests of an order block may strengthen or weaken its influence.
Block Age: Newer blocks often have stronger influence than older ones.
Volume Concentration: Brightest segments within blocks represent the highest volume areas.
🔶 EXAMPLES
The indicator helps identify key trading opportunities:
Bullish Order Blocks
Support Zones: Identify strong support levels where price is likely to bounce.
Breakout Confirmation: Validate breakouts with volume analysis to avoid false moves.
Retest Strategies: Enter trades when price retests a bullish order block with high volume.
Bearish Order Blocks
Resistance Zones: Identify strong resistance levels where price is likely to reverse.
Distribution Areas: Detect zones where smart money is distributing to retail.
Short Opportunities: Find optimal short entry points at high-volume bearish blocks.
Combined Strategies
Order Block Stacking: Multiple aligned blocks create stronger support/resistance zones.
Block Mitigation: When price breaks through a block, it often indicates a strong trend continuation.
Volume Profile Applications: Higher volume segments provide more precise entry and exit points.
🔶 SETTINGS
Customization Options
Order Block Detection:
Consolidation Lookback: Adjust the period for consolidation detection.
Breakout Threshold: Set minimum percentage for breakout confirmation.
Historical Lookback Limit: Control how far back to scan for historical order blocks.
Maximum Order Blocks: Limit the number of visible blocks on the chart.
Visual Style:
Grid Segments: Adjust the number of volume profile segments.
Extend Blocks to Right: Enable/disable extending blocks to current price.
Show Block Borders: Toggle border visibility.
Border Width: Adjust thickness of block borders.
Show Volume Text: Enable/disable volume labels.
Volume Text Position: Control placement of volume labels.
Color Settings:
Bullish High/Low Volume Colors: Customize appearance of bullish blocks.
Bearish High/Low Volume Colors: Customize appearance of bearish blocks.
Border Color: Set color for block outlines.
Background Fill: Adjust color and transparency of block backgrounds.
Volume Text Color: Customize label appearance.
Screener Table:
Show Screener Table: Toggle table visibility.
Table Position: Select positioning on the chart.
Table Size: Adjust display size.
The Order Block Matrix indicator provides traders with powerful insights into market structure, helping to identify key levels where smart money is active and where high-probability trading opportunities may exist.

Delta AO + Regular AO (Normalized)🔀 Delta AO + Regular AO (Normalized) – Visualizing Market moods becomes simpler 🔀
🧠 Introduction
The Delta AO + Regular AO (Normalized) is a custom oscillator that fuses the power of classic momentum analysis with volume-derived delta flow to give traders a dual-perspective edge.
This tool was born from a need to better visualize internal market thrust (via delta) while still respecting the time-tested signal power of the traditional Awesome Oscillator (AO).
🔍 What makes it unique?
✅ Volume-based Delta Calculation – Models upward/downward delta using a custom volatility-weighted volume allocation method, not simple tick-delta or raw buys/sells.
✅ Cumulative Delta Candles – Instead of just plotting bars, the indicator rebuilds the market structure using cumulative delta logic.
✅ Dual AO Display – Shows both custom delta AO and traditional price AO simultaneously.
✅ Normalized Scaling – Each AO is independently normalized by its standard deviation (volatility-adjusted), making both indicators visually comparable without distortion.
🧮 Under the Hood
Let’s break down the components:
1. Delta Logic 📊
Rather than using raw delta or tick-level data, this script simulates net effort:
Delta Up = Volume × a smart weighting when the candle is bullish
Delta Down = Volume × weighting when the candle is bearish
The weighting dynamically adjusts based on candle body-to-wick ratio. This provides a more refined delta estimate based on candle structure.
This delta is accumulated (cumulative delta) and used to form a synthetic OHLC candle structure.
2. AO Calculations ⚖️
Custom AO: Calculated from the median of synthetic delta candles
Regular AO: Classic (median price 5-period SMA - 34-period SMA)
Both are normalized using their own 34-bar standard deviation, improving comparability and visualization in one pane.
3. Color Coding 🎨
For the delta AO histogram:
Lime: Bullish + Increasing Momentum
Green: Bullish + Weakening Momentum
Red: Bearish + Increasing Momentum (to the downside)
Maroon: Bearish + Weakening Momentum
This lets you immediately spot momentum shifts and strength behind volume-based moves.
📈 How to Use – Trading Guide
🔧 Recommended Setup:
Timeframe: Works well on all intraday and higher timeframes (5m–1D)
Symbol: Especially effective on liquid instruments (futures, indices, large caps)
✅ Entry Signals
🔹 Buy Setup
Delta AO turns green or lime above zero, and Regular AO is also rising
Ideal confirmation: Lime bar (strong bullish delta momentum) and a crossover above zero
🔹 Sell Setup
Delta AO turns maroon or red below zero, and Regular AO is also falling
Ideal confirmation: Red bar (strong bearish delta momentum) and AO falling further below zero
🔄 Momentum Confirmation
Look for divergence between the Delta AO and Regular AO.
🔼 If Delta AO is rising but Regular AO is flat or falling → Volume is leading price (possible breakout ahead)
🔽 If Regular AO is strong but Delta AO fades → Price may be unsustainable (fakeout risk)
🛑 Exit / Reversal Clues
Sudden color shifts (e.g., Lime → Green → Maroon) can signal momentum exhaustion
Both AOs converging to zero suggests consolidation phase ahead
📌 Pro Tips
Use this with volume profile, support/resistance, or market structure zones for maximum confluence
Works great as a secondary confirmation tool for your existing strategy
💬 Final Thoughts
This oscillator is not just a pretty double AO — it's a strategic fusion of price and volume time-series designed to help you anticipate shifts before they’re obvious in price alone.
If you're looking for:
A modernized AO
Volume-integrated signal clarity
Normalized, noise-filtered momentum visual
Then this tool belongs in your chart arsenal.
📈 Try it. Test it. Pair it. If you find value, consider sharing or following for more next-gen indicators.
Please note this is an educational idea and past performance is not assurance of future performance.
Happy trading!
— @Pratik_4Clover

MissedPrice Volume Method[KiomarsRakei]█ Core Concept:
This script detects price zones that are highly likely to be revisited — areas where price moved too quickly to fully fill market activity. Using sharp volume shifts and volatility filters, the script identifies these “missed” levels and generates signals pointing toward them.
Signals are generated before price reaches the zone, allowing you to analyze price behavior both before and after the zone is touched. These zones often act like magnets for price, making them ideal for short-term.
Examples of signals and high hit rate of Missed zones
█ How It Works:
The script monitors 3-candle volume and price behavior to detect moments where volume accelerates abnormally compared to recent averages. When a potential missed zone is found and price hasn’t revisited it yet, a signal is created in advance, pointing to that zone as a likely future target.
█ Features:
Zone Visualization: Dynamic boxes show price targets based on missed volume areas.
Pre-Zone Signals: Alerts fire before price returns, offering early trade setups.
Stat Tracking System: Automatically logs signals, win rate, and average profit.
Live Performance Table: On-chart stats including hit/miss breakdown and late-return analysis.
Works on All Markets: Compatible with any chart that provides volume — crypto, forex, indices, or stocks.
A signal is considered successful when price touches the zone. However, not all zones are guaranteed to be revisited.
█ Key Inputs & Stats Table:
Volume Filters: Control signal sensitivity using min/max relative volume shift.
Zone & Line Settings: Adjust how long the zone stays visible and whether entry lines are drawn.
Custom Colors: Choose colors for buy/sell zones, lines, and visuals.
📊 Table Metrics:
Total Signals: Count of all generated signals.
Win Rate: % of signals where price returned to the zone (hit = touched the zone, regardless of timing).
Bad Signals: Signals that took too long to hit or were never hit.
Bad but Hit: Signals marked bad but eventually touched the zone.
Bad signals are marked in red. These indicate zones that price failed to reach within the expected time window, showing where the script identified a target that remained unfulfilled.

Dynamic Liquidity Depth [BigBeluga]
Dynamic Liquidity Depth
A liquidity mapping engine that reveals hidden zones of market vulnerability. This tool simulates where potential large concentrations of stop-losses may exist — above recent highs (sell-side) and below recent lows (buy-side) — by analyzing real price behavior and directional volume. The result is a dynamic two-sided volume profile that highlights where price is most likely to gravitate during liquidation events, reversals, or engineered stop hunts.
🔵 KEY FEATURES
Two-Sided Liquidity Profiles:
Plots two separate profiles on the chart — one above price for potential sell-side liquidity , and one below price for potential buy-side liquidity . Each profile reflects the volume distribution across binned zones derived from historical highs and lows.
Real Stop Zone Simulation:
Each profile is offset from the current high or low using an ATR-based buffer. This simulates where traders might cluster their stop-losses above swing highs (short stops) or below swing lows (long stops).
Directional Volume Analysis:
Buy-side volume is accumulated only from bullish candles (close > open), while sell-side volume is accumulated only from bearish candles (close < open). This directional filtering enhances accuracy by capturing genuine pressure zones.
Dynamic Volume Heatmap:
Each liquidity bin is rendered as a horizontal box with a color gradient based on volume intensity:
- Low activity bins are shaded lightly.
- High-volume zones appear more vividly in red (sell) or lime (buy).
- The maximum volume bin in each profile is emphasized with a brighter fill and a volume label.
Extended POC Zones:
The Point of Control (PoC) — the bin with the most volume — is extended backwards across the entire lookback period to mark critical resistance (sell-side) or support (buy-side) levels.
Total Volume Summary Labels:
At the center of each profile, a summary label displays Total Buy Liquidity and Total Sell Liquidity volume.
This metric helps assess directional imbalance — when buy liquidity is dominant, the market may favor upward continuation, and vice versa.
Customizable Profile Granularity:
You can fine-tune both Resolution (Bins) and Offset Distance to adjust how far profiles are displaced from price and how many levels are calculated within the ATR range.
🔵 HOW IT WORKS
The indicator calculates an ATR-based buffer above highs and below lows to define the top and bottom of the liquidity zones.
Using a user-defined lookback period, it scans historical candles and divides the buffered zones into bins.
Each bin checks if bullish (or bearish) candles pass through it based on price wicks and body.
Volume from valid candles is summed into the corresponding bin.
When volume exists in a bin, a horizontal box is drawn with a width scaled by relative volume strength.
The bin with the highest volume is highlighted and optionally extended backward as a zone of importance.
Total buy/sell liquidity is displayed with a summary label at the side of the profile.
🔵 USAGE/b]
Identify Stop Hunt Zones: High-volume clusters near swing highs/lows are likely liquidation zones targeted during fakeouts.
Fade or Follow Reactions: Price hitting a high-volume bin may reverse (fade opportunity) or break with strength (confirmation breakout).
Layer with Other Tools: Combine with market structure, order blocks, or trend filters to validate entries near liquidity.
Adjust Offset for Sensitivity: Use higher offset to simulate wider stop placement; use lower for tighter scalping zones.
🔵 CONCLUSION
Dynamic Liquidity Depth transforms raw price and volume into a spatial map of liquidity. By revealing areas where stop orders are likely hidden, it gives traders insight into price manipulation zones, potential reversal levels, and breakout traps. Whether you're hunting for traps or trading with the flow, this tool equips you to navigate liquidity with precision.

Institutional Support/Resistance Locator🏛️ Institutional Support/Resistance Locator
Overview
The Institutional Support/Resistance Locator identifies high-probability demand and supply zones based on strong price rejection, large candle bodies, and elevated volume . These zones are commonly targeted or defended by institutional participants, helping traders anticipate potential reversal or continuation areas.
⸻
How It Works
The indicator uses a confluence of conditions to detect zones:
• Large Body Candles: Body size must exceed the moving average body size multiplied by a user-defined factor.
• High Volume: Volume must exceed the moving average volume by a configurable multiplier.
• Wick Rejection: Candles must show strong upper or lower wicks indicating aggressive rejection.
• If all criteria are met:
• Bullish candles form a Demand Zone.
• Bearish candles form a Supply Zone.
Each zone is plotted for a customizable number of future bars, representing areas where institutions may re-engage with the market.
⸻
Key Features
• ✅ Highlights institutional demand and supply areas dynamically
• ✅ Customizable sensitivity: body, volume, wick, padding, and zone extension
• ✅ Zones plotted as translucent regions with auto-expiry
• ✅ Works across all timeframes and markets
⸻
How to Use
• Trend Traders: Use demand zones for potential bounce entries in uptrends, and supply zones for pullback short entries in downtrends.
• Range Traders: Use zones as potential reversal points inside sideways market structures.
• Scalpers & Intraday Traders: Combine with volume or price action near zones for refined entries.
Always validate zone reactions with supporting indicators or price behavior.
⸻
Why This Combination?
The combination of wick rejection, volume confirmation, and large candle structure is designed to reflect footprints of smart money. Rather than relying on fixed pivots or subjective zones, this logic adapts to the current market context with statistically grounded conditions.
⸻
Why It’s Worth Using
This tool offers traders a structured way to interpret institutional activity on charts without relying on guesswork. By plotting potential high-impact areas, it helps improve reaction time.
⸻
Note :
• This script is open-source and non-commercial.
• No performance guarantees or unrealistic claims are made.
• It is intended for educational and analytical purposes only.

Volume Sentiment Pro (NTY88)Volume Sentiment Edge: Smart Volume & RSI Trading System
Description:
Unlock the power of volume-driven market psychology combined with precision RSI analysis! This professional-grade indicator identifies high-probability trading opportunities through:
🔥 Key Features
1. Smart Volume Spike Detection
Auto-detects abnormal volume activity with adaptive threshold
Clear spike labels & multi-timeframe confirmation
RSI-Powered Sentiment Analysis
Real-time Bullish/Bearish signals based on RSI extremes
Combined volume-RSI scoring system (Strong Bull/Bear alerts)
2. Professional Dashboard
Instant sentiment status table (bottom-right)
Color-coded momentum strength visualization
Customizable themes for all chart styles
3. Institutional-Grade Tools
HTF (Daily/Weekly) volume confirmation
EMA trend-filtered momentum signals
Spike-to-Threshold ratio monitoring
4. Trade-Ready Alerts
Pre-configured "Bullish Setup" (Spike + Oversold RSI)
"Bearish Setup" (Spike + Overbought RSI)
Why Traders Love This:
✅ Real-Time Visual Alerts - SPIKE markers above bars + table updates
✅ Adaptive Thresholds - Self-adjusting to market volatility
✅ Multi-Timeframe Verification - Avoid false signals with HTF confirmation
✅ Customizable UI - 10+ color settings for perfect chart integration
Usage Scenarios:
Day Traders: Catch volume surges during key sessions
Swing Traders: Confirm reversals with RSI extremes
All Markets: Works equally well on stocks, forex & crypto
Confirmation Tool: Combine with your existing strategy
Sample Setup:
"Enter long when:
5. RED SPIKE label appears
Table shows 'Oversold RSI'
Momentum status turns 'Bullish'
Volume exceeds daily average (Confirmed)"
📈 Try Risk-Free Today!
Perfect for traders who want:
Clean, non-repainting signals
Institutional-level volume analysis
Professional visual feedback
Customizable trading rules
⚠️ Important: Works best on 15m-4h timeframes. Combine with price action for maximum effectiveness.
📜 Legal Disclaimer
By using this indicator, you agree to the following terms:
Not Financial Advice
This tool provides technical analysis only. It does NOT constitute investment advice, financial guidance, or solicitation to trade.
High Risk Warning
Trading financial instruments carries substantial risk. Past performance ≠ future results. Never risk capital you cannot afford to lose.
No Guarantees
Signals are based on historical data and mathematical models. Market conditions may change rapidly, rendering previous patterns ineffective.
User Responsibility
You alone bear 100% responsibility for trading decisions. We expressly disclaim liability for any profit/loss resulting from this tool's use.
Professional Consultation
Always consult a licensed financial advisor before taking positions. This tool should NEVER be used as sole decision-making criteria.
Educational Purpose
This indicator is provided "as is" for informational/educational use only. No representation is made about its accuracy or completeness.
Third-Party Data
We do not verify exchange data accuracy. Use signals at your own discretion after independent verification.

Aggregated Open Interest [Alpha Extract]The Aggregated Open Interest indicator provides a comprehensive view of open interest across multiple cryptocurrency exchanges, allowing traders to monitor institutional positioning and market sentiment. By aggregating data from major exchanges like Binance, BitMEX, and Kraken, this indicator offers valuable insights into potential price movements and market shifts.
🔶 CALCULATION
The indicator processes open interest data through multiple analytical methods:
Exchange Aggregation: Collects and normalizes open interest data from multiple exchanges (Binance, BitMEX, Kraken) with proper currency normalization.
Multi-Mode Analysis: Calculates various metrics including raw open interest values, OI change, OI delta, volume-weighted delta, and OI RSI.
Divergence Detection: Uses pivot point analysis to identify divergences between price action and open interest movements.
Activity Assessment: Tracks bullish and bearish activity patterns by correlating open interest changes with price movements.
Formula:
Aggregate OI = Sum of normalized open interest from selected exchanges
OI Change = Current OI - Previous OI
OI Delta = Net change in open interest across timeframes
OI Delta × Volume = OI Delta weighted by relative volume
OI RSI = Relative Strength Index applied to open interest values
OI Heatmap = Multi-timeframe visualization of OI changes across 7 distinct periods
🔶 DETAILS
Visual Features:
Open Interest: Candlestick representation of aggregated open interest
OI Change: Histogram showing period-to-period changes
OI Delta: Histogram displaying net OI movements
OI Delta × Volume: Volume-weighted OI delta for enhanced signals
OI RSI: Oscillator showing overbought/oversold OI conditions
OI Heatmap: Multi-timeframe visualization showing OI changes across 7 periods (3, 5, 8, 13, 21, 34, and 55 days)
Divergence Detection: Color-coded markers (teal for bullish, red for bearish) highlighting significant divergences between price and open interest
Analysis Table: Real-time summary of key metrics including aggregate OI, recent changes, and bullish/bearish activity.
Interpretation:
Increasing Open Interest + Rising Price: Strong bullish trend confirmation
Increasing Open Interest + Falling Price: Strong bearish trend confirmation
Decreasing Open Interest + Rising Price: Weak bullish trend (potential reversal)
Decreasing Open Interest + Falling Price: Weak bearish trend (potential reversal)
Divergences: Signal potential trend exhaustion and reversals when price moves in one direction while open interest moves in the opposite direction
Heatmap: Provides at-a-glance insight into open interest trends across multiple timeframes, with green bars indicating rising OI and red bars indicating falling OI
🔶 EXAMPLES
Trend Confirmation: Rising open interest accompanying a price increase confirms strong bullish momentum with institutional backing.
Example: During January-February 2025, rising OI during price advances confirms institutional participation in the uptrend.
Bearish Divergence: Price makes a higher high while open interest makes a lower high, signaling potential trend reversal.
Example: Red markers appear at market tops where price continues higher but open interest fails to confirm, preceding significant corrections.
Bullish Divergence : Price makes a lower low while open interest makes a higher low, indicating potential bottoming.
Example: Teal markers appear at market bottoms where price continues lower but open interest fails to confirm, preceding significant rallies.
OI Heatmap Analysis : Multiple timeframes showing consistent red signals across short to long-term periods indicate strong institutional selling pressure.
Example: When all 7 periods (3-55 days) show red during a price uptrend, this signals institutional selling into retail strength, often preceding major corrections.
🔶 SETTINGS
Customization Options:
Data Sources: Toggle different exchanges (Binance USDT/USD/BUSD, BitMEX USD/USDT, Kraken USD)
Display Mode: Choose between Open Interest, OI Change, OI Delta, OI Delta × Volume, OI RSI, and OI Heatmap
Currency Units: Display in USD or base cryptocurrency (COIN)
Analysis Tools: Moving Average (length and color), RSI (length and color)
Divergence Detection: Enable/disable signals, adjust lookback period and threshold percentage, customize bullish/bearish divergence colors
OI Heatmap Colors: Customize bullish (green) and bearish (red) signal colors for the multi-timeframe heatmap visualization
The Aggregated Open Interest indicator provides traders with comprehensive insights into institutional positioning across major exchanges, helping identify potential trend continuations, reversals, and key market turning points driven by smart money movements. The addition of the OI Heatmap feature enables traders to quickly visualize open interest trends across multiple timeframes, providing valuable context for institutional positioning over different market cycles.

CYCLE BY RiotWolftradingDescription of the "CYCLE" Indicator
The "CYCLE" indicator is a custom Pine Script v5 script for TradingView that visualizes cyclic patterns in price action, dividing the trading day into specific sessions and 90-minute quarters (Q1-Q4). It is designed to identify and display market phases (Accumulation, Manipulation, Distribution, and Continuation/Reversal) along with key support and resistance levels within those sessions. Additionally, it allows customization of boxes, lines, labels, and colors to suit user preferences.
Main Features
Cycle Phases:
Accumulation (1900-0100): Represents the phase where large operators accumulate positions.
Manipulation (0100-0700): Identifies potential manipulative moves to mislead retail traders.
Distribution (0700-1300): The phase where large operators distribute their positions.
Continuation/Reversal (1300-1900): Indicates whether the price continues the trend or reverses.
90-Minute Quarters (Q1-Q4):
Divides each 6-hour cycle (360 minutes) into four 90-minute quarters (Q1: 00:00-01:30, Q2: 01:30-03:00, Q3: 03:00-04:30, Q4: 04:30-06:00 UTC).
Each quarter is displayed with a colored box (Q1: light purple, Q2: light blue, Q3: light gray, Q4: light pink) and labels (defaulted to black).
Support and Resistance Visualization:
Draws boxes or lines (based on settings) showing the high and low levels of each session.
Optionally displays accumulated volume at the highs and lows within the boxes.
Daily Lines and Last 3 Boxes:
How to Use the Indicator
Step 1: Add the Indicator to TradingView
Open TradingView and select the chart where you want to apply the indicator (e.g., UMG9OOR on a 5-minute timeframe, as shown in the screenshot).
Go to the Pine Editor (at the bottom of the TradingView interface).
Copy and paste the provided code.
Click Compile and then Add to Chart.
Step 2: Configure the Indicator
Click on the indicator name on the chart ("CYCLE") and select Settings (or double-click the name).
Adjust the options based on your needs:
Cycle Phases: Enable/disable phases (Accumulation, Manipulation, Distribution, Continuation/Reversal) and adjust their time slots if needed.
90-Minute Quarters: Enable/disable quarters (Q1-Q4).
Step 3: Interpret the Indicator
Identify Cycle Phases:
Observe the red boxes indicating the phases (Accumulation, Manipulation, etc.).
The high and low levels within each phase are potential support/resistance zones.
If volume is enabled, pay attention to the accumulated volume at highs and lows, as it may indicate the strength of those levels.
Use the 90-Minute Quarters (Q1-Q4):
The colored boxes (Q1-Q4) divide the day into 90-minute segments.
Each quarter shows the price range (high and low) during that period.
Use these boxes to identify price patterns within each quarter, such as breakouts or consolidations.
The labels (Q1, Q2, etc.) help you track time and anticipate potential moves in the next quarter.
Analyze Support and Resistance:
The high and low levels of each phase/quarter act as support and resistance.
Daily lines (if enabled) show key levels from the previous day, useful for planning entries/exits.
The "last 3 boxes below price" (if enabled) highlight potential support levels the price might target.
Avoid Manipulation:
During the Manipulation phase (0100-0700), be cautious of sharp moves or false breakouts.
Use the high/low levels of this phase to identify potential traps (as explained in your first question about manipulation candles).
Step 4: Trading Strategy
Entries and Exits:
Support/Resistance: Use the high/low levels of phases and quarters to set entry or exit points.
For example, if the price bounces off a Q1 support level, consider a buy.
Breakouts: If the price breaks a high/low of a quarter (e.g., Q2), wait for confirmation to enter in the direction of the breakout.
Volume: If accumulated volume is high near a key level, that level may be more significant.
Risk Management:
Place stop-loss orders below lows (for buys) or above highs (for sells) identified by the indicator.
Avoid trading during the Manipulation phase unless you have a specific strategy to handle false breakouts.
Time Context:
Use the quarters (Q1-Q4) to plan your trades based on time. For example, if Q3 is typically volatile in your market, prepare for larger moves between 03:00-04:30 UTC.
Step 5: Adjustments and Testing
Test on Different Timeframes: The indicator is set for a 5-minute timeframe (as in the screenshot), but you can test it on other timeframes (e.g., 1-minute, 15-minute) by adjusting the time slots if needed.
Adjust Colors and Styles: If the default colors are not visible on your chart, change them for better clarity.
---
📌 1. **Accumulation: Strong Institutional Activity**
- During the **accumulation phase, we see **high volume: 82.773K, which suggests strong buying interest**, likely from institutional players.
- This sets the base for the following upward move in price.
---
📌 2. **Manipulation: False Breakout with Lower Volume**
- Later, there's a manipulation phase where price breaks above previous highs, but the volume (71.814K) is **lower than during accumulation**.
- This implies that buyers are not as aggressive as before—no real demandbehind the breakout.
- It’s likely a bull trap, where smart money is selling into the breakout to exit their positions.
---
### 📌 3. Distribution: Weakness and Lack of Demand
- The market enters a distribution phase, and volume drops even further (only 7.914K).
- Price struggles to go higher, and you start seeing rejections at the top.
- This shows that demand is drying up, and smart money is offloading positions**—not accumulating anymore.
---
### 💡 Why Take the Short Here?
- Volume is not increasing with new highs—showing weak demand**.
- The manipulation volume is weaker than the accumulation volume, confirming the breakout was likely false.
- Structure starts to break down (Q levels falling), which confirms weakness.
- This creates a high-probability short setup:
- **Entry:** after confirmation of distribution and structural breakdown.
- **Stop loss:** above the manipulation high.
- **Target:** down toward previous lows or value zones.
---
### ✅ Conclusion
Since the manipulation volume failed to exceed the accumulation volume, the breakout lacked real strength. Combined with decreasing volume in the distribution phase, this indicates fading demand and supply taking control—which justifies entering a short position.

Volume Signal RSIVolume Signal RSI (VSR) Indicator
Overview:
The Volume Signal RSI (VSR) indicator combines traditional RSI analysis with statistically significant volume detection to identify potential reversal points and exhaustion signals in crypto markets. By applying statistical methods to volume analysis, VSR filters out normal market noise and highlights only the most meaningful volume spikes.
Key Features:
- Standard RSI overbought/oversold signals (70/30)
- Statistical volume significance detection using z-scores and p-values
- Exhaustion signals for potential market reversals
- Enhanced alert system with actionable trading context
How to Use This Indicator
Basic Signals:
- RSI Line: The blue line shows the standard RSI value (default period: 14)
- Overbought/Oversold Levels: Standard levels at 70/30 with additional extreme levels at 80/20
- Volume Detection: Small circles appear on the RSI line when statistically significant volume is detected
Trading Signals
1. Oversold Alert (🔴): When RSI crosses below 30
- Indicates potential support area
- Consider for long entries when price shows signs of stabilizing
2. Overbought Alert (🟢): When RSI crosses above 70
- Indicates potential resistance area
- Consider for short entries when price shows signs of topping
3. Bear Exhaustion Signal (⚠️): When bearish volume appears in oversold territory
- Indicates a potential selling climax
- Strong reversal signal when accompanied by positive price action
- Best used for counter-trend entries during downtrends
4. Bull Exhaustion Signal (⚠️): When bullish volume appears in overbought territory
- Indicates a potential buying climax
- Strong reversal signal when accompanied by negative price action
- Best used for counter-trend entries during uptrends
Alert Messages:
Alert messages contain critical information formatted for quick analysis:
- Symbol and timeframe
- Current price and RSI value with direction indicator
- Volume metrics: z-score, deviation percentage, and statistical confidence
- Trading context suggestion
Statistical Methodology:
- Z-Score: Measures how many standard deviations the current volume is from the mean
- P-Value: Statistical measure of significance (lower values = more significant)
- Confidence: Displayed as a percentage (higher = more confidence in the signal)
- Volume Deviation: Percentage above/below the average volume
Best Practices
1. Confirm signals with price action or other indicators
2. Higher timeframes typically produce more reliable signals
3. Use the statistical confidence percentage to gauge signal strength
4. Most powerful signals occur when exhaustion signals coincide with key support/resistance levels and there a quarter or more wick size at top of candle(buying exhaustion) or at bottom of candle (selling exhaustion)

WhispererRealtimeVolumeLibrary "WhispererRealtimeVolume"
▮ Overview
The Whisperer Realtime Volume Library is a lightweight and reusable Pine Script® library designed for real-time volume analysis.
It calculates up, down, and neutral volumes dynamically, making it an essential tool for traders who want to gain deeper insights into market activity.
This library is a simplified and modular version of the original "Realtime Volume Bars w Market Buy/Sell/Neutral split & Mkt Delta" indicator by the_MarketWhisperer , tailored for integration into custom scripts.
How bars are classified
- Up Bars
If the current bar’s closing price is higher than the previous bar’s closing price, it is classified as an up bar.
Volume handling:
The increase in volume for this bar is added to the up volume.
This represents buying pressure.
- Down Bars
If the current bar’s closing price is lower than the previous bar’s closing price, it is classified as a down bar.
Volume handling:
The increase in volume for this bar is added to the down volume.
This represents selling pressure.
- Neutral Bars
If the current bar’s closing price is the same as the previous bar’s closing price, it is classified as a neutral bar.
Volume handling:
If neutral volume is enabled, the volume is added to the neutral volume.
If neutral volume is not enabled, the volume is assigned to the same direction as the previous bar (up or down). If the previous direction is unknown, it is added to the neutral volume.
▮ What to look for
Real-Time Volume Calculation : Analyze up, down, and neutral volumes in real-time based on price movements and bar volume.
Customizable Start Line : Add a visual reference line to your chart for better context by viewing the starting point of real-time bars.
Ease of Integration : Designed as a library for seamless use in other Pine Script® indicators or strategies.
▮ How to use
Example code:
//@version=6
indicator("Volume Realtime from Whisperer")
import andre_007/WhispererRealtimeVolume/4 as MW
MW.displayStartLine(startLineColor = color.gray, startLineWidth = 1, startLineStyle = line.style_dashed,
displayStartLine = true, y1=volume, y2=volume + 10)
= MW.mw_upDownVolumeRealtime(true)
plot(volume, style=plot.style_columns, color=color.gray)
plot(volumeUp, style=plot.style_columns, color=color.green)
plot(volumeDown, style=plot.style_columns, color=color.red)
plot(volumeNeutral, style=plot.style_columns, color=color.purple)
▮ Credits
This library is inspired by the original work of the_MarketWhisperer , whose "Realtime Volume Bars" indicator served as the foundation.
Link to original indicator :
