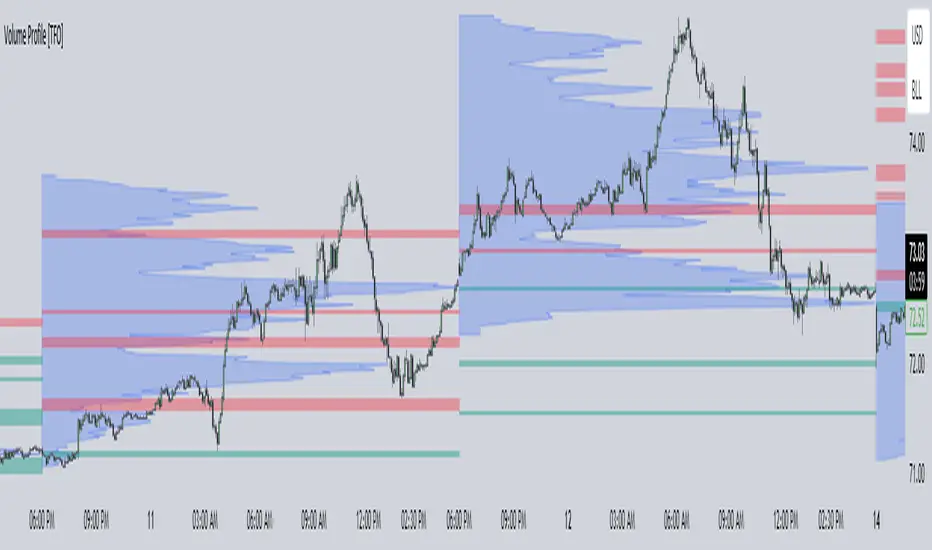
Volume Profile [TFO]This indicator generates Volume Profiles from which to display insights about recent Volume Points of Control and High Volume Nodes. Volume Profile is a way to view trading volume by the price where trades have occurred, rather than the time when they occur (as seen by traditional Volume indicators).
By selecting a Resolution Timeframe (1m in this example), we can aggregate the volume at different prices to build a Volume Profile for a specified Profile Timeframe (1D in this example). In this indicator, we make the simple assumption that a given candle's volume is distributed evenly across all points. Realistically, this is seldom the case, but it gives us a starting point to easily estimate the volume at a given price, in turn helping us to build our profiles in a trivial way.
If we do this for all Resolution Timeframe candles within a Profile Timeframe (all 1m candles in a single 1D candle, in this example), then we can successfully aggregate this data and build a full Volume Profile. And thankfully, Pine Script's new polyline feature ultimately allow us to keep more Volume Profiles on our charts. Before polylines, we would have to consider using lines or boxes to represent the individual levels within a given profile, and each script currently has a cap of 500 lines and boxes, respectively. However, one single polyline can be used to draw the complex shape of an entire profile, and we may show up to 100 polylines in a given script. This helps us keep a lot more data on our charts!
Compared to TradingView's Session Volume Profile indicator (blue/yellow), we can see that our indicator (grey) is nearly identical, which verifies that our assumption of a uniform volume distribution is enough to roughly estimate a given Volume Profile. Note in this example the Row Size was set to 200, meaning that 200 levels are used to approximate profiles from each session's high to its low.
Show VPOC will show the volume point of control of each profile, which represents the price level where the largest amount of volume was traded for a given profile. This is shown with the red lines in the following chart.
Extend Last N VPOCs will look for the most recent, user-defined number of VPOCs (not including the current session's VPOC that's still developing) and extend them to the right of the chart as points of reference. The Show Labels Above option will annotate each VPOC with its respective date above a specified timeframe. This way, if one was using Volume Profiles on intraday timeframes, there wouldn't need to be several date strings all showing the same day.
Show Previous HVNs will show high volume nodes from the previous session. The HVN Strength setting is similar to a "pivot strength" that I use in a lot of my scripts - essentially, HVNs are validated by treating them as local highs. With a HVN Strength of 10 for example, if a given level contains more volume than the 10 levels above and below it, then it is validated as a HVN.
For a cleaner look and feel, HVNs can instead be shown as levels (lines) instead of areas (boxes). With levels enabled, solid lines denote the previous session's VPOC, and dotted lines represent all other HVNs. With areas enabled instead, the tops and bottoms will extend above/below the HVN level until a point with greater volume is discovered (marking the "end" of the node).
This indicator can be computationally intensive and may crash from taking too long to execute. In these cases, it's best to disable unused features, decrease the number of Rows, and/or simply reload the chart until it populates.
Volumeanalysis
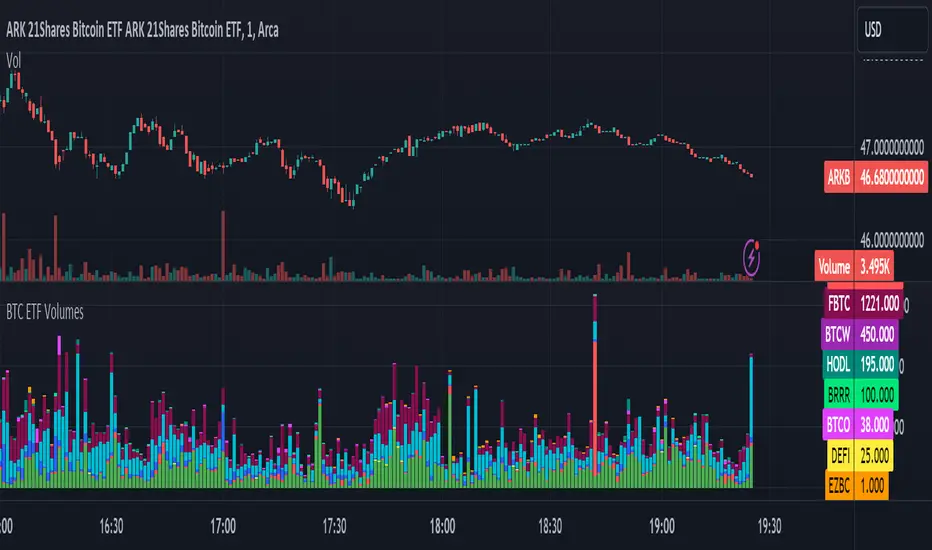
BTC ETF VolumesVolume
This script plots the trading volume of all BTC spot ETFs as well as the aggregate volume. Works on any chart and any timeframe.
Indicators
The volume of every ETF is plotted in a different color, with the total column adding up to the aggregate volume.
If you have price and indicator labels enabled you will also see individual ETF volume on your price scale on the right hand side.
If more BTC ETFs get launched I will add them.
Volume Candle DistributionThe Volume Candle Distribution (VCD) indicator examines the volume distribution across candle type, distinguishes between neutral, bullish and bearish volume pressures.
The VCD indicator calculates and displays the cumulative volume of bullish and bearish candles over a user-defined period, aggregates the volumes of bullish and bearish candles separately and plots them.
Bullish Volume : This is accumulated when the closing price of a candle is higher than the opening price, the VCD adds up the volume of bullish candle within the user-defined period, and consequently subtracts the volume when bearish candle.
Bearish Volume : Conversely, when the closing price is lower than the opening price, the volume of that candle is considered bearish, the VCD sums the volume of bearish candles over the same period, and consequently subtracts the volume when bullish candle.
Neutral Volume : In cases where the opening and closing prices are equal, the volume of that candle is treated as neutral, and the VCD subtracts the volume from both candles.
The 3 Simple Moving Average (SMAs) included is based volume calculated separately for both bullish and bearish volume data, and the sum of them.

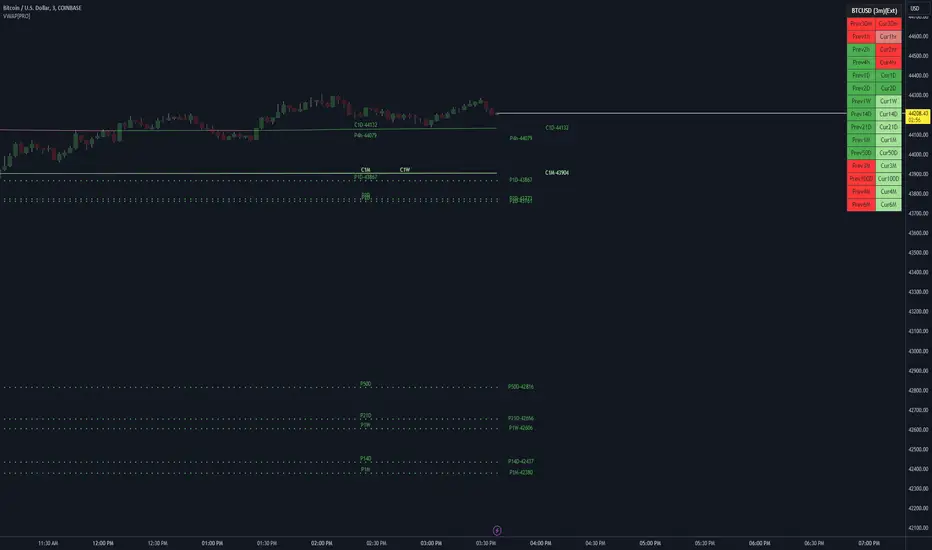
VWAP LEVELS [PRO]32 VWAP levels with labels and a table to help you identify quickly where current price is in relation to your favorite VWAP pivot levels. To help reduce cognitive load, 4 colors are used to show you where price is in relation to a VWAP level as well as the strength of that respective level. Ultimately, VWAP can be an invaluable source of support and resistance; in other words you'll often see price bounce off of a level (whether price is increasing or decreasing) once or multiple times and that could be an indication of a price's direction. Another way that you could utilize this indicator is to use it in confluence with other popular signals, such as an EMA crossover. Many traders will wait till a bar's close on the 5m or 10m time frame above a VWAP level (developing 1D VWAP would be a popular choice) before making a decision on a potential trade especially if price is rising above the 1D VWAP *and* there's been a recent 100 EMA cross UP of the 200 EMA. These are 2 bullish signals that you could look for before possibly entering in to a trade.
I've made this indicator extremely customizable:
⚡Each VWAP level has 2 labels: 1 "at level" and 1 "at right", each label and price can be disabled
⚡Each VWAP label has its own input for label padding. The "at right" label padding input allows you to zoom in and out of a chart without the labels moving along their respective axis. However, the "at level" label padding input doesn't work the same way once you move the label out of the "0" input. The label will move slightly when you zoom in and out
⚡Both "current" and "previous" VWAP levels have their own plot style that can be changed from circles, crosses and lines
⚡Significant figures input allows you to round a price up or down
⚡A price line that allows you to identify where price is in relation to a VWAP level
⚡A table that's color coded the same way as the labels. The labels and table cells change to 1 of 4 colors when "OC Check Mode" is enabled. This theory examines if the VWAP from the Open is above or below the VWAP from Close and if price is above or below normal VWAP (HLC3). This way we have 4 states:
Red = Strong Downtrend
Light Red = Weak Downtrend
Light = Weak Uptrend
Green = Strong Uptrend
Something to keep in mind: At the start of a new year, week or month, some levels will converge and they'll eventually diverge slowly or quickly depending on the level and/or time frame. You could add a few labels "at level" to show which levels are converging at the time. Since we're at the beginning of a new year, you'll see current month, 2 month, 3 month etc converge in to one level.
🙏Thanks to (c)MartinWeb for the inspiration behind this indicator.
🙏Thanks to (c)SimpleCryptoLife for the libraries and code to help create the labels.
Volume Exhaustion [AlgoAlpha]Introducing the Volume Exhaustion by AlgoAlpha, is an innovative tool that aims to identify potential exhaustion or peaks in trading volume , which can be a key indicator for reversals or continuations in market trends 🔶.
Key Features:
Signal Plotting : A special feature is the plotting of 'Release' signals, marked by orange diamonds, indicating points where the exhaustion index crosses under its previous value and is above a certain boundary. This could signify critical market points 🚨.
Calculation Length Customization : Users can adjust the calculation and Signal lengths to suit their trading style, allowing for flexibility in analysis over different time periods. ☝️
len = input(50, "Calculation Length")
len2 = input(8, "Signal Length")
Visual Appeal : The script offers customizable colors (col for the indicator and col1 for the background) enhancing the visual clarity and user experience 💡.
col = input.color(color.white, "Indicator Color")
col1 = input.color(color.gray, "Background Color")
Advanced Volume Processing : At its core, the script utilizes a combination of Hull Moving Average (HMA) and Exponential Moving Average (EMA) applied to the volume data. This sophisticated approach helps in smoothing out the volume data and reducing lag.
sv = ta.hma(volume, len)
ssv = ta.hma(sv, len)
Volume Exhaustion Detection : The script calculates the difference between the volume and its smoothed version, normalizing this value to create an exhaustion index (fff). Positive values of this index suggest potential volume exhaustion.
f = sv-ssv
ff = (f) / (ta.ema(ta.highest(f, len) - ta.lowest(f, len), len)) * 100
fff = ff > 0 ? ff : 0
Boundary and Zero Line : The script includes a boundary line (boundary) and a zero line (zero), with the area between them filled for enhanced visual interpretation. This helps in assessing the relative position of the exhaustion index.
Customizable Background : The script colors the background of the chart for better readability and to distinguish the indicator’s area clearly.
Overall, Volume Exhaustion is designed for traders who focus on volume analysis. It provides a unique perspective on volume trends and potential exhaustion points, which can be crucial for making informed trading decisions. This script is a valuable addition for traders looking to enhance their trading experience with advanced volume analysis tools.

Order Blocks | Flux Charts💎 GENERAL OVERVIEW
Introducing our new Volumized Order Blocks indicator! This new indicator can render order blocks with their volumetric information. It's highly customizable with detection, invalidation and style settings.
Features of the new Volumized Order Blocks indicator :
Render Bullish & Bearish Order Blocks
Enable / Disable Volumetric Information
Enable / Disable Historic Zones
Visual Customizability
📌 HOW DOES IT WORK ?
Order blocks occur when there is a high amount of market orders exist on a price range. It is possible to find order blocks using specific formations on the chart.
The high & low volume of order blocks should be taken into consideration while determining their strengths. The determination of the high & low volume of order blocks are similar to FVGs, in a bullish order block, the high volume is the last 2 bars' total volume, while the low volume is the oldest bar's volume. In a bearish order block scenario, the low volume becomes the last 2 bars' total volume.
🚩UNIQUENESS
The ability to render the total volume of Order Blocks as well as bullish / bearish volume ratio is what sets this Order Block indicator apart from others. Also the ability to combine overlapping Order Block zones will result in cleaner charts for traders.
⚙️SETTINGS
1. General Configuration
Volumetric Info -> The volumetric information of the Order Blocks will be rendered if activated.
Zone Invalidation -> Select between Wick & Close price for Order Block Invalidation.
Swing Length -> Swing length is used when finding order block formations. Smaller values will result in finding smaller order blocks.

Volume Speed [By MUQWISHI]▋ INTRODUCTION :
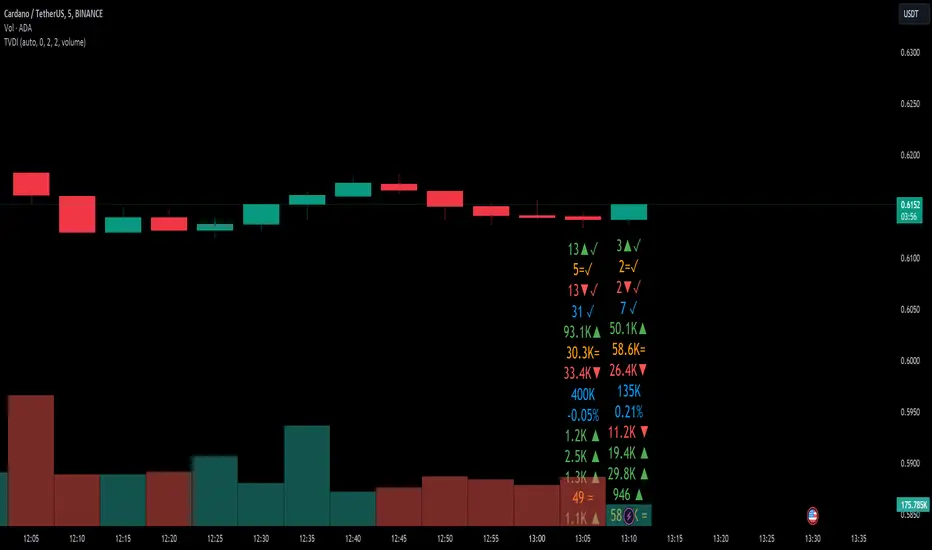
The “Volume Dynamic Scale Bar” is a method for determining the dominance of volume flow over a selected length and timeframe, indicating whether buyers or sellers are in control. In addition, it detects the average speed of volume flow over a specified period. This indicator is almost equivalent to Time & Sales (Tape) .
_______________________
▋ OVERVIEW:
_______________________
▋ ELEMENTS
(1) Volume Dynamic Scale Bar. As we observe, it has similar total up and down volume values to what we're seeing in the table. Note they have similar default inputs.
(2) A notice of a significant volume came.
(3) It estimates the speed of the average volume flow. In the tooltip, it shows the maximum and minimum recorded speeds along with the time since the chart was updated.
(4) Info of entered length and the selected timeframe.
(5) The widget will flash gradually for 3 seconds when there’s a significant volume occurred based on the selected timeframe.
_______________________
▋ INDICATOR SETTINGS:
(1) Timezone.
(2) Widget location and size on chart.
(3) Up & Down volume colors.
(4) Option to enable a visual flash when a single volume is more than {X value} of Average. For instance, 2 → means double the average volume.
(5) Fetch data from the selected lower timeframe.
(6) Number of bars at chosen timeframe.
(7) Volume OR Price Volume.
_____________________
▋ COMMENT:
The Volume Dynamic Scale Bar should not be taken as a major concept to build a trading decision.
Please let me know if you have any questions.
Thank you.

Volume Heatmap 2024 | NXT2017 Christmas EditionHi big players around the world,
I wish you a merry christmas time.
Today I have a nice present for you: a new volume heatmap indicator for free using!
HISTORY
My first volume heatmap project got a lot of feedback and a big demand. You can find it here:
In this time pinescript version 4 was the newest one and I worked the first time with arrays.
Today we have pinescript version 5 and some new features. This is why I tried again with matrix function and the results are better than I expected.
HOW IT WORKS
The indicator calculates similar like the volume profile. It looks back and every volume where the close price is on the same row area, the volume will cumulated. How much rows the new chart view is showing, you can choose manually.
The mind behind this is to find high volume levels, where high volume catch the price in a range or get function as support/resistance line.
PICTURES
I hope it helps for your trading. You are welcome to give some comments.
Merry christmas and best regards
NXT2017

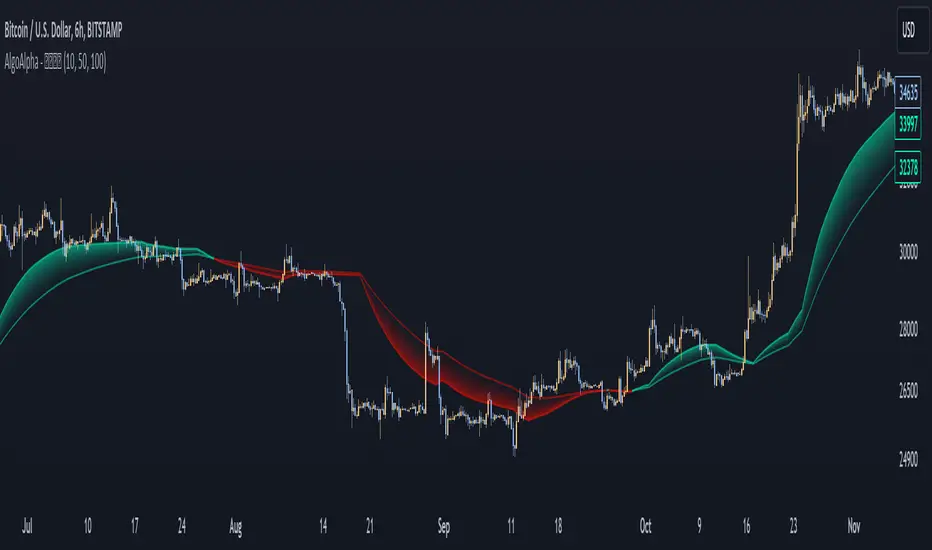
Liquidity Weighted Moving Averages [AlgoAlpha]Description:
The Liquidity Weighted Moving Averages by AlgoAlpha is a unique approach to identifying underlying trends in the market by looking at candle bars with the highest level of liquidity. This script offers a modified version of the classical MA crossover indicator that aims to be less noisy by using liquidity to determine the true fair value of price and where it should place more emphasis on when calculating the average.
Rationale:
It is common knowledge that liquidity makes it harder for market participants to move the price of assets, using this logic, we can determine the coincident liquidity of each bar by looking at the volume divided by the distance between the opening and closing price of that bar. If there is a higher volume but the opening and closing prices are near each other, this means that there was a high level of liquidity in that bar. We then use standard deviations to filter out high spikes of liquidity and record the closing prices on those bars. An average is then applied to these recorded prices only instead of taking the average of every single bar to avoid including outliers in the data processing.
Key features:
Customizable:
Fast Length - the period of the fast-moving average
Slow Length - the period of the slow-moving average
Outlier Threshold Length - the period of the outlier processing algorithm to detect spikes in liquidity
Significant Noise reduction from outliers:
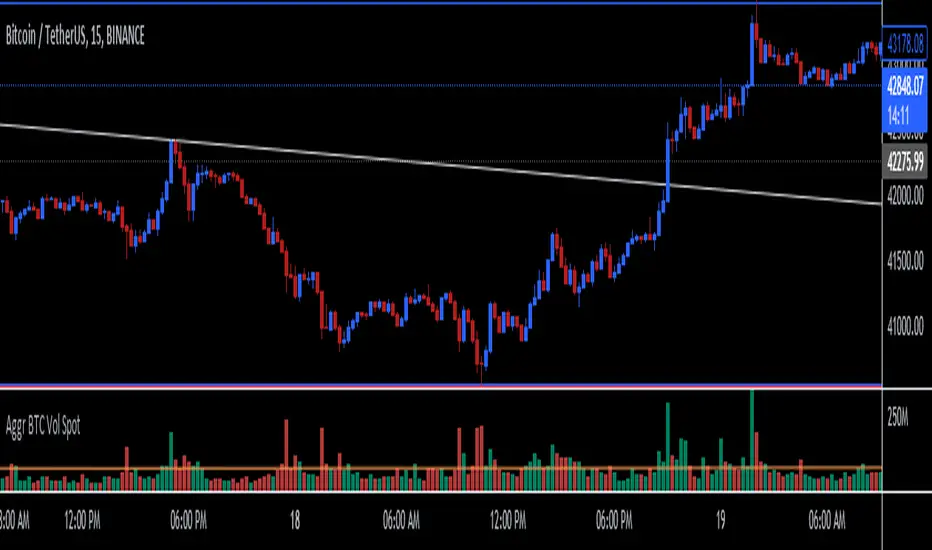
Aggregate BTC Volume Spot - Ma78erAggregate BTC Volume indicator show aggregates trading volumes of Bitcoin from multiple trading platforms.
Exchange Include:
1: Binance - BTC(USDT, USDC, FDUSD, TUSD)
2: Coinbase - BTC(USD, EUR, USDT, GBP)
3: OKX - BTC(USDT, USDC)
4: BYBIT - BTC(USDT, USDC)
5: KUCOIN - BTC(USDT, USDC)
6: KRAKEN - BTC(USD, EUR, USDT, GBP, USDC)
7: Bitfinex - BTC(USD, EUR, GBP)
8: Bitstamp - BTC(USD, EUR, USDT, GBP, USDC)
9: GATEIO - BTC(USDT)
You can also add other exchange in script manually.
Trend Flow Profile [AlgoAlpha]Description:
The "Trend Flow Profile" indicator is a powerful tool designed to analyze and interpret the underlying trends and reversals in a financial market. It combines the concepts of Order Flow and Rate of Change (ROC) to provide valuable insights into market dynamics, momentum, and potential trade opportunities. By integrating these two components, the indicator offers a comprehensive view of market sentiment and price movements, facilitating informed trading decisions.
Rationale:
The combination of Order Flow and ROC in the "Trend Flow Profile" indicator stems from the recognition that both factors play critical roles in understanding market behavior. Order Flow represents the net buying or selling pressure in the market, while ROC measures the rate at which prices change. By merging these elements, the indicator captures the interplay between market participants' actions and the momentum of price movements, enabling traders to identify trends, spot reversals, and gauge the strength of price acceleration or deceleration.
Calculation:
The Order Flow component is computed by summing the volume when prices move up and subtracting the volume when prices move down. This cumulative measure reflects the overall order imbalance in the market, providing insights into the dominant buying or selling pressure.
The ROC component calculates the percentage change in price over a given period. It compares the current price to a previous price and expresses the change as a percentage. This measurement indicates the velocity and direction of price movement, allowing traders to assess the market's momentum.
How to Use It?
The "Trend Flow Profile" indicator offers valuable information to traders for making informed trading decisions. It enables the identification of underlying trends and potential reversals, providing a comprehensive view of market sentiment and momentum. Here are some key ways to utilize the indicator:
Spotting Trends: The indicator helps identify the prevailing market trend, whether bullish or bearish. A consistent positive (green) histogram indicates a strong uptrend, while a consistent negative (red) histogram suggests a robust downtrend.
Reversal Signals: Reversal patterns can be identified when the histogram changes color, transitioning from positive to negative (or vice versa). These reversals can signify potential turning points in the market, highlighting opportunities for counter-trend trades.
Momentum Assessment: By observing the width and intensity of the histogram, traders can assess the acceleration or deceleration of price momentum. A wider histogram suggests strong momentum, while a narrower histogram indicates a potential slowdown.
Utility:
The "Trend Flow Profile" indicator serves as a valuable tool for traders, providing several benefits. Traders can easily identify the prevailing market trend, enabling them to align their trading strategies with the dominant direction of the market. The indicator also helps spot potential reversals, allowing traders to anticipate market turning points and capture counter-trend opportunities. Additionally, the green and red histogram colors provide visual cues to determine the optimal duration of a long or short position. Following the green histogram signals when in a long position and the red histogram signals when in a short position can assist traders in managing their trades effectively. Moreover, the width and intensity of the histogram offer insights into the acceleration or deceleration of momentum. Traders can gauge the strength of price movements and adjust their trading strategies accordingly. By leveraging the "Trend Flow Profile" indicator, traders gain a comprehensive understanding of market dynamics, which enhances their decision-making and improves their overall trading outcomes.

Normalized Fisher Transformed VolumeGreetings Traders,
I am thrilled to introduce a game-changing tool that I've passionately developed to enhance your trading precision – the Normalized Fisher Transformed Volume indicator. Let's dive into the specifics and explore how this tool can empower you in the markets.
Unlocking Trading Precision:
Normalization and Transformation:
Normalize raw volume data to ensure a consistent scale for analysis.
The Fisher Transformation converts normalized volume data into a Gaussian distribution, providing enhanced insights into trend dynamics.
Flexible Modes for Tailored Strategies:
Choose from three distinct modes:
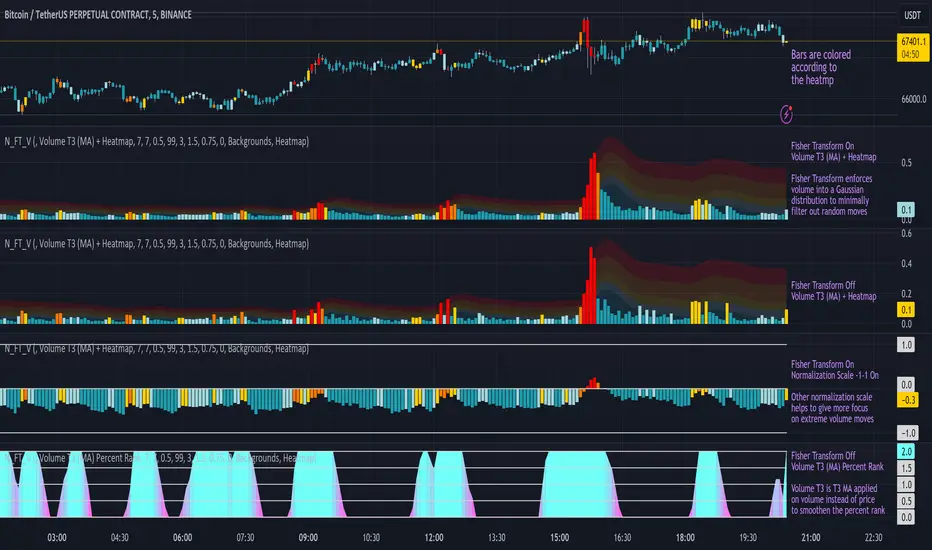
Volume T3 (MA) + Heatmap: Identify trends with T3 Moving Average and visualize volume strength with Heatmap.
Volume Percent Rank: Evaluate the position of current volume relative to historical data.
Volume T3 (MA) Percent Rank: Combine T3 Moving Average with percentile ranking for a comprehensive analysis.
Heatmap Visualization for Quick Insights:
Heatmap Zones and Lines visually represent volume strength relative to historical data.
Customize threshold multipliers and color options for precise Heatmap interpretation.
T3 Moving Average Integration:
Smoothed representation of volume trends with the T3 Moving Average enhances trend identification.
Percent Rank Analysis for Context:
Gauge the position of normalized volume within historical context using Percent Rank analysis.
User-Friendly Customization:
Easily adjust parameters such as length, T3 Moving Average length, Heatmap standard deviation length, and threshold multipliers.
Intuitive interface with colored bars and customizable background options for personalized analysis.
How to Use Effectively:
Mode Selection:
Identify your preferred trading strategy and select the mode that aligns with your approach.
Parameter Adjustment:
Fine-tune the indicator by adjusting parameters to match your preferred trading style.
Interpret Heatmap and T3 Analysis:
Leverage Heatmap and T3 Moving Average analysis to spot potential trend reversals, overbought/oversold conditions, and market sentiment shifts.
Conclusion:
The Normalized Fisher Transformed Volume indicator is not just a tool; it's your key to unlocking precision in trading. Crafted by Simwai, this indicator offers unique insights tailored to your specific trading needs. Dive in, explore its features, experiment with parameters, and let it guide you to more informed and precise trading decisions.
Trade wisely and prosper,
simwai
High volume candles.
High Volume Candles Indicator:
This is a simple tool that shows you when there's a lot of action in the market. It highlights the candles with the highest trading volume on your chart.
What It Does:
Picks the Busiest Candle: It points out the candle with the most trading in your set time.
Shows Buying and Selling: Green for lots of buying, red for lots of selling.
You Choose the Time Frame: Whether it's a few candles or many, it's up to you.
Best Part - Alerts:
Get Notified: The cool thing? It'll alert you when these big volume candles happen. You won't miss the important moments.
Use this to keep track of when things are really moving in the market, without having to watch your screen all the time.

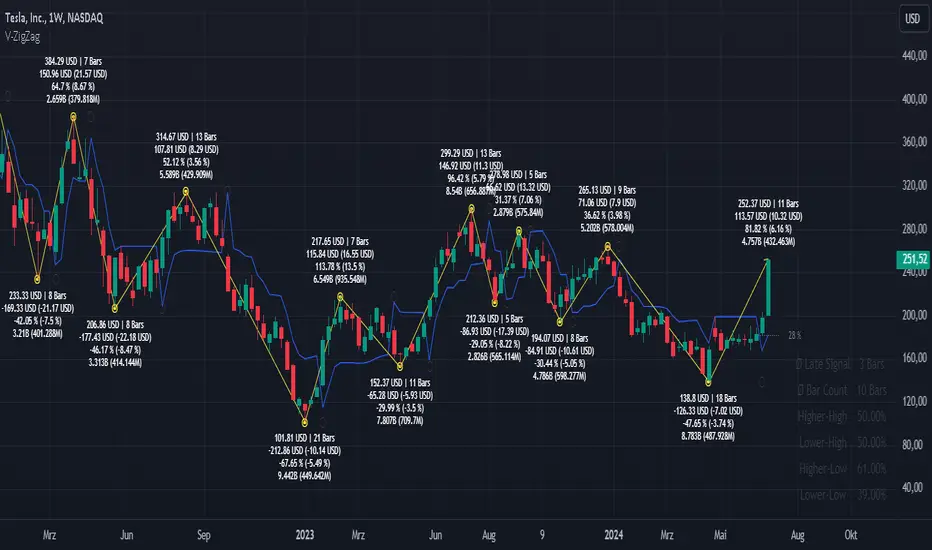
Volatility ZigZagIt calculates and plots zigzag lines based on volatility and price movements. It has various inputs for customization, allowing you to adjust parameters like source data, length, deviation, line styling, and labeling options.
The indicator identifies pivot points in the price movement, drawing lines between these pivots based on the deviation from certain price levels or volatility measures.
The script labels various data points at the ZigZag pivot points on the chart. These labels provide information about different aspects of the price movement and volume around these pivot points. Here's a breakdown of what gets labeled:
Price Change: Indicates the absolute and average percentage change between the two pivot points. It displays the absolute or relative change in price as a percentage. Additionally, the average absolute price increase or the average rate of increase can also be labeled.
Volume: Shows the total volume and average volume between the two pivot points.
Number of Bars: Indicates the number of bars between the current and the last pivot point.
Reversal Price: Displays the price of the reversal point (the previous pivot).
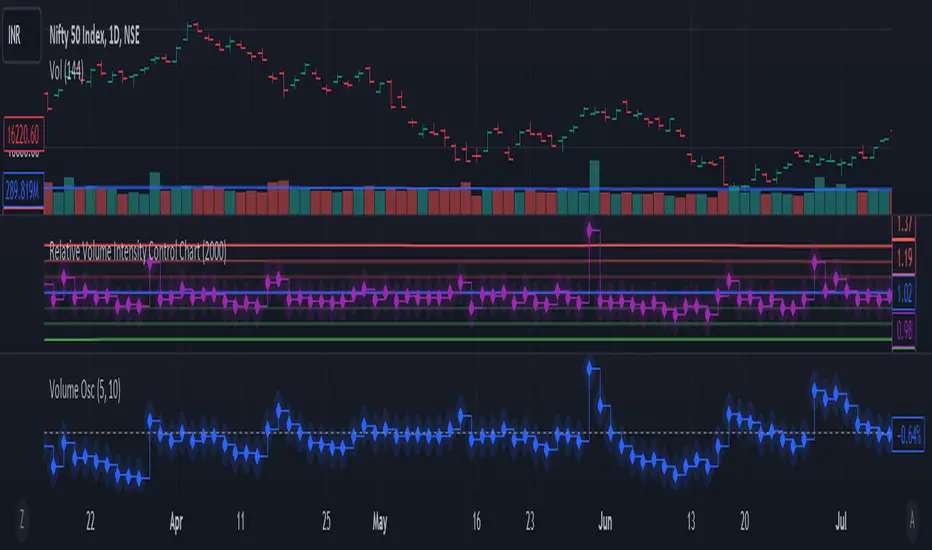
Relative Volume Intensity Control Chart***NOTE THE VOLUME OSCILATOR PROVIDED AT THE BOTTOM IS FOR COMPARSION AND IS NOT PART OF THE INDICATOR****
This indicator provides a comprehensive and a nuanced representation of volume relative to historical volume. The indicator aims to provide insights into the relative intensity of trading volume compared to historical data. It calculates two types of relative volume intensity: mean volume intensity and point volume intensity. The final indicator, "Relative_volume_intensity," is a combination of these two.
1. Point Volume Intensity:
Calculate the ratio of the current volume to the corresponding SMA from the previous period for each of the periods.
Normalize each ratio by dividing it by the corresponding normalized SMA.
Assign weights to each normalized ratio and calculate the point volume intensity.
Point volume intensity calculates the intensity of the current trading volume at a specific point in time relative to its historical moving average. It assesses how much the current volume deviates from the previous historical average for different lookback periods(current volume/ average volume of previous n days). The calculation involves dividing the current volume by the corresponding previous historical moving average and normalizing the result. The purpose of point volume intensity is to capture the immediate impact of the current volume on the overall intensity, providing a more dynamic and responsive measure.
2. Mean Volume Intensity:
Calculate the simple moving averages (SMA) of the volume for different periods (5, 8, 13, 21, 34, 55, 89, 144).
Normalize each SMA by dividing it by the SMA with the longest lookback (144).
Assign weights to each normalized SMA and calculate the mean volume intensity.
Mean volume intensity, on the other hand, takes a broader approach by looking at the mean (average) of various historical moving averages of volume. Instead of focusing on the current volume alone, it considers the historical average intensity over multiple periods. The purpose of mean volume intensity is to provide a smoother and more stable representation of the overall historical volume intensity. It helps filter out short-term fluctuations and provides a more comprehensive view of how the current volume compares to historical norms.
Purpose of Both:
Both point volume intensity and mean volume intensity contribute to the calculation of the final indicator, "Relative_volume_intensity." The idea is to combine these two perspectives to create a more comprehensive measure of relative volume intensity. By assigning equal weights to both components and taking a balanced approach, the indicator aims to capture both short-term spikes in volume and trends in volume intensity over a relatively extended periods.
In calculation of both point volume intensity and mean volume intensity, shorter-term moving averages (e.g., 5, 8) have higher weights, suggesting a greater emphasis on recent volume behavior.
Visualization:
The script then calculates the mean and standard deviation of the relative volume intensity over a specified lookback length.
Plot lines for the centerline (mean), upper and lower 3 standard deviations, upper and lower 2 standard deviations, and upper and lower 1 standard deviation.
Plot the relative volume intensity as a step line with diamond markers.
It is displayed like a control chart where we can see how the relative intensity is behaving when compared to longer historical lookback period.
Logarithmic CVD [IkkeOmar]The LCVD is another Mean-Reversion Indicator. it doesn't detect trends and does not give a signal per se. However the logarithmic transformation is made to visualize the direction of the trend for the volume. This allows you to see if money is flowing in or out of an asset.
What it does is tell you if we have a flashcrash based on the difference in volume.
Think of this indicator like a form of a volatility index.
Smoothing input:
The only input is an input for the smoothing length of the logDelta.
Volume Calculation:
// @IkkeOmar
//@version=5
indicator('Logarithmic CVD', shorttitle='CVD', overlay=false)
smooth = input.int(defval = 25, title = "Smoothing Distance")
// Calculate buying and selling volume
askVolume = volume * (close > open ? 1 : 0) // Assuming higher close than open indicates buying
bidVolume = volume * (close < open ? 1 : 0) // Assuming lower close than open indicates selling
// Delta is the difference between buying and selling volume
delta = askVolume - bidVolume
// Apply logarithmic transformation to delta
// Adding a check to ensure delta is not zero as log(0) is undefined
logDelta = delta > 0 ? math.log(math.abs(delta)) * math.sign(delta) : - math.log(math.abs(delta)) * math.sign(delta)
// use the the ta lib for calculating the sma of the logDelta
smoothLogDelta = ta.sma(logDelta, smooth)
// Create candlestick plot
plot(logDelta, color= color.green, title='Logarithmic CVD')
plot(smoothLogDelta, color= color.rgb(145, 37, 1), title='Smooth CVD')
These lines calculate the buying and selling volumes. askVolume is calculated as the total volume when the closing price is higher than the opening price, assuming this indicates buying pressure. bidVolume is calculated as the total volume when the closing price is lower than the opening price, assuming selling pressure.
The Delta is simply the difference between buying and selling volumes.
Logarithmic Transformation:
logDelta = delta > 0 ? math.log(math.abs(delta)) * math.sign(delta) : - math.log(math.abs(delta)) * math.sign(delta)
Applies a logarithmic transformation to delta. The math.log function is used to calculate the natural logarithm of the absolute value of delta. The sign of delta is preserved to differentiate between positive and negative values. This transformation helps in scaling the delta values, especially useful when dealing with large numbers.
This script essentially provides a visual representation of the buying and selling pressures in a market, transformed logarithmically for better scaling and smoothed for trend analysis.
Hope it makes sense!
Stay safe everyone!
Don't hesitate to ask any questions if you have any!

Tick Volume Direction IndicatorTick Volume Direction Indicator
This indicator captures:
• tick volume
• tick direction
The settings are as follows:
• volume or base currency value selection.
• label distance (away from the low of the candle).
• Tick volume - on/off switch for tick volume.
• label size.
• Up tick move color.
• tick move absorbed - when the tick doesn't change position.
• Down tick move.
On the first initial load, it will have the existing volume data as "?" as tradingview doesn't have a history of each tick.
Be aware, any settings change you make will refresh the tick data from start.
This indicator is one of the best real-time ways of seeing buying and selling pressure.
Relative Volume Candles [QuantVue]In the words of Dan Zanger, "Trying to trade without using volume is like trying to drive a few hundred miles without putting gas in your tank. Trying to trade without chart patterns is like leaving without having an idea how to get there!"
Volume tends to show up at the beginning and the end of trends. As a general rule, when a stock goes up on low volume, it's seen as negative because it means buyers aren't committed. When a stock goes down on low volume, it means that not many people are trying to sell it, which is positive.
The Relative Volume Candles indicator is based on the Zanger Volume Ratio and designed to help identify key volume patterns effortlessly, with color coded candles and wicks.
The indicator is designed to be used on charts less than 1 Day and calculates the average volume for the user selected lookback period at the given time of day. From there a ratio of the current volume vs the average volume is used to determine the candle’s colors.
The candles wicks are color coded based on whether or not the volume ratio is rising or falling.
So when is it most important to have volume? When prices break out of a consolidation pattern like a bull flag or cup and handle pattern, volume plays a role. When a stock moves out of a range, volume shows how committed buyers are to that move.
Note in order to see this indicator you will need to change the visual order. This is done by selecting the the 3 dots next to the indicator name, scrolling down to visual order and selecting bring to front.
Indicator Features
🔹Selectable candle colors
🔹Selectable ratio levels
🔹Custom lookback period***
***TradingView has a maximum 5,000 bar lookback for most plans. If you are on a lower time frame chart and you select a lookback period larger than 5,000 bars the indicator will not show and you will need to select a shorter lookback period or move to a higher time frame chart.
Give this indicator a BOOST and COMMENT your thoughts!
We hope you enjoy.
Cheers!

Time & Sales (Tape) [By MUQWISHI]▋ INTRODUCTION :
The “Time and Sales” (Tape) indicator generates trade data, including time, direction, price, and volume for each executed trade on an exchange. This information is typically delivered in real-time on a tick-by-tick basis or lower timeframe, providing insights into the traded size for a specific security.
_______________________
▋ OVERVIEW:
_______________________
▋ Volume Dynamic Scale Bar:
It's a way for determining dominance on the time and sales table, depending on the selected length (number of rows), indicating whether buyers or sellers are in control in selected length.
_______________________
▋ INDICATOR SETTINGS:
#Section One: Table Settings
#Section Two: Technical Settings
(1) Implement By: Retrieve data by
(1A) Lower Timeframe: Fetch data from the selected lower timeframe.
(1B) Live Tick: Fetch data in real-time on a tick-by-tick basis, capturing data as soon as it's observed by the system.
(2) Length (Number of Rows): User able to select number of rows.
(3) Size Type: Volume OR Price Volume.
_____________________
▋ COMMENT:
The values in a table should not be taken as a major concept to build a trading decision.
Please let me know if you have any questions.
Thank you.

SaAy New Volume ComputationOverview of the Indicator
The "SaAy New Volume Computation" is a trading tool designed to give traders a clear understanding of market volume movements. It overlays on the main trading chart, providing insights into buying and selling pressures.
Key Features of the Indicator
Up and Down Volume Analysis
Buying Pressure (Up Volume) : This metric totals the trading volume on days when the market closes higher than it opens, indicating a bullish or positive market sentiment.
Selling Pressure (Down Volume) : Conversely, this measures the trading volume on days when the market closes lower than it opens, reflecting a bearish or negative sentiment.
Comparative Volume Analysis
Average Volume Comparison : The indicator also compares recent trading volume with the average volume over a set period. This comparison helps identify whether the current trading volume is unusually high or low compared to normal conditions.
Practical Use for Traders
Market Sentiment Understanding : By analyzing the up and down volumes, traders can get a sense of whether the market is dominated by buyers (bulls) or sellers (bears).
Volume Trend Identification: Comparing current trading volumes with the average volume can help traders spot trends or significant changes in market activity. For example, a higher than average volume on a day with rising prices might suggest strong buying interest and a possible continuation of the upward trend.
Conclusion
Overall, the "SaAy New Volume Computation" indicator is a valuable tool for traders. It simplifies the complex task of volume analysis, providing easy-to-understand metrics that indicate market trends and trader sentiment. This can help traders make more informed decisions and better understand the dynamics of the markets they are trading in.

Volume Profile PlusThis indicator provides a high-resolution and high-precision implementation of Volume Profile with flexible range settings. Its key features include:
1. Support for a high resolution of up to 2,500 rows.
2. Capability to examine lower timeframe bars (default 5,000 intra-bars) for enhanced precision.
3. Three range modes — "Visible Range", "Anchored Range", and "All Range".
4. Highlighting of Point of Control and Value Area.
5. Extensive customization options allowing users to configure dimensions, on-chart placements, and color schemes.
🔵 Settings
The settings screen, along with the explanations for each setting, is provided below:
🔵 High Resolution using Polyline
Inspired by @fikira, this indicator utilizes the newly introduced `polyline` type in PineScript to plot the volume profile. It employs a single polyline instance to represent the entire histogram. With each polyline instance supporting up to 10,000 points and each histogram row requiring 4 points, this indicator can accommodate 2500 rows, resulting in a significantly higher resolution compared to conventional volume profile indicators that use `line`s or `box`es to draw the histogram.
🔵 High Precision Data-binning using Lower Timeframe Data
Conventional volume profile indicators often face one or both of the following limitations:
1. They only consider volume within the chart's current timeframe.
2. They assign each bar's total volume to a single price bucket based on the bar's average price, rather than distributing volume across multiple price buckets.
As a result, when the number of bars in the chart is low, those indicators may provide imprecise results, making it difficult to accurately identify significant volume nodes and the point of control.
To address these limitations and enhance accuracy, this indicator examines data from lower timeframes and distributes the volume to fine-grained price buckets. It intelligently selects an appropriate lower timeframe to ensure precise output while complying with a maximum specified number of bars to maintain good performance.
🔵 Three Range Modes
This indicator offers users the flexibility to choose from three range modes:
1. Visible Range (Default Mode): In this mode, the volume profile calculation begins at the time of the left-most bar displayed in the current viewport. As the user scrolls through the viewport, the volume profile updates automatically.
2. Anchored Range: This mode allows the user to set the start time either by using the datetime input boxes or by dragging the anchor line on the chart.
3. All Range: In this mode, the volume profile calculation is based on all the historical bars available in the chart.

SessionVolumeProfileLibrary "SessionVolumeProfile"
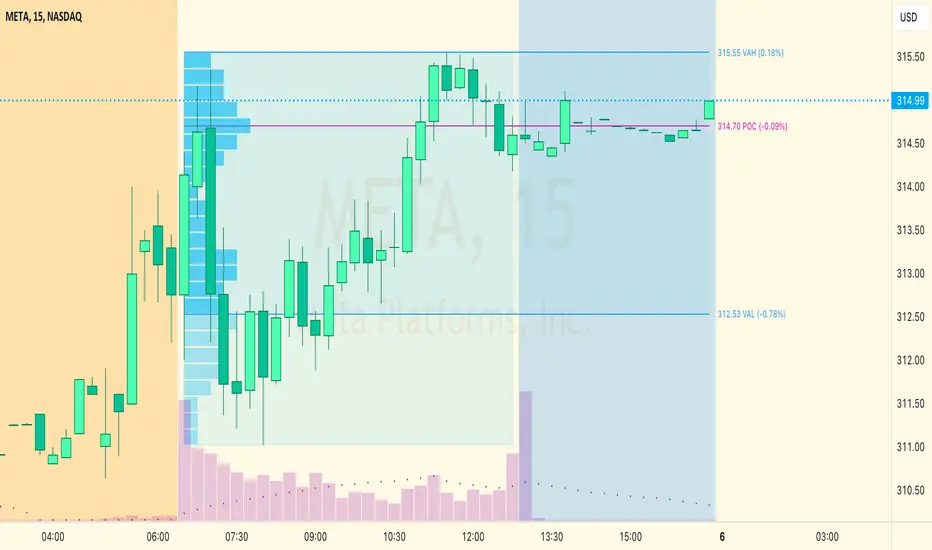
Analyzes price & volume during regular trading hours to provide a session volume profile analysis. The primary goal of this library is to provide the developer with three values: the value area high, low and the point of control. The library also provides methods for rendering the value areas and histograms. To learn more about this library and how you can use it, click on the website link in my profile where you will find a blog post with detailed information.
debug(vp, position)
Helper function to write some information about the supplied SVP object to the screen in a table.
Parameters:
vp (Object) : The SVP object to debug
position (string) : The position.* to place the table. Defaults to position.bottom_center
getLowerTimeframe()
Depending on the timeframe of the chart, determines a lower timeframe to grab volume data from for the analysis
Returns: The timeframe string to fetch volume for
get(volumeProfile, lowerTimeframeHigh, lowerTimeframeLow, lowerTimeframeVolume)
Populated the provided SessionVolumeProfile object with vp data on the session.
Parameters:
volumeProfile (Object) : The SessionVolumeProfile object to populate
lowerTimeframeHigh (float ) : The lower timeframe high values
lowerTimeframeLow (float ) : The lower timeframe low values
lowerTimeframeVolume (float ) : The lower timeframe volume values
drawPriorValueAreas(todaySessionVolumeProfile, extendYesterdayOverToday, showLabels, labelSize, pocColor, pocStyle, pocWidth, vahlColor, vahlStyle, vahlWidth, vaColor)
Given a SessionVolumeProfile Object, will render the historical value areas for that object.
Parameters:
todaySessionVolumeProfile (Object) : The SessionVolumeProfile Object to draw
extendYesterdayOverToday (bool) : Defaults to true
showLabels (bool) : Defaults to true
labelSize (string) : Defaults to size.small
pocColor (color) : Defaults to #e500a4
pocStyle (string) : Defaults to line.style_solid
pocWidth (int) : Defaults to 1
vahlColor (color) : The color of the value area high/low lines. Defaults to #1592e6
vahlStyle (string) : The style of the value area high/low lines. Defaults to line.style_solid
vahlWidth (int) : The width of the value area high/low lines. Defaults to 1
vaColor (color) : The color of the value area background. Defaults to #00bbf911)
drawHistogram(volumeProfile, bgColor, showVolumeOnHistogram)
Given a SessionVolumeProfile object, will render the histogram for that object.
Parameters:
volumeProfile (Object) : The SessionVolumeProfile object to draw
bgColor (color) : The baseline color to use for the histogram. Defaults to #00bbf9
showVolumeOnHistogram (bool) : Show the volume amount on the histogram bars. Defaults to false.
Object
Fields:
numberOfRows (series__integer)
valueAreaCoverage (series__integer)
trackDevelopingVa (series__bool)
valueAreaHigh (series__float)
pointOfControl (series__float)
valueAreaLow (series__float)
startTime (series__integer)
endTime (series__integer)
dayHigh (series__float)
dayLow (series__float)
step (series__float)
pointOfControlLevel (series__integer)
valueAreaHighLevel (series__integer)
valueAreaLowLevel (series__integer)
volumeRows (array__float)
priceLevelRows (array__float)
ltfSessionHighs (array__float)
ltfSessionLows (array__float)
ltfSessionVols (array__float)
Candle volume analysis The indicator is designed for traders who are more interested in market structures and price action using volumes. Volume analysis can help traders build a clearer understanding of zones of buyer and seller interest, as well as places to capture liquidity (traders' stop levels).
Key Features:
The indicator highlights candle volumes in selected colors, where the volume is greater individually than the volumes of the trader's chosen number of preceding candles. Or the volume that is greater than the sum of volumes of the trader's chosen number of preceding candles.
