Let's start with the Daily View:

a) We can see 3 relevant horizontal levels. Those are the main areas we will be paying attention to. Now the price is above a resistance zone (working as support), and we will aim for a bullish movement towards the next resistance zone.
b) Another important item is a Huge Corrective Structure that has been broken (Bullish Signal)
Now we will go to the 1H chart:
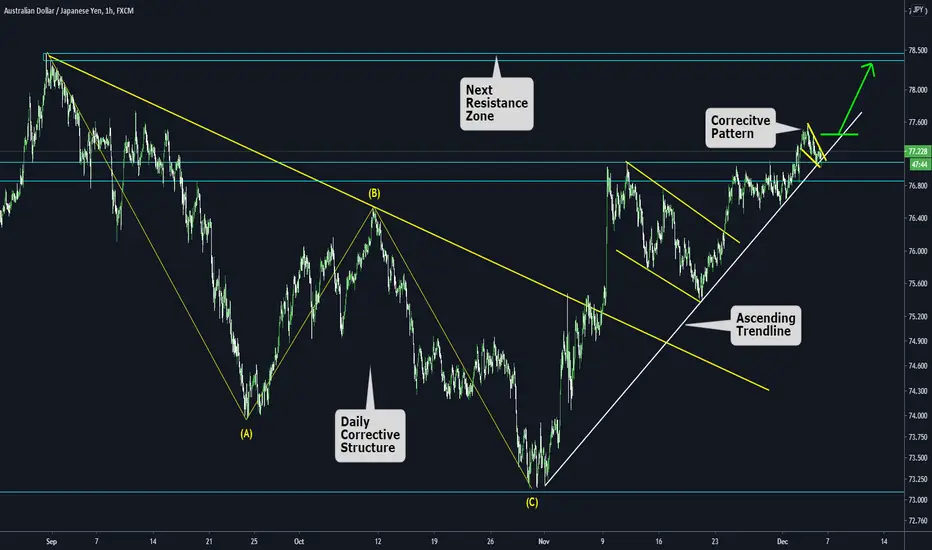
a) We can see the clear breakout of the Daily corrective Structure ABC pattern.
b) The price now is above the resistance zone, supporting a small corrective pattern + the Ascending trendline supporting the corrective pattern.
c) Based on those items, we expect a continuation of the bullish movement towards the next resistance zone.
a) We can see 3 relevant horizontal levels. Those are the main areas we will be paying attention to. Now the price is above a resistance zone (working as support), and we will aim for a bullish movement towards the next resistance zone.
b) Another important item is a Huge Corrective Structure that has been broken (Bullish Signal)
Now we will go to the 1H chart:
a) We can see the clear breakout of the Daily corrective Structure ABC pattern.
b) The price now is above the resistance zone, supporting a small corrective pattern + the Ascending trendline supporting the corrective pattern.
c) Based on those items, we expect a continuation of the bullish movement towards the next resistance zone.
Declinazione di responsabilità
Le informazioni e le pubblicazioni non sono intese come, e non costituiscono, consulenza o raccomandazioni finanziarie, di investimento, di trading o di altro tipo fornite o approvate da TradingView. Per ulteriori informazioni, consultare i Termini di utilizzo.
Declinazione di responsabilità
Le informazioni e le pubblicazioni non sono intese come, e non costituiscono, consulenza o raccomandazioni finanziarie, di investimento, di trading o di altro tipo fornite o approvate da TradingView. Per ulteriori informazioni, consultare i Termini di utilizzo.