Bitcoin Technical Analysis: Consolidation Phase Before Breakout – Key Levels to Watch 📈💰
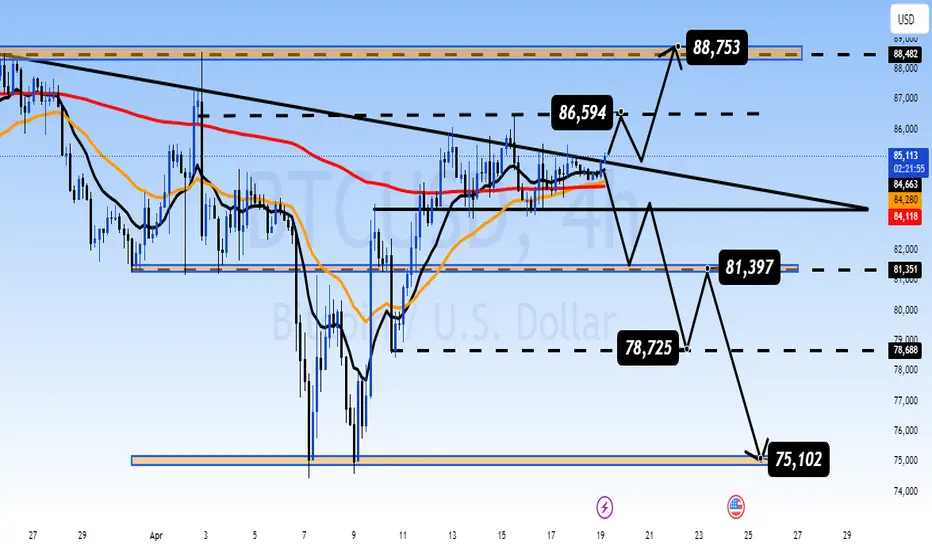
Market Overview: Bitcoin (BTC/USD) is currently navigating through a consolidation phase, forming a symmetrical triangle pattern on the 4-hour chart. The price action has been fluctuating between significant resistance at 86,594 and support at 78,725. As we approach the apex of the triangle, volatility is expected to rise, and a breakout from this range could set the direction for the next major move in Bitcoin's price.
Key Technical Levels:
Resistance: 86,594, 88,753
Support: 78,725, 75,102
Technical Indicators:
Bitcoin is holding above both the 50-day and 200-day moving averages (MA), confirming the overall bullish structure in the market. The price’s proximity to key resistance levels suggests that BTC is preparing for either a breakout or a pullback.
Currently, BTC is testing the upper trendline of the triangle, which means the market is gearing up for a potential decisive move. A break above the 86,594 level could send the price toward 88,753, and potentially higher, with 91,000 as a psychological target.
Chart Analysis:
Symmetrical Triangle Pattern: Bitcoin’s price movement has been restricted within the triangle’s boundaries. If the price breaks the 86,594 resistance, we could see BTC push to 88,753, and possibly even 91,000. However, if the breakout fails, BTC might retrace to the support levels at 78,725 or 75,102, which could provide better entry points for long positions.
The formation of the triangle indicates that the market is waiting for a clear direction. A breakout will likely be followed by a sharp movement either upwards or downwards, so traders should be prepared for a spike in volatility.
Macro Factors and Market Sentiment:
Geopolitical Tensions and Economic Uncertainty: The ongoing geopolitical tensions between major global economies, particularly the U.S. and China, have increased demand for safe-haven assets like Bitcoin. In addition, global inflation concerns continue to push investors toward digital gold as a store of value.
U.S. Federal Reserve Policies: The Fed’s actions regarding interest rates and monetary policy will have a direct impact on Bitcoin’s price. Any dovish stance or indications of more easing could benefit Bitcoin, as it is seen as a hedge against inflation and currency devaluation.
Market Outlook:
Bullish Scenario: A breakout above 86,594 could lead Bitcoin towards 88,753 and potentially 91,000. With Bitcoin’s bullish setup and safe-haven status, the next move might be strongly in favor of the bulls.
Bearish Scenario: If Bitcoin fails to break through resistance, we might see a retracement towards the support zones at 78,725 or 75,102, where buying opportunities may arise.
Trading Strategy:
BUY Zone: 78,725 - 75,102 (Look for a confirmation above support levels)
SELL Zone: 86,594 - 88,753 (Watch for a breakout above resistance for further upside)
Conclusion:
Bitcoin’s current consolidation phase has set the stage for a potential breakout. The price is testing crucial resistance levels, and the next few days could determine whether BTC will make a new push towards ATHs or pull back to retest lower levels. With the broader economic and geopolitical conditions favoring Bitcoin as a hedge, the long-term outlook remains bullish, but short-term volatility is expected.
⚜️Trade with Money Market Flow, logic, Price action
🔥Live Market Updates-Realtime Trading Plans & Signal
t.me/+vpD6XCC9jP05ZDQ1
⚜️Risk Reward 1.3 to 2.5...
⚜️Daily 8 to 16 Signals VIP
MMFLOW gives you precision entries & BIGWIN profits
🔥Live Market Updates-Realtime Trading Plans & Signal
t.me/+vpD6XCC9jP05ZDQ1
⚜️Risk Reward 1.3 to 2.5...
⚜️Daily 8 to 16 Signals VIP
MMFLOW gives you precision entries & BIGWIN profits
Declinazione di responsabilità
Le informazioni e le pubblicazioni non sono intese come, e non costituiscono, consulenza o raccomandazioni finanziarie, di investimento, di trading o di altro tipo fornite o approvate da TradingView. Per ulteriori informazioni, consultare i Termini di utilizzo.