📊 Daily Support & Resistance Levels
Support Levels:
S1: ₹91.43
S2: ₹90.93
S3: ₹90.14
S4: ₹88.93
Resistance Levels:
R1: ₹92.14
R2: ₹92.93
R3: ₹94.14
R4: ₹94.93
These levels are derived from standard pivot point calculations and serve as potential zones where price action may encounter support or resistance.
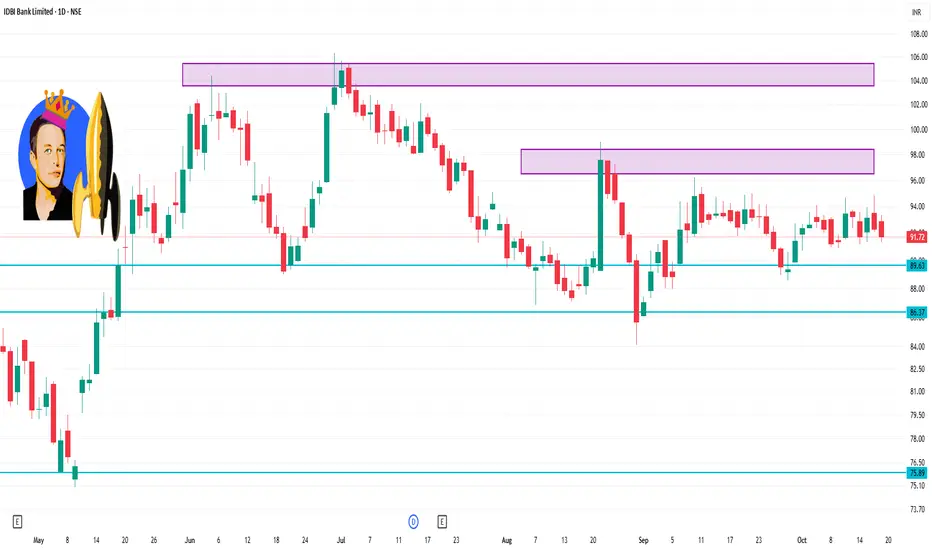
🔍 Current Price Action
Last Traded Price: ₹91.72 (as of October 17, 2025)
Recent Trend: The stock has been trading below the pivot point of ₹92.80, indicating a bearish short-term trend.
Key Levels to Watch:
Immediate Support: ₹91.69 (S1)
Immediate Resistance: ₹94.25 (R1)
Breakout Point: A move above ₹94.25 could signal a potential reversal to the upside.
Support Levels:
S1: ₹91.43
S2: ₹90.93
S3: ₹90.14
S4: ₹88.93
Resistance Levels:
R1: ₹92.14
R2: ₹92.93
R3: ₹94.14
R4: ₹94.93
These levels are derived from standard pivot point calculations and serve as potential zones where price action may encounter support or resistance.
🔍 Current Price Action
Last Traded Price: ₹91.72 (as of October 17, 2025)
Recent Trend: The stock has been trading below the pivot point of ₹92.80, indicating a bearish short-term trend.
Key Levels to Watch:
Immediate Support: ₹91.69 (S1)
Immediate Resistance: ₹94.25 (R1)
Breakout Point: A move above ₹94.25 could signal a potential reversal to the upside.
Pubblicazioni correlate
Declinazione di responsabilità
Le informazioni ed i contenuti pubblicati non costituiscono in alcun modo una sollecitazione ad investire o ad operare nei mercati finanziari. Non sono inoltre fornite o supportate da TradingView. Maggiori dettagli nelle Condizioni d'uso.
Pubblicazioni correlate
Declinazione di responsabilità
Le informazioni ed i contenuti pubblicati non costituiscono in alcun modo una sollecitazione ad investire o ad operare nei mercati finanziari. Non sono inoltre fornite o supportate da TradingView. Maggiori dettagli nelle Condizioni d'uso.