📊 Key Levels for Nifty 50 (Daily Timeframe)
Resistance Levels:
R1: 25,471.52
R2: 25,519.43
R3: 25,590.32
Support Levels:
S1: 25,352.72
S2: 25,281.83
S3: 25,233.92
These levels are derived from classic pivot point calculations based on the previous day's price range.
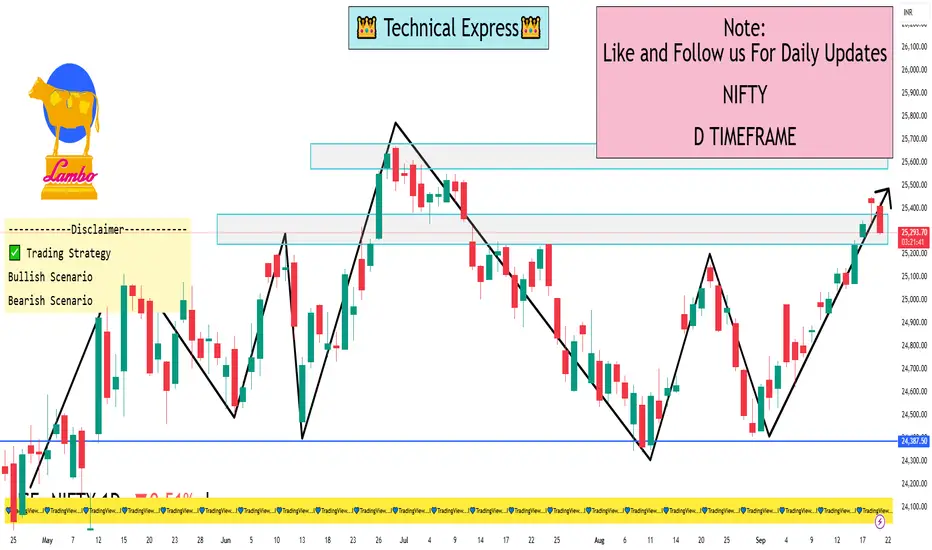
🔄 Trend Analysis
Short-Term Trend: The Nifty 50 has formed a higher top and higher bottom pattern on the daily chart, indicating a bullish trend.
Moving Averages: The index is trading above its 20, 50, 100, and 200-day moving averages, suggesting a bullish momentum.
⚠️ Market Sentiment
Despite the positive technical indicators, the SGX Nifty (Gift Nifty) is showing signs of a negative start, which may influence the market's direction at the open.
✅ Trading Strategy
Bullish Scenario: A sustained move above 25,500 could lead to a retest of the June high at 25,669.
Bearish Scenario: A decline below 25,350 may signal a short-term correction.
Resistance Levels:
R1: 25,471.52
R2: 25,519.43
R3: 25,590.32
Support Levels:
S1: 25,352.72
S2: 25,281.83
S3: 25,233.92
These levels are derived from classic pivot point calculations based on the previous day's price range.
🔄 Trend Analysis
Short-Term Trend: The Nifty 50 has formed a higher top and higher bottom pattern on the daily chart, indicating a bullish trend.
Moving Averages: The index is trading above its 20, 50, 100, and 200-day moving averages, suggesting a bullish momentum.
⚠️ Market Sentiment
Despite the positive technical indicators, the SGX Nifty (Gift Nifty) is showing signs of a negative start, which may influence the market's direction at the open.
✅ Trading Strategy
Bullish Scenario: A sustained move above 25,500 could lead to a retest of the June high at 25,669.
Bearish Scenario: A decline below 25,350 may signal a short-term correction.
I built a Buy & Sell Signal Indicator with 85% accuracy.
📈 Get access via DM or
WhatsApp: wa.link/d997q0
Contact - +91 76782 40962
| Email: techncialexpress@gmail.com
| Script Coder | Trader | Investor | From India
📈 Get access via DM or
WhatsApp: wa.link/d997q0
Contact - +91 76782 40962
| Email: techncialexpress@gmail.com
| Script Coder | Trader | Investor | From India
Pubblicazioni correlate
Declinazione di responsabilità
Le informazioni e le pubblicazioni non sono intese come, e non costituiscono, consulenza o raccomandazioni finanziarie, di investimento, di trading o di altro tipo fornite o approvate da TradingView. Per ulteriori informazioni, consultare i Termini di utilizzo.