🔥 Welcome FireHoseReel !
Let’s dive into the analysis of Four major crypto Index.
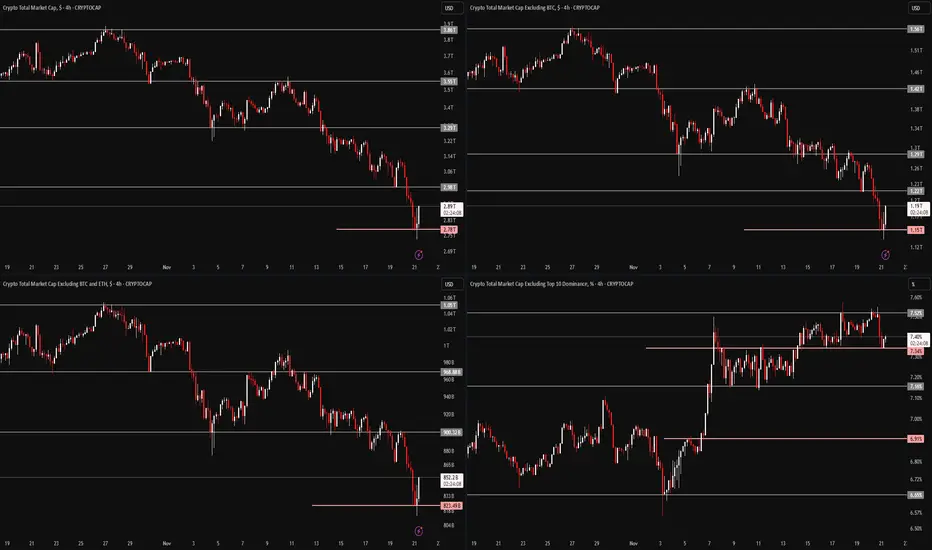
🔶 TOTAL (Crypto Market Cap) – 4H Timeframe

On the 4-hour timeframe of TOTAL, we can see a strong correlation with Bitcoin’s chart. After approaching the $4T zone, the total market cap went through a deep correction, testing multiple support levels and eventually breaking them.
It’s now sitting around $2.78T, marking a $1 trillion drop, which is something unprecedented in the crypto market.
The current support lies at $2.78T, and this level aligns closely with the upper resistance of USDT dominance, creating an important confluence. If this confluence strengthens, TOTAL may continue moving downward while USDT dominance pushes higher.
The major resistance for TOTAL is the $3T zone, and a breakout above it could create a pullback to the recent Bitcoin decline.
🔶 TOTAL2 (Altcoin Market Cap Excluding BTC) – 4H Timeframe

On the 4-hour timeframe of TOTAL2, we see a strong correlation with Ethereum’s chart.
TOTAL2 dropped from around $1.5T down to nearly $1T, following the recent sell-off in Bitcoin and Ethereum. It tested its supports and eventually lost them.
Currently, TOTAL2 is positioned near $1.15T, and breaking below this level could lead to a deeper correction in Ethereum.
On the other hand, reclaiming and breaking above $1.22T may push TOTAL2 upward and act as an early signal for a new bullish wave (mostly a pullback) in Ethereum and its ecosystem projects.
🔶 TOTAL3 (Altcoin Market Cap Excluding BTC & ETH) – 4H Timeframe

On the 4-hour timeframe of TOTAL3, the chart aligns with the performance of the top 10 altcoins.
TOTAL3 previously hovered around $1.05T and has experienced a milder decline compared to TOTAL and TOTAL2. It is currently sitting at its major support near $832B, testing a multi-timeframe support zone.
A breakdown of this level could extend the correction across the top altcoins.
However, breaking above the $900B area could generate a pullback and corrective wave against the recent downside leg, signaling potential upward movement.
🔶 OTHERS Dominance (others.d) – 4H Timeframe

On the 4-hour timeframe of OTHERS.D, we’re looking at one of the most important crypto indicators, especially in times like this. This index helps us understand when the altcoin bull market (altseason) may begin and when it's time to start building spot portfolios.
Despite the market volatility, OTHERS.D has held itself inside a stable 4H trading range and is currently reacting to the midline of its 1H range.
If Bitcoin dominance had increased during this period, altcoins could have faced an even deeper correction. However, on-chain data shows that altcoins are receiving far more attention compared to previous years.
A breakout above 7.52% on this indicator could be an early signal of a potential upcoming altcoin bull run.
🛞 Risk Management & Disclaimer
Please remember to always use proper risk management and position sizing. Nothing in this analysis is financial advice. The market can change quickly, so always trade based on your own strategy, research, and risk tolerance. You are fully responsible for your own trades.
Let’s dive into the analysis of Four major crypto Index.
🔶 TOTAL (Crypto Market Cap) – 4H Timeframe
On the 4-hour timeframe of TOTAL, we can see a strong correlation with Bitcoin’s chart. After approaching the $4T zone, the total market cap went through a deep correction, testing multiple support levels and eventually breaking them.
It’s now sitting around $2.78T, marking a $1 trillion drop, which is something unprecedented in the crypto market.
The current support lies at $2.78T, and this level aligns closely with the upper resistance of USDT dominance, creating an important confluence. If this confluence strengthens, TOTAL may continue moving downward while USDT dominance pushes higher.
The major resistance for TOTAL is the $3T zone, and a breakout above it could create a pullback to the recent Bitcoin decline.
🔶 TOTAL2 (Altcoin Market Cap Excluding BTC) – 4H Timeframe
On the 4-hour timeframe of TOTAL2, we see a strong correlation with Ethereum’s chart.
TOTAL2 dropped from around $1.5T down to nearly $1T, following the recent sell-off in Bitcoin and Ethereum. It tested its supports and eventually lost them.
Currently, TOTAL2 is positioned near $1.15T, and breaking below this level could lead to a deeper correction in Ethereum.
On the other hand, reclaiming and breaking above $1.22T may push TOTAL2 upward and act as an early signal for a new bullish wave (mostly a pullback) in Ethereum and its ecosystem projects.
🔶 TOTAL3 (Altcoin Market Cap Excluding BTC & ETH) – 4H Timeframe
On the 4-hour timeframe of TOTAL3, the chart aligns with the performance of the top 10 altcoins.
TOTAL3 previously hovered around $1.05T and has experienced a milder decline compared to TOTAL and TOTAL2. It is currently sitting at its major support near $832B, testing a multi-timeframe support zone.
A breakdown of this level could extend the correction across the top altcoins.
However, breaking above the $900B area could generate a pullback and corrective wave against the recent downside leg, signaling potential upward movement.
🔶 OTHERS Dominance (others.d) – 4H Timeframe
On the 4-hour timeframe of OTHERS.D, we’re looking at one of the most important crypto indicators, especially in times like this. This index helps us understand when the altcoin bull market (altseason) may begin and when it's time to start building spot portfolios.
Despite the market volatility, OTHERS.D has held itself inside a stable 4H trading range and is currently reacting to the midline of its 1H range.
If Bitcoin dominance had increased during this period, altcoins could have faced an even deeper correction. However, on-chain data shows that altcoins are receiving far more attention compared to previous years.
A breakout above 7.52% on this indicator could be an early signal of a potential upcoming altcoin bull run.
🛞 Risk Management & Disclaimer
Please remember to always use proper risk management and position sizing. Nothing in this analysis is financial advice. The market can change quickly, so always trade based on your own strategy, research, and risk tolerance. You are fully responsible for your own trades.
🔥 Join the Action Now 🔥
☄️ Telegram
t.me/FireHoseReel
☄️ Trade & Earn
bitunix.com/register?inviteCode=28r21f
☄️ Telegram
t.me/FireHoseReel
☄️ Trade & Earn
bitunix.com/register?inviteCode=28r21f
Pubblicazioni correlate
Declinazione di responsabilità
Le informazioni e le pubblicazioni non sono intese come, e non costituiscono, consulenza o raccomandazioni finanziarie, di investimento, di trading o di altro tipo fornite o approvate da TradingView. Per ulteriori informazioni, consultare i Termini di utilizzo.