Ever since the COVID recovery started, both the S&P500 index and the WTI Oil, have followed similar courses, especially since the start of 2021. There is a very interesting pattern of divergence and convergence, which the two follow on a consistent basis.
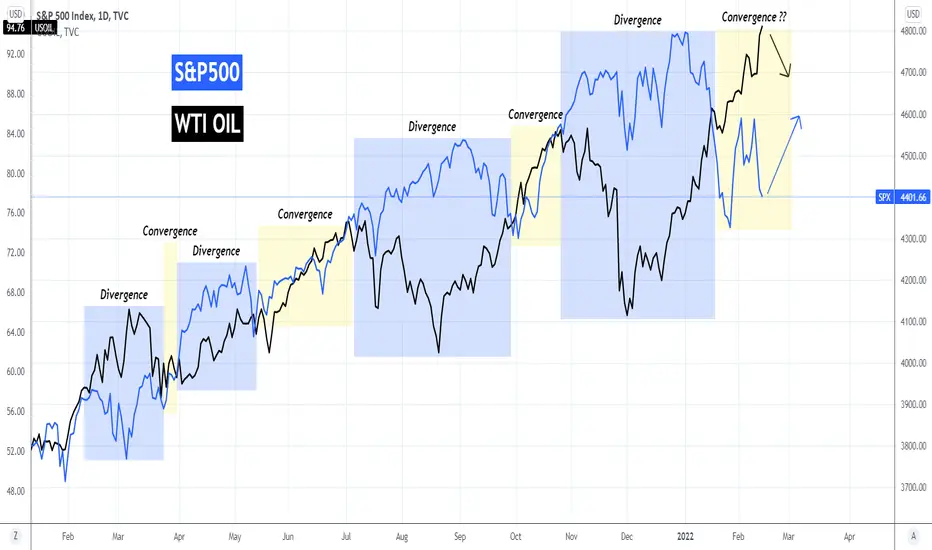
As this chart on the 1D time-frame shows, when S&P500 (blue trend-line) diverges from the shared upward path with WTI (black trend-line), within the blue zone, they have always converged back (yellow zone). Ever since mid January 2022, it is WTI that diverged from the S&P500 as the index dropped violently while WTI continued its rapid price growth. Last time this happened was in the mid Feb 2021 - mid March 2021 Divergence, as the other two Divergence Phases, it was the S&P500 that rapidly expanded while WTI was correcting.
Naturally, if this pattern continues to play out, we should now have a new Convergence phase where the two assets cross trend-lines again and continue their course when they will eventually diverge again. This means that we should be expecting S&P to recover while WTI pulls back from its current highs.
Do you think that will be the case? Let me know in the comments section below.
--------------------------------------------------------------------------------------------------------
Please like, subscribe and share your ideas and charts with the community!
--------------------------------------------------------------------------------------------------------
👑Best Signals (Forex/Crypto+70% accuracy) & Account Management (+20% profit/month on 10k accounts)
💰Free Channel t.me/tradingshotglobal
🤵Contact info@tradingshot.com t.me/tradingshot
🔥New service: next X100 crypto GEMS!
💰Free Channel t.me/tradingshotglobal
🤵Contact info@tradingshot.com t.me/tradingshot
🔥New service: next X100 crypto GEMS!
Declinazione di responsabilità
Le informazioni ed i contenuti pubblicati non costituiscono in alcun modo una sollecitazione ad investire o ad operare nei mercati finanziari. Non sono inoltre fornite o supportate da TradingView. Maggiori dettagli nelle Condizioni d'uso.