Here is the 1st chart I did of SPX back in Jan 2022:

I called the drop to the yellow line on chart. Nailed it to nearly the exact $.
Then in October 2023 I mentioned this:

The rally was confirmed for the next 6 months minimum.
Then in Jan 2024 I posted a red horizontal line as target for the rally:

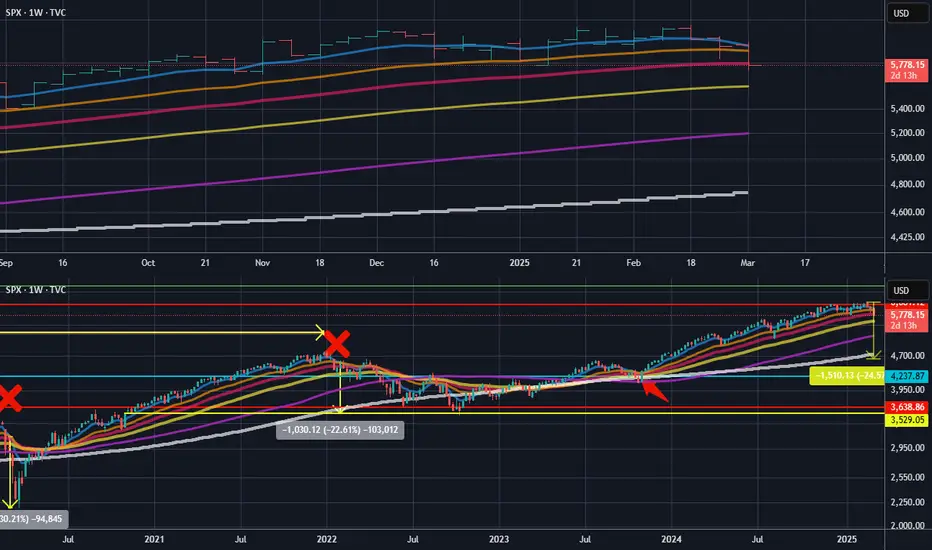
Now you can see on current bottom chart that price hit the red line target.
This chart setup you see on bottom chart also shows relevance to the 1st chart I did on SPX where when the blue EMA8 went below the orange MA21, a drop happened as per the red X marks and price changes shown on chart. This is close to happening currently which is easier to see on the top chart as I give a close up view on current price action and the EMA/MA's.
Are we about to see a drop as per yellow price change on chart or can SPX bounce from here and move up to the green horizontal line on chart? The EMA/MA crossunder will tell us.
Even though I called the moves all correct previously, at this time in the markets, things are alot trickier so I cannot say with conviction this time around as to which way it will go.
I will update the analysis once the bounce or cross under is confirmed.
I called the drop to the yellow line on chart. Nailed it to nearly the exact $.
Then in October 2023 I mentioned this:
The rally was confirmed for the next 6 months minimum.
Then in Jan 2024 I posted a red horizontal line as target for the rally:
Now you can see on current bottom chart that price hit the red line target.
This chart setup you see on bottom chart also shows relevance to the 1st chart I did on SPX where when the blue EMA8 went below the orange MA21, a drop happened as per the red X marks and price changes shown on chart. This is close to happening currently which is easier to see on the top chart as I give a close up view on current price action and the EMA/MA's.
Are we about to see a drop as per yellow price change on chart or can SPX bounce from here and move up to the green horizontal line on chart? The EMA/MA crossunder will tell us.
Even though I called the moves all correct previously, at this time in the markets, things are alot trickier so I cannot say with conviction this time around as to which way it will go.
I will update the analysis once the bounce or cross under is confirmed.
Follow me on Youtube, X and in Discord server for more updates more frequently.
Pubblicazioni correlate
Declinazione di responsabilità
Le informazioni ed i contenuti pubblicati non costituiscono in alcun modo una sollecitazione ad investire o ad operare nei mercati finanziari. Non sono inoltre fornite o supportate da TradingView. Maggiori dettagli nelle Condizioni d'uso.