To get some prospective on when we might see a turn around, one could look at previous significant declines in the market.
Bull Run From 1987 to 2000 =12 years --- Market Decline From 2000 to 2002 for 2.5 years was 51%
Bull Run From 2002 to 2007 =5 years ---- Market Decline From 2007 to 2009 for 1.5 years was 58%
Bull Run From 2009 to 2020 =11 years --- Currently market has declined already 27% ----
Based on previous market crashes we might see more down side in near future, time will tell.
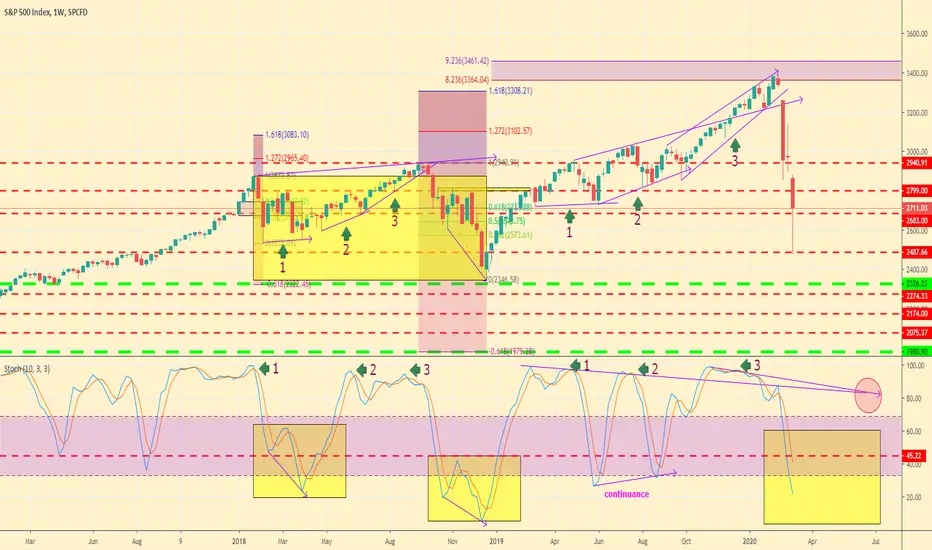
However we can look at the chart to give us some guidance on what to look for if and when there is any turn around signal(s).
We can probably look at the combination of Fibonacci levels and Slow Stochastic on a weekly chart.
Most recent corrections we had at the end of 2018 where the market sold off and bounced around .618 level (green dotted line).
Before a sell off, we see a divergence between price and Stochastic, where price keeps going up and Stochastic makes lower highs before market decline begins.
Then before market starts to go up Stochastic initially tries to retrace upwards but turns back down again to form a lower bottom before it is all done or makes some sort of divergence with price.
Chart reading is an art not a science.
Therefore there are a lot of uncertainties in the market and it is my opinion only and nothing else!!!
Wishing you all well and prosperity!!!
Bull Run From 1987 to 2000 =12 years --- Market Decline From 2000 to 2002 for 2.5 years was 51%
Bull Run From 2002 to 2007 =5 years ---- Market Decline From 2007 to 2009 for 1.5 years was 58%
Bull Run From 2009 to 2020 =11 years --- Currently market has declined already 27% ----
Based on previous market crashes we might see more down side in near future, time will tell.
However we can look at the chart to give us some guidance on what to look for if and when there is any turn around signal(s).
We can probably look at the combination of Fibonacci levels and Slow Stochastic on a weekly chart.
Most recent corrections we had at the end of 2018 where the market sold off and bounced around .618 level (green dotted line).
Before a sell off, we see a divergence between price and Stochastic, where price keeps going up and Stochastic makes lower highs before market decline begins.
Then before market starts to go up Stochastic initially tries to retrace upwards but turns back down again to form a lower bottom before it is all done or makes some sort of divergence with price.
Chart reading is an art not a science.
Therefore there are a lot of uncertainties in the market and it is my opinion only and nothing else!!!
Wishing you all well and prosperity!!!
Anything published is strictly for educational purpose.
Declinazione di responsabilità
Le informazioni ed i contenuti pubblicati non costituiscono in alcun modo una sollecitazione ad investire o ad operare nei mercati finanziari. Non sono inoltre fornite o supportate da TradingView. Maggiori dettagli nelle Condizioni d'uso.