
The long term trends that were triggered on Nov 2011, Jan 2013 and Nov 2016, plotted as an overlay to the current daily chart, paint a bullish picture for  SPX and our stocks portfolio as a whole. The long term chart is about to confirm a rally, like how it did back then on those 3 occasions. If it does, we will likely be higher by the end of the year, in the order of 13% higher for the index, give or take. Corrections along the way, could be 5 days long on average, and as much as 6.4% deep, but I don't think that will be the case, since volatility in 2011 was much higher than now, and currently distorting the average correction size significantly.
With dems having lower probability of being elected, and a trade deal being closer to becoming a reality, plus negative sentiment having peaked, with Gold and Bonds hitting long term tops possibly, and everyone absolutely hating stocks...I want to be long and let things pan out, same as we do with BTC for a while now.
Let's see how things evolve here, price action in the short term is constructive, with the daily targets show on chart (yellow boxes).
Best of luck,
Ivan Labrie.
With dems having lower probability of being elected, and a trade deal being closer to becoming a reality, plus negative sentiment having peaked, with Gold and Bonds hitting long term tops possibly, and everyone absolutely hating stocks...I want to be long and let things pan out, same as we do with
Let's see how things evolve here, price action in the short term is constructive, with the daily targets show on chart (yellow boxes).
Best of luck,
Ivan Labrie.
Nota
Nota
Looks good so far: Nota
I'm heavily long stocks since last week, sold my Nota
Nota
#SPX has all of October left still, to finally confirm the huge uptrend I'm seeing as possible here in the 2-Month timeframe, this aligns with #BTCUSD's chart as well, interestingly...A boon in risk on assets will prove beneficial for crypto: Nota
This level could be support in #SPX or it could break down and trend much lower if it doesn't hold: Nota
If it holds up during 20 more minutes we could try going long here with a tight $10-30 stop.Nota
Given general conditions, this signal might turn into a failure, I'd suggest taking a step back and holding cash, #BTC, #ETH, #Gold, #Silver, #Miners, be cautious with stock holdings. Liquidity wasn't enough to absorb supply, and the rally we had from support since last week is failing. Situation with China is getting worse, and Trump's position weakening...Trade chiuso manualmente
Trade attivo
Since the market recovered, there was no follow through in sell pressure, and we're very close to confirming a huge long term uptrend signal in stocks: I would buy back in on new highs...
Trade attivo
Trending up!
Nota
So far so good...Trend is up long term it seems, this may keep going until 2021, easily. Problem is finding buy entries on VIX spikes, and knowing when to hedge before corrections, but overall good to hold long term stock positions now.Trade chiuso manualmente
Despite no one believing the rally, prices keep grinding higher...
'This is a bull market after all!'
I'll be looking for a consolidation to buy back since I sold today.
Trade attivo
Bought back on the dip.
Nota
If #SPX holds over 3081, it has time until Dec 18th to hit the two targets on chart (yellow arrows) Nota
I copied the action from all the times a 2 month timeframe trend signal confirmed in SPX since 2009, and the average of those patterns was the blue arrow in my chart. You can see that it moved following my expected path overall:Stocks are a hold, direction is up, in the long term. Short term dislocations between now and mid to late 2021 will be buying opportunities. Watch the
Trade attivo
BTFD: Nota
Looks about right for a massive bottom...s3.amazonaws.com/tradingview/snapshots/p/PuAMIxSm.png
People reached peak bearishness, now RgExp from a mode. Mode retest held...
I think we got the bottom in stocks.
Trade chiuso manualmente
I sold the rally when Nota
This was a logical level for #SPX to find bids to support the market, we should see #VIX slow down going into Monday's session, else #SPY might gap down next week: Nota
Dip bot
Trade attivo
Finally bottomed it seems:Let's buy a 60% #SPX long position here, if the bottom holds, we might rally for one more year, given the signals in #SPY and #SPX long term charts
Now: 3027.3
Nota
Another interesting indicator is the stocks vs bonds ratio, it hit support in the monthly timeframe here: Trade attivo
It took a bit longer to bottom, stopped out a couple times, but overall the trend was a good move.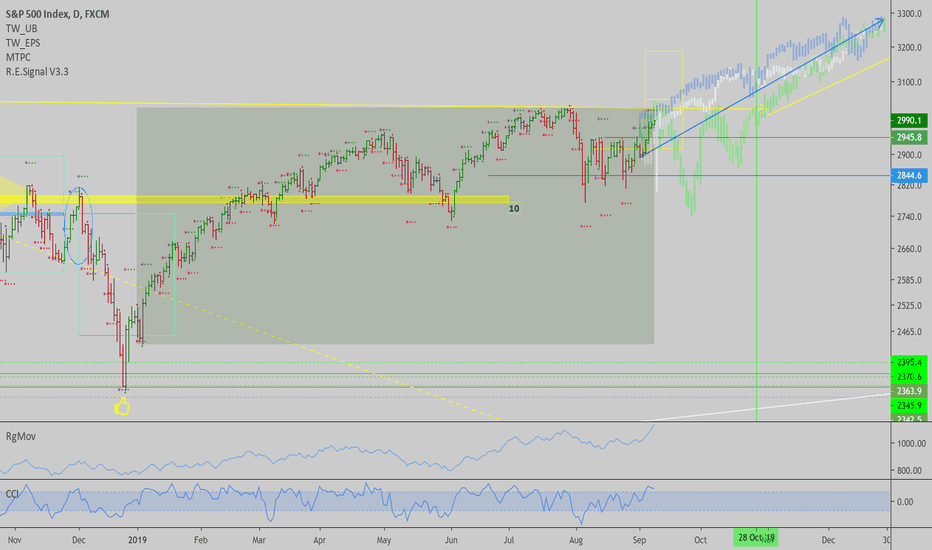
Pubblicazioni correlate
Declinazione di responsabilità
Le informazioni ed i contenuti pubblicati non costituiscono in alcun modo una sollecitazione ad investire o ad operare nei mercati finanziari. Non sono inoltre fornite o supportate da TradingView. Maggiori dettagli nelle Condizioni d'uso.
Pubblicazioni correlate
Declinazione di responsabilità
Le informazioni ed i contenuti pubblicati non costituiscono in alcun modo una sollecitazione ad investire o ad operare nei mercati finanziari. Non sono inoltre fornite o supportate da TradingView. Maggiori dettagli nelle Condizioni d'uso.