OPEN-SOURCE SCRIPT
Aggiornato COT Report Indicator with Speculator Net Positions
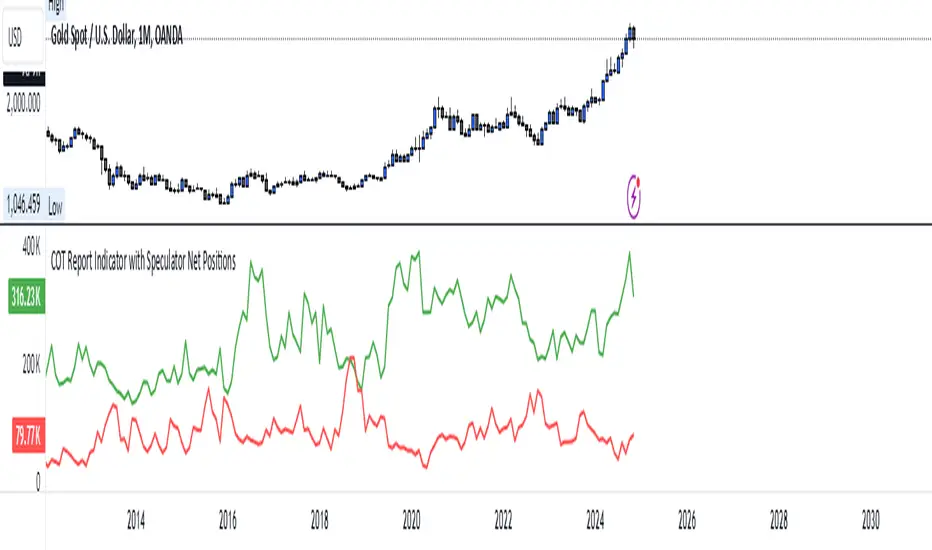
The COT Report Indicator with Speculator Net Positions is designed to give traders insights into the behavior of large market participants, particularly speculators, based on the Commitment of Traders (COT) report data. This indicator visualizes the long and short positions of non-commercial traders, allowing users to gauge the sentiment and positioning of large speculators in key markets, such as Gold, Silver, Crude Oil, S&P 500, and currency pairs like EURUSD, GBPUSD, and others.
The indicator provides three essential components:
Best Timeframes: Weekly and Monthly
How to Use:
Supported Symbols:
This indicator currently supports a range of commodities and currency pairs, including:
By providing clear insight into the positions of large speculators, this indicator is a powerful tool for traders looking to align with institutional sentiment and enhance their trading strategy.
The indicator provides three essential components:
- Net Long Position (Green) - Displays the total long positions held by speculators.
- Net Short Position (Purple) - Shows the total short positions held by speculators.
- Net Difference (Long - Short) (Yellow) - Illustrates the difference between long and short positions, helping users identify whether speculators are more bullish or bearish on the asset.
- Recommended Timeframes:
Best Timeframes: Weekly and Monthly
- The COT report data is released on a weekly basis, making higher timeframes like the Weekly and Monthly charts ideal for this indicator. These timeframes provide a more accurate reflection of the underlying trends in speculator positioning, avoiding the noise present in lower timeframes.
How to Use:
- Market Sentiment: Use this indicator to gauge the sentiment of large speculators, who often drive market trends. A strong net long position can indicate bullish sentiment, while a high net short position might suggest bearish sentiment.
- Trend Reversal Signals: Sudden changes in the net difference between long and short positions may indicate potential trend reversals.
- Confirmation Tool: Pair this indicator with your existing analysis to confirm the strength of a trend or identify overbought/oversold conditions based on speculator activity.
Supported Symbols:
This indicator currently supports a range of commodities and currency pairs, including:
- Gold (
 XAUUSD )
 - Silver (
 XAGUSD )
 - Crude Oil (
 USOIL )
 - Natural Gas (
 NG1! )
 - S&P 500 (
 SPX )
SPX ) - Dollar Index (
 DXY )
DXY ) - EURUSD (

 EURUSD )
 - GBPUSD (
 GBPUSD )
 - GBPJPY(
 GBPJPY )
By providing clear insight into the positions of large speculators, this indicator is a powerful tool for traders looking to align with institutional sentiment and enhance their trading strategy.
Note di rilascio
The COT Report Indicator with Speculator Net Positions is designed to give traders insights into the behavior of large market participants, particularly speculators, based on the Commitment of Traders (COT) report data. This indicator visualizes the long and short positions of non-commercial traders, allowing users to gauge the sentiment and positioning of large speculators in key markets, such as Gold, Silver, Crude Oil, S&P 500, and currency pairs like EURUSD, GBPUSD, and others.The indicator provides three essential components:
- Net Long Position (Green) - Displays the total long positions held by speculators.
- Net Short Position (Purple) - Shows the total short positions held by speculators.
- Net Difference (Long - Short) (Yellow) - Illustrates the difference between long and short positions, helping users identify whether speculators are more bullish or bearish on the asset.
Recommended Timeframes:
- Best Timeframes: Weekly and Monthly
- The COT report data is released on a weekly basis, making higher timeframes like the Weekly and Monthly charts ideal for this indicator. These timeframes provide a more accurate reflection of the underlying trends in speculator positioning, avoiding the noise present in lower timeframes.
How to Use:
- Market Sentiment: Use this indicator to gauge the sentiment of large speculators, who often drive market trends. A strong net long position can indicate bullish sentiment, while a high net short position might suggest bearish sentiment.
- Trend Reversal Signals: Sudden changes in the net difference between long and short positions may indicate potential trend reversals.
- Confirmation Tool: Pair this indicator with your existing analysis to confirm the strength of a trend or identify overbought/oversold conditions based on speculator activity.
Supported Symbols:
This indicator currently supports a range of commodities and currency pairs, including:
Gold (
Silver (
Crude Oil (
Natural Gas (
S&P 500 (
Dollar Index (
EURUSD (
GBPUSD (
GBPJPY (
USDJPY (
By providing clear insight into the positions of large speculators, this indicator is a powerful tool for traders looking to align with institutional sentiment and enhance their trading strategy.
Note di rilascio
The COT Report Indicator with Speculator Net Positions provides valuable insights into the behavior of large market participants, particularly speculators, using data from the Commitment of Traders (COT) report. This indicator visualizes the long and short positions of non-commercial traders, helping users understand sentiment and positioning in key markets such as Gold, Silver, Crude Oil, S&P 500, and major currency pairs.Key Features:
- Net Long Position (Green): Displays total long positions held by speculators.
- Net Short Position (Purple): Shows total short positions held by speculators.
- Net Difference (Long - Short) (Yellow): Highlights the difference between long and short positions, revealing whether speculators are bullish or bearish.
Recommended Timeframes:
- Weekly: Ideal for aligning with COT report updates.
- Monthly: Best for observing long-term trends.
The COT report is released weekly, making these higher timeframes optimal for a clear reflection of speculator trends.
How to Use:
- Market Sentiment: Assess sentiment from large speculators. A high net long position suggests bullish sentiment, while a strong net short position signals bearishness.
- Trend Reversal Signals: Monitor changes in the net difference for potential trend reversals.
- Confirmation Tool: Integrate with your analysis to confirm trends or identify overbought/oversold conditions.
Supported Symbols:
- Gold ( XAUUSD )
- Silver ( XAGUSD )
- Crude Oil ( USOIL )
- Natural Gas ( NG1! )
- S&P 500 ( SPX )
- Dollar Index ( DXY )
- EUR/USD ( EURUSD )
- GBP/USD ( GBPUSD )
- GBP/JPY ( GBPJPY )
- USD/JPY ( USDJPY )
- Nas100 (
 NAS100 )
Enhance Your Trading Strategy
By understanding the sentiment of institutional speculators, this indicator can help traders make more informed decisions and align with market trends effectively.
Release Notes:
- Initial release: Visualizes non-commercial trader positions (long, short, and net difference).
- Ideal for commodities, indices, and major forex pairs.
- Compatible with Weekly and Monthly timeframes.
How to Use This Script:
- Copy the code into the Pine Script editor on TradingView.
- Replace the longPositions and shortPositions mock data with actual COT data sources.
- Use the dropdown to select supported symbols and observe COT-based insights.
This script helps traders effectively visualize and interpret speculator positions in various markets, aligning their strategies with institutional trends.
Note di rilascio
Sync with chart is set to true. Works best with weekly and monthly timeframes.Script open-source
Nello spirito di TradingView, l'autore di questo script lo ha reso open source, in modo che i trader possano esaminarne e verificarne la funzionalità. Complimenti all'autore! Sebbene sia possibile utilizzarlo gratuitamente, ricordiamo che la ripubblicazione del codice è soggetta al nostro Regolamento.
Declinazione di responsabilità
Le informazioni e le pubblicazioni non sono intese come, e non costituiscono, consulenza o raccomandazioni finanziarie, di investimento, di trading o di altro tipo fornite o approvate da TradingView. Per ulteriori informazioni, consultare i Termini di utilizzo.
Script open-source
Nello spirito di TradingView, l'autore di questo script lo ha reso open source, in modo che i trader possano esaminarne e verificarne la funzionalità. Complimenti all'autore! Sebbene sia possibile utilizzarlo gratuitamente, ricordiamo che la ripubblicazione del codice è soggetta al nostro Regolamento.
Declinazione di responsabilità
Le informazioni e le pubblicazioni non sono intese come, e non costituiscono, consulenza o raccomandazioni finanziarie, di investimento, di trading o di altro tipo fornite o approvate da TradingView. Per ulteriori informazioni, consultare i Termini di utilizzo.