OPEN-SOURCE SCRIPT
Aggiornato Linear Regression Intensity [AlgoAlpha]
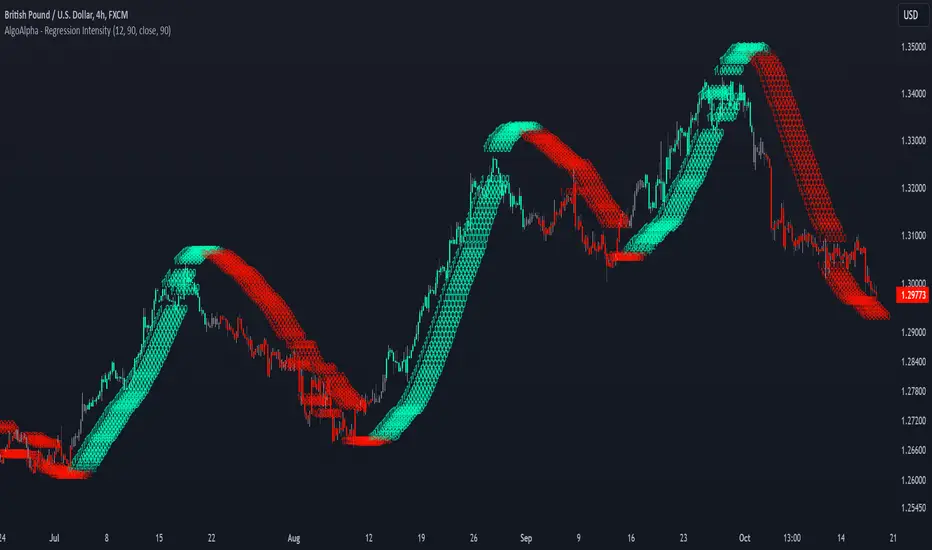
Introducing the Linear Regression Intensity indicator by AlgoAlpha, a sophisticated tool designed to measure and visualize the strength of market trends using linear regression analysis. This indicator not only identifies bullish and bearish trends with precision but also quantifies their intensity, providing traders with deeper insights into market dynamics. Whether you’re a novice trader seeking clearer trend signals or an experienced analyst looking for nuanced trend strength indicators, Linear Regression Intensity offers the clarity and detail you need to make informed trading decisions.
Key Features:
Quick Guide to Using Linear Regression Intensity:
How It Works:
The Linear Regression Intensity indicator leverages linear regression to calculate the underlying trend of a selected price source over a specified length. By analyzing the consistency of the regression values within a defined lookback period, it determines the trend’s intensity based on a percentage tolerance. The indicator aggregates pairwise comparisons of regression values to assess whether the trend is predominantly upward or downward, assigning a state of bullish, bearish, or neutral accordingly. This state is then visually represented through dynamic bar colors and intensity labels, offering a clear and immediate understanding of market conditions. Additionally, the inclusion of Average True Range (ATR) ensures that the intensity visualization accounts for market volatility, providing a more robust and reliable trend assessment. With customizable settings and alert conditions, Linear Regression Intensity empowers traders to fine-tune their strategies and respond swiftly to evolving market trends.
Elevate your trading strategy with Linear Regression Intensity [AlgoAlpha] and gain unparalleled insights into market trends! 🌟📊
Key Features:
- 📊 Comprehensive Trend Analysis: Utilizes linear regression over customizable periods to assess and quantify trend strength.
- 🎨 Customizable Appearance: Choose your preferred colors for bullish and bearish trends to align with your trading style.
- 🔧 Flexible Parameters: Adjust the lookback period, range tolerance, and regression length to tailor the indicator to your specific strategy.
- 📉 Dynamic Bar Coloring: Instantly visualize trend states with color-coded bars—green for bullish, red for bearish, and gray for neutral.
- 🏷️ Intensity Labels: Displays dynamic labels that represent the intensity of the current trend, helping you gauge market momentum at a glance.
- 🔔 Alert Conditions: Set up alerts for strong bullish or bearish trends and trend neutrality to stay ahead of market movements without constant monitoring.
Quick Guide to Using Linear Regression Intensity:
- 🛠 Add the Indicator: Simply add Linear Regression Intensity to your TradingView chart from your favorites. Customize the settings such as lookback period, range tolerance, and regression length to fit your trading approach.
- 📈 Market Analysis: Observe the color-coded bars to quickly identify the current trend state. Use the intensity labels to understand the strength behind each trend, allowing for more strategic entry and exit points.
- 🔔 Set Up Alerts: Enable alerts for when strong bullish or bearish trends are detected or when the trend reaches a neutral zone. This ensures you never miss critical market movements, even when you’re away from the chart.
How It Works:
The Linear Regression Intensity indicator leverages linear regression to calculate the underlying trend of a selected price source over a specified length. By analyzing the consistency of the regression values within a defined lookback period, it determines the trend’s intensity based on a percentage tolerance. The indicator aggregates pairwise comparisons of regression values to assess whether the trend is predominantly upward or downward, assigning a state of bullish, bearish, or neutral accordingly. This state is then visually represented through dynamic bar colors and intensity labels, offering a clear and immediate understanding of market conditions. Additionally, the inclusion of Average True Range (ATR) ensures that the intensity visualization accounts for market volatility, providing a more robust and reliable trend assessment. With customizable settings and alert conditions, Linear Regression Intensity empowers traders to fine-tune their strategies and respond swiftly to evolving market trends.
Elevate your trading strategy with Linear Regression Intensity [AlgoAlpha] and gain unparalleled insights into market trends! 🌟📊
Note di rilascio
small changesScript open-source
Nello spirito di TradingView, l'autore di questo script lo ha reso open source, in modo che i trader possano esaminarne e verificarne la funzionalità. Complimenti all'autore! Sebbene sia possibile utilizzarlo gratuitamente, ricordiamo che la ripubblicazione del codice è soggetta al nostro Regolamento.
🚨Get premium for 50% OFF (ends Jan 31st): algoalpha.io
🛜Get FREE signals: discord.gg/xCmqTVRexz
💡Tutorials: youtube.com/@AlgoAlpha
🛜Get FREE signals: discord.gg/xCmqTVRexz
💡Tutorials: youtube.com/@AlgoAlpha
Declinazione di responsabilità
Le informazioni e le pubblicazioni non sono intese come, e non costituiscono, consulenza o raccomandazioni finanziarie, di investimento, di trading o di altro tipo fornite o approvate da TradingView. Per ulteriori informazioni, consultare i Termini di utilizzo.
Script open-source
Nello spirito di TradingView, l'autore di questo script lo ha reso open source, in modo che i trader possano esaminarne e verificarne la funzionalità. Complimenti all'autore! Sebbene sia possibile utilizzarlo gratuitamente, ricordiamo che la ripubblicazione del codice è soggetta al nostro Regolamento.
🚨Get premium for 50% OFF (ends Jan 31st): algoalpha.io
🛜Get FREE signals: discord.gg/xCmqTVRexz
💡Tutorials: youtube.com/@AlgoAlpha
🛜Get FREE signals: discord.gg/xCmqTVRexz
💡Tutorials: youtube.com/@AlgoAlpha
Declinazione di responsabilità
Le informazioni e le pubblicazioni non sono intese come, e non costituiscono, consulenza o raccomandazioni finanziarie, di investimento, di trading o di altro tipo fornite o approvate da TradingView. Per ulteriori informazioni, consultare i Termini di utilizzo.