OPEN-SOURCE SCRIPT
Ultimate RSI With Some Spices
★彡 𝓤𝓵𝓽𝓲𝓶𝓪𝓽𝓮 𝓡𝓢𝓘 𝓦𝓲𝓽𝓱 𝓢𝓸𝓶𝓮 𝓢𝓹𝓲𝓬𝓮𝓼 彡★
* Hi everybody here's the ★彡 𝓤𝓵𝓽𝓲𝓶𝓪𝓽𝓮 𝓡𝓢𝓘 𝓦𝓲𝓽𝓱 𝓢𝓸𝓶𝓮 𝓢𝓹𝓲𝓬𝓮𝓼 彡★ indicator and how to use it :
彡彡彡彡彡彡彡彡彡彡彡彡彡彡彡彡彡彡彡彡彡彡彡彡彡彡彡彡彡
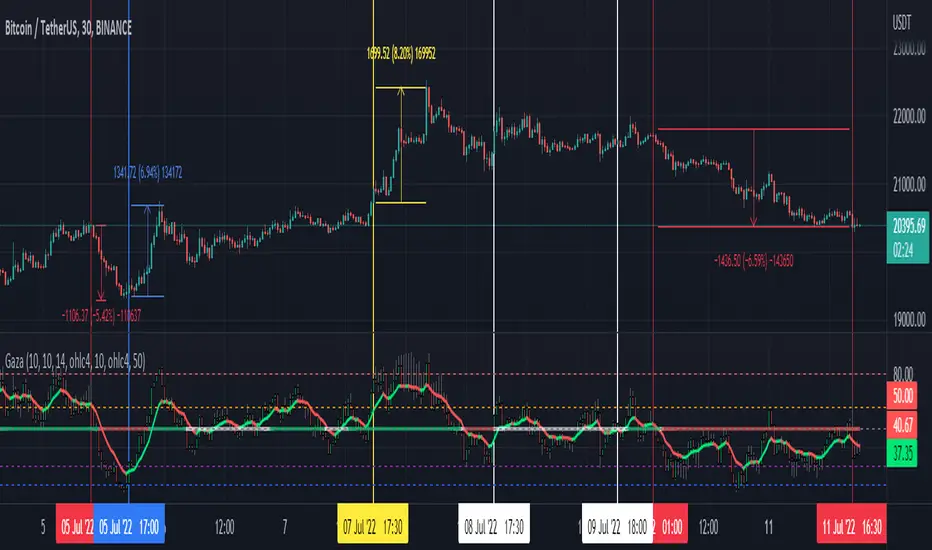
First we have that red : green {RSI EMA Line}line in the indicator which show the current symbol situation \
𝐒𝐢𝐦𝐩𝐥𝐲 : 𝐢𝐟 𝐭𝐡𝐞 𝐥𝐢𝐧𝐞 𝐜𝐥𝐨𝐬𝐞 𝐰𝐢𝐭𝐡 𝐠𝐫𝐞𝐞𝐧 𝐜𝐨𝐥𝐨𝐫 𝐲𝐨𝐮 𝐜𝐚𝐧 𝐨𝐩𝐞𝐧 𝐚 𝐥𝐨𝐧𝐠 𝐭𝐫𝐚𝐝𝐞 𝐚𝐧𝐝 𝐞𝐱𝐢𝐭 𝐰𝐡𝐞𝐧 𝐭𝐡𝐞 𝐫𝐞𝐝 𝐜𝐨𝐥𝐨𝐫 𝐚𝐩𝐩𝐞𝐚𝐫𝐬
I𝐧 𝐭𝐡𝐞 𝐬𝐚𝐦𝐞 𝐭𝐢𝐦𝐞 𝐰𝐞 𝐡𝐚𝐯𝐞 𝐨𝐭𝐡𝐞𝐫 𝐭𝐡𝐢𝐧𝐠𝐬 𝐭𝐨 𝐮𝐬𝐞 𝐰𝐢𝐭𝐡 𝐭𝐡𝐚𝐭 𝐰𝐨𝐮𝐥𝐝 𝐡𝐞𝐥𝐩 𝐮𝐬 𝐭𝐨 𝐦𝐚𝐤𝐞 𝐚 𝐠𝐨𝐨𝐝 𝐨𝐫𝐝𝐞𝐫
Like The 𝐂𝐲𝐜𝐥𝐞𝐫 𝐬𝐢𝐭𝐮𝐚𝐭𝐢𝐨𝐧 𝐚𝐧𝐝 𝐟𝐢𝐛𝐨𝐧𝐚𝐜𝐜𝐢 𝐥𝐞𝐯𝐞𝐥𝐬
We have the 𝐧𝐞𝐱𝐭 𝐟𝐢𝐛𝐨𝐧𝐚𝐜𝐜𝐢 𝐥𝐞𝐯𝐞𝐥𝐬 𝟐𝟎 ,𝟑𝟎 ,𝟓𝟎 ,𝟔𝟏.𝟖 ,𝟖𝟎 { 61.8 𝐢𝐬 𝐭𝐡𝐞 𝐭𝐡𝐞 𝐟𝐢𝐛𝐨𝐧𝐚𝐜𝐜𝐢 𝐠𝐨𝐥𝐝𝐞𝐧 𝐫𝐚𝐭𝐢𝐨 }
About The 𝐂𝐲𝐜𝐥𝐞𝐫 you can use it to know where is the current symbol go { UP : Green ,| Down : Red ,| White : Where the symbol movement is in a slight fluctuation without any significant up or down }
░▒▓█ 𝐍𝐨𝐭𝐞 : 𝐓𝐡𝐞 𝐂𝐲𝐜𝐥𝐞𝐫 𝐥𝐢𝐧𝐞 𝐢𝐬 𝐭𝐡𝐞 𝐬𝐚𝐦𝐞 𝐟𝐢𝐛𝐨𝐧𝐚𝐜𝐜𝐢 𝐥𝐞𝐯𝐞𝐥 ' 𝐫𝐚𝐭𝐢𝐨 𝟓𝟎 ' █▓▒░
𝐡𝐞𝐫𝐞'𝐬 𝐚 𝐟𝐚𝐬𝐭 𝐩𝐡𝐨𝐭𝐨 𝐭𝐡𝐚𝐭 𝐬𝐡𝐨𝐰 𝐞𝐯𝐞𝐫𝐲𝐭𝐡𝐢𝐧𝐠
❤❤❤❤ 𝐟𝐢𝐧𝐚𝐥𝐥𝐲 𝐇𝐚𝐯𝐞 𝐚 𝐠𝐨𝐨𝐝 𝐭𝐢𝐦𝐞 ❤❤❤❤
* Hi everybody here's the ★彡 𝓤𝓵𝓽𝓲𝓶𝓪𝓽𝓮 𝓡𝓢𝓘 𝓦𝓲𝓽𝓱 𝓢𝓸𝓶𝓮 𝓢𝓹𝓲𝓬𝓮𝓼 彡★ indicator and how to use it :
彡彡彡彡彡彡彡彡彡彡彡彡彡彡彡彡彡彡彡彡彡彡彡彡彡彡彡彡彡
First we have that red : green {RSI EMA Line}line in the indicator which show the current symbol situation \
𝐒𝐢𝐦𝐩𝐥𝐲 : 𝐢𝐟 𝐭𝐡𝐞 𝐥𝐢𝐧𝐞 𝐜𝐥𝐨𝐬𝐞 𝐰𝐢𝐭𝐡 𝐠𝐫𝐞𝐞𝐧 𝐜𝐨𝐥𝐨𝐫 𝐲𝐨𝐮 𝐜𝐚𝐧 𝐨𝐩𝐞𝐧 𝐚 𝐥𝐨𝐧𝐠 𝐭𝐫𝐚𝐝𝐞 𝐚𝐧𝐝 𝐞𝐱𝐢𝐭 𝐰𝐡𝐞𝐧 𝐭𝐡𝐞 𝐫𝐞𝐝 𝐜𝐨𝐥𝐨𝐫 𝐚𝐩𝐩𝐞𝐚𝐫𝐬
I𝐧 𝐭𝐡𝐞 𝐬𝐚𝐦𝐞 𝐭𝐢𝐦𝐞 𝐰𝐞 𝐡𝐚𝐯𝐞 𝐨𝐭𝐡𝐞𝐫 𝐭𝐡𝐢𝐧𝐠𝐬 𝐭𝐨 𝐮𝐬𝐞 𝐰𝐢𝐭𝐡 𝐭𝐡𝐚𝐭 𝐰𝐨𝐮𝐥𝐝 𝐡𝐞𝐥𝐩 𝐮𝐬 𝐭𝐨 𝐦𝐚𝐤𝐞 𝐚 𝐠𝐨𝐨𝐝 𝐨𝐫𝐝𝐞𝐫
Like The 𝐂𝐲𝐜𝐥𝐞𝐫 𝐬𝐢𝐭𝐮𝐚𝐭𝐢𝐨𝐧 𝐚𝐧𝐝 𝐟𝐢𝐛𝐨𝐧𝐚𝐜𝐜𝐢 𝐥𝐞𝐯𝐞𝐥𝐬
We have the 𝐧𝐞𝐱𝐭 𝐟𝐢𝐛𝐨𝐧𝐚𝐜𝐜𝐢 𝐥𝐞𝐯𝐞𝐥𝐬 𝟐𝟎 ,𝟑𝟎 ,𝟓𝟎 ,𝟔𝟏.𝟖 ,𝟖𝟎 { 61.8 𝐢𝐬 𝐭𝐡𝐞 𝐭𝐡𝐞 𝐟𝐢𝐛𝐨𝐧𝐚𝐜𝐜𝐢 𝐠𝐨𝐥𝐝𝐞𝐧 𝐫𝐚𝐭𝐢𝐨 }
About The 𝐂𝐲𝐜𝐥𝐞𝐫 you can use it to know where is the current symbol go { UP : Green ,| Down : Red ,| White : Where the symbol movement is in a slight fluctuation without any significant up or down }
░▒▓█ 𝐍𝐨𝐭𝐞 : 𝐓𝐡𝐞 𝐂𝐲𝐜𝐥𝐞𝐫 𝐥𝐢𝐧𝐞 𝐢𝐬 𝐭𝐡𝐞 𝐬𝐚𝐦𝐞 𝐟𝐢𝐛𝐨𝐧𝐚𝐜𝐜𝐢 𝐥𝐞𝐯𝐞𝐥 ' 𝐫𝐚𝐭𝐢𝐨 𝟓𝟎 ' █▓▒░
𝐡𝐞𝐫𝐞'𝐬 𝐚 𝐟𝐚𝐬𝐭 𝐩𝐡𝐨𝐭𝐨 𝐭𝐡𝐚𝐭 𝐬𝐡𝐨𝐰 𝐞𝐯𝐞𝐫𝐲𝐭𝐡𝐢𝐧𝐠
- When the RSI EMA Line reach the purple 𝐟𝐢𝐛𝐨𝐧𝐚𝐜𝐜𝐢 level its a very good entry point where the RSI is over sold and ready to g oup again
- When the RSI EMA Line reach the Golden 𝐟𝐢𝐛𝐨𝐧𝐚𝐜𝐜𝐢 level its a very important area in the line crossover it then it's a very amazing entry time but if the RSI EMA line crossunder this line then the price w'll drop down
❤❤❤❤ 𝐟𝐢𝐧𝐚𝐥𝐥𝐲 𝐇𝐚𝐯𝐞 𝐚 𝐠𝐨𝐨𝐝 𝐭𝐢𝐦𝐞 ❤❤❤❤
Script open-source
Nello spirito di TradingView, l'autore di questo script lo ha reso open source, in modo che i trader possano esaminarne e verificarne la funzionalità. Complimenti all'autore! Sebbene sia possibile utilizzarlo gratuitamente, ricordiamo che la ripubblicazione del codice è soggetta al nostro Regolamento.
Declinazione di responsabilità
Le informazioni e le pubblicazioni non sono intese come, e non costituiscono, consulenza o raccomandazioni finanziarie, di investimento, di trading o di altro tipo fornite o approvate da TradingView. Per ulteriori informazioni, consultare i Termini di utilizzo.