Breakout Indicator + OB & FVG📈 Breakout Indicator + OB & FVG
This script is designed to assist with identifying potential breakout zones following periods of low volatility or price consolidation. It integrates price structure analysis with optional lunar phase filtering for enhanced visual insights.
🔍 Key Features
Consolidation Detection: Automatically identifies price ranges with low volatility over a user-defined lookback period.
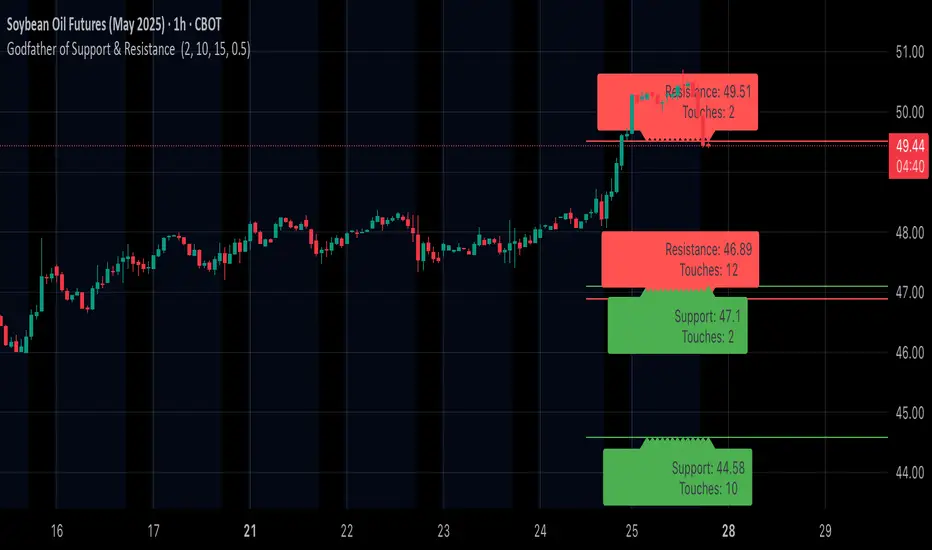
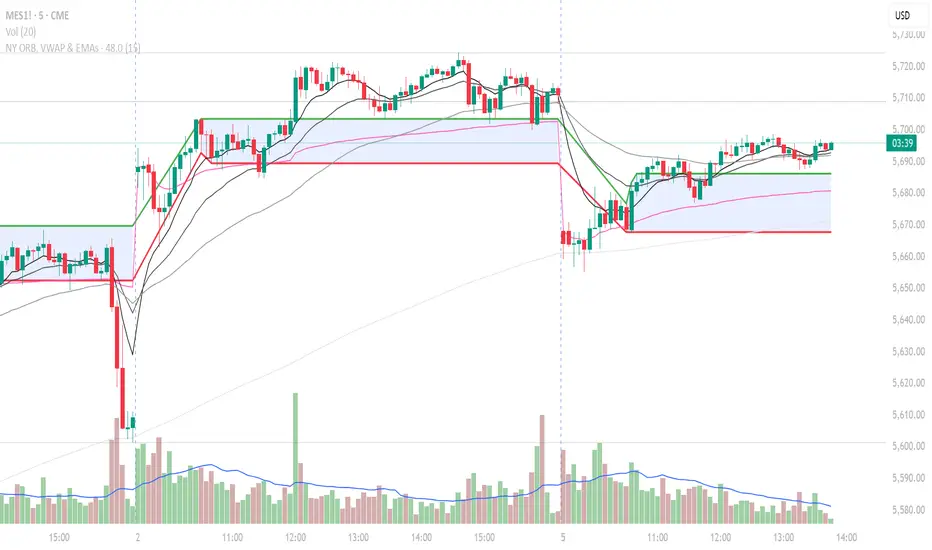
Breakout Signals: Highlights potential breakout zones when price moves beyond consolidation range highs or lows.
Take-Profit & Stop-Loss Levels: Automatically calculates three TP levels and one SL level based on user-defined multipliers.
Lunar Filter (Optional): Applies a visual overlay during full moon phases as a unique experimental timing filter.
Visual Elements:
Entry/TP/SL levels shown on chart with colored lines and labels.
Consolidation zones shaded with customizable colors.
Dynamic panel with volatility metrics and last signal info.
⚙️ Inputs & Customization
Adjustable lookback period, volatility threshold, and risk multipliers.
Optional lunar phase aggression multiplier.
Full customization of zone colors, label visibility, and transparency.
📌 Disclaimer
This indicator is a visual tool for analysis and does not provide financial advice or guaranteed outcomes. Its purpose is to support discretionary decision-making, not replace it. Past signals do not guarantee future performance. Always test tools thoroughly and use appropriate risk management.
🧠 Developer Notes
Based on simple volatility and price action mechanics.
The lunar filter is symbolic and not based on real astronomical data.
No repainting or future leaks; signals are generated based on confirmed candle closes.
Indicatore Pine Script®