[KL] Double Bollinger Bands Strategy (for Crypto/FOREX)This strategy uses a setup consisting of two Bollinger Bands based on the 20 period 20-SMA +/-
(a) upper/lower bands of two standard deviations apart, and
(b) upper/lower bands of one standard deviation apart.
We consider price at +/- one standard deviation apart from 20-SMA as the "Neutral Zone".
If price closes above Neutral Zone after a period of consolidation, then it's an opportunity for entry. Strategy will long, anticipating for breakout.
The illustration below shows price closing above the Neutral Zone after a period of consolidation.
a.c-dn.net
Position is exited when prices closes at Neutral Zone (being lower than prior bars)
Breakout

Trend lines + Pivot Levels + Candlestick PatternsThis is a pure PRICE ACTION indicator that will show you possible trend lines, pivot lines and candlestick patterns at once.
it has been designed to determine upper and lower trend lines in the chart and you can set candlestick patterns on them with alerts!
it means that you add the indicator to the chart and set the alert and done!
whenever a pinbar or engulf or breakout(in both directions) happens, you will be notified by alerts.
you also have pivot lines on the chart by this indicator. you can set the candlesticks on pivots instead of trend lines, so if you are a fan of support and resistance you can have this one, it depends on you.
all of the pivots and trend lines and also the candle sticks are customizable, so you can exactly select the pinbar, engulfing or breakout candle that matches with your mindset. for example you can set a pinbar that long shadow is 4 times or 3 times greater than the body, it's on you.
you can also customize trendlines or pivot lines, if you are scalper you can set it to small trend lines and if you are day trader or long term trader you can set it to the number that fits with your strategy.
trends and pivots will be updated automatically and there is no need to set it every time.
Be PROFITABLE!
$kMagician /*

Three Week Tight Pattern IndicatorThree Week Tight Pattern is a consolidation indicator which give extra buy point on strong fundamental stocks. You can read about it from IBD here: www.investors.com

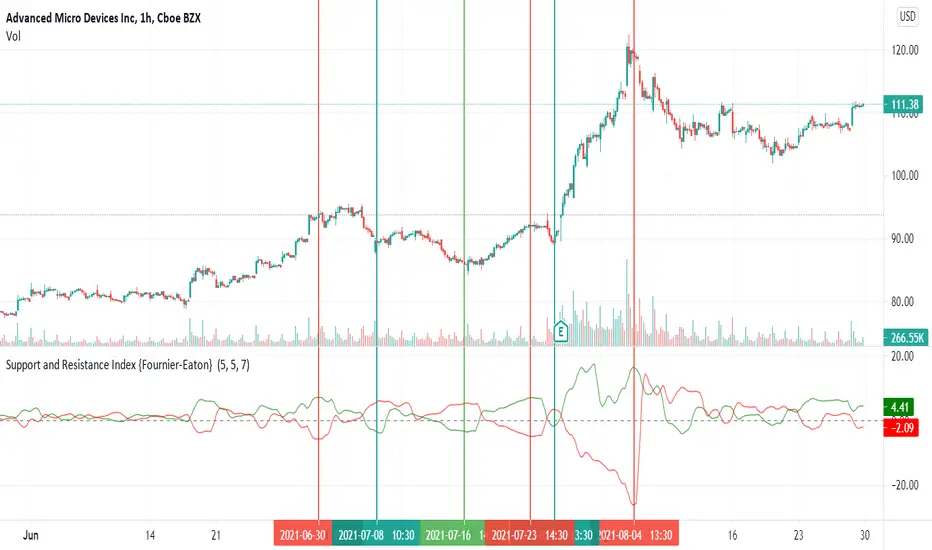
Support and Resistance Index {Fournier-Eaton} This algorithm quantifies the amount of pressure applied by support and resistance and helps confirm trend initiation as levels, relative to horizontal supports and resistances are broken.
Look for spread in the red and green lines
A low spread will usually indicate a rangebound stock as it is pressured on both sides equally by resistance and support
A high spread will typically indicate a stock prepared to make a new directional move.
A widening spread will indicate the continuation of a trend
A narrowing spread will indicate the beginning of a reversal.
More succinctly:
A large spread with RED OVER GREEN indicates a high probability of upward reversal -- think downtrend is exhausted.
A large spread with GREEN OVER RED indicates a high probability of downward reversal -- think uptrend is exhausted.
Shape and relative values (wide green over red etc), not indicator values are of importance, are the most important.
Feedback is always helpful and I hope you find this useful.
Pivot Points And Breakout Price Action With LuckyNickVaBar Color Candle Aligned with pivot points swing high and swing lows For Those Who Are Familiar with Trading The Breakouts Of Highs & Lows Of Structure. Pivots are said to be key areas in the market where price shows heavy reaction to where reversals make occur. At these points there are swing Highs & swing lows that traders may be able to find opportunity in the market. This Script is a combination of pivot points and Barcolor signals for the breakout.

SMART4TRADER-INDEX PATTERN BREAKOUT MULTIThis indicator is designed to analyze the breakdown of previous values of the candles, not only on the selected tool, but also on others. The indicator is well used on the indices of the stock market. In the default indicator, recommended indexes are configured.
The indicator summarizes the results of the analysis of all tools and shows in the form of columns that are above and \ or below the zero line. Additionally, the indicator has two horizontal lines above zero (green) and two horizontal lines below zero (red). The breakdown of these nearest to zero lines signals the possible beginning of the move towards which the column is directed. If the column reached the left line, this means that a very strong trend is noticeable on all the tools selected in the settings.
Additionally, the indicator has a blue line that shows the average value of the columns both above and below the zero line. And also added Hull Moving Average Period (9).
BUY signal:
HIGH > HIGH(1) и LOW > LOW(1)
SELL signal:
HIGH < HIGH(1) и LOW < LOW(1) и LOW < LOW(2)
--------------------------------------------------------
Этот индикатор предназначен для анализа пробития предыдущих значений свечей, не только на выбранном инструменте, но и на других. Индикатор хорошо использовать на индексах фондового рынка. В индикаторе по умолчанию настроены рекомендуемые индексы для анализа.
Индикатор суммирует результаты анализа всех инструментов и показывает в виде столбиков, которые находиться выше и\или ниже нулевой линии. Дополнительно на индикаторе есть две горизонтальные линии выше нуля (зеленый) и две горизонтальные линии ниже нуля (красный). Пробитие этих ближайших к нулю линий сигнализирует о возможном начале движения в сторону, в которую направлен столбик. Если столбик достиг крайней линии, то это значит, что очень сильный тренд заметен на всех инструментах выбранных в настройках.
Дополнительно в индикаторе есть синяя линия, которая показывает среднее значение столбиков как выше, так и ниже нулевой линии. А также добавлена HULL MOVING AVERAGE период (9).
Сигнал на покупку:
HIGH > HIGH(1) и LOW > LOW(1)
Сигнал на продажу:
HIGH < HIGH(1) и LOW < LOW(1) и LOW < LOW(2)

Boom Hunter ProBoom Hunter Pro is the ultimate indicator for targeting perfect long entries and epic shorts. Boom Hunter comes with a super fast oscillator that uses Ehlers Early Onset Trend (EOT). This is the Center Of Gravity Oscillator (COG) with a super smoothing filter and a roofing filter. This indicator is tuned for 1 hour charts but can be used on any time frame.
Colored bars can be turned on to assist in finding an entry. Purple signifies a drag and potential dump.
Fibonacci lines can be turned on to track price action and find entries/exit.
This indicator follows the same rules as COG. For more information please see my COG HOWTO here:

PriceCatch Breakout Signals IOHi TradingView Community.
Here is a script that identifies and marks two different breakout levels on the chart. It works on all instruments - equities, forex, crypto & commodities.
Probable Breakout Buy Level
Stop-Reverse Buy Level
The above chart is self-explanatory. The script uses two different formulas to look out for breakouts. This logic opens up more opportunities.
As the levels are marked in advance before the breakouts occur, it will give traders ample time to study further and plan the trade.
PLAYING SAFE
After taking the trade, to play safe, I follow this method that once the Low of the price goes above the Breakout Level, I usually shift the stop loss to buy price to protect against any sudden reversal. For me protecting capital is important. As usual with price action, longer time-frames produce more reliable signals.
STOP LOSS
While the initial stop level is suggested, traders may also use the ATR to set stop loss. Users may find my free script 'ATR value on Chart' useful.
NOTE - PRIOR TO USING THIS SCRIPT:
You may use this script in addition to your other indicators or independently. Please remember that the script is shared with absolutely no assurances and warranties whatsoever regarding usability and as a responsible trader, please satisfy yourselves thoroughly and use it only if you are convinced it works for you. Remember, you are 100% responsible for your actions. If you understand and accept that, you may use the script. The script does not identify any short signals.
QUERIES/FEEDBACK
Please PM me.
Regards to all and wish everyone all the best with trading.

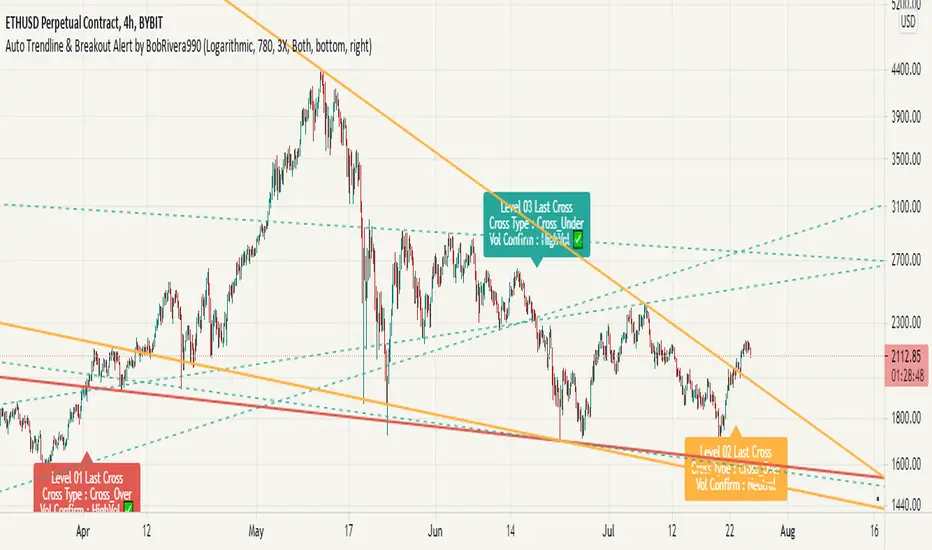
Auto Trendline & Breakout Alert(Linear / Log) Full-VersionContents
Overall Introduction
Does it repaint?
Features
Settings menu parameters
How to setup
Limits
Errors and Performance
Examples
Overall Introduction
This indicator is the best tool for breakout traders.
Drawing and evaluating the trend lines of multiple charts in different time frames is a very time-consuming and tedious task. In addition, being aware of breakouts in the shortest possible time requires constant monitoring.
With this tool, you can draw and classify trend lines in a fraction of a second and by placing an alert on any chart, you can receive notifications about breakouts, wherever you are.
The classification of trend lines is done based on the reaction of the price chart to the trend lines and the analysis of the trading volume.
This indicator is designed to reclassify trend lines with each reaction of the price chart. These lines are classified into 6 levels and these levels are distinguished by different colors. Thus, any touching or crossing of the price chart can make a difference.
Does it repaint?
Any tool that shows trend lines must repaint because trend lines are constantly changing. Some lines lose their strength and new ones are formed, so some lines should be removed and replaced with new lines and that means repainting.
The indicator should reflect the latest changes. So while repainting is a bad thing in a strategy, it is essential in this indicator.
This indicator is designed to reclassify trend lines with each reaction of the price chart. Thus, any touching or crossing of the price chart can make a difference.
Note that unlike alerts, breakout labels are not trading signals:
Breakout labels show the latest breakout for each level based on the lines that appear on the chart, so they may repaint or have delay.
But Alerts work differently, Alerts are triggered when one of the trend lines is broken and then the next candle is opened and has no any delay.
Features
This indicator is designed for use on both linear and logarithmic scales. It works linearly by default. If you are using a logarithmic chart, enter the settings menu and set the chart scale parameter to “Log”.
The indicator is equipped with the volume status tool to identify and avoid false breakouts. Note that you can't completely avoid false breakouts, but you can minimize risk and loss. I have already published volume status as a separate script.
Several filters are provided to customize alerts. You can limit alerts based on the level and strength of broken trend lines, volume status, and type of breakout (Cross-Over, Cross-Under, or both).
The last breakouts panel gives an overview of the current market situation. You can activate it in the settings menu. the figure below shows the panel:
Settings menu parameters
{Chart Scale …} =>
Set it according to the chart. If you are using a linear chart, select the "Linear" option or if you are using a logarithmic chart, select the "Log" option
{Max Operational Range Length ...} =>
This parameter specifies the number of candles processed by the indicator (By default, the last 1000 bars)
{Filter Out-Of-Range Lines} =>
The filter removes diverging or out-of-range lines and reduces the clutter of the chart
{Visible Trend Lines ...} =>
In this section you can specify which level of trend lines should be visible. Level 1 contains the strongest lines and level 6 contains the weakest.
{Alert Condition 01 _ Trendline Levels} =>
In this section, you can specify which level of trend lines will trigger an alert after the breakout. This section has been added to customize alerts.
{Alert Condition 02 _ Cross Type} =>
In this section, you can limit alerts based on the type of breakout (Cross-Over, Cross-Under or both). This section has been added to customize alerts.
{Alert Condition 03 _ Volume Status} =>
In this section, you can limit alerts by volume to avoid fake breakouts. This section has been added to customize alerts.
{Last Breakout Label} =>
In this section, you can enable or disable the last breakout labels.
{Panel} =>
In this section, you can enable or disable the last breakout panel or set its position on the chart.
How to setup
There are many parameters in the settings menu, but two are more important. One is “Chart Scale” and the other is the “Max Operational Range Length".
Set the “chart scale” parameter according to the chart, otherwise the trend lines drawn by the indicator do not match the price chart.
If you are using a linear chart, select the "Linear" option or if you are using a logarithmic chart, select the "Log" option.
Max Operational Range Length Limits the range of the price chart that is processed by the indicator.
By increasing this parameter:
The strength and durability of the trend lines increases.
The number of breakout signals decreases.
The importance of breakout signals increases.
The indicator processing load increases.
In the following figure, you can see the effects of increasing the “Max Operational Range Length" parameter:
Limits
Since this indicator makes extensive use of trading volume, it is necessary to use a chart with volume information.
But if the volume information is not provided by the vendor, indicator will continue to work based on the price chart only, and a warning message will be displayed below the chart to let you know.
Errors and Performance
The performance of this indicator depends on the “Max Operational Range Length” parameter in the settings menu because it performs calculations, within a range with the length of this parameter.
By increasing this parameter, the processing load increases. Sometimes you may encounter the following error: “Loop takes too long to execute (>200 ms)”
If you see this error, do one of the following:
Reduce the “Max Operational Range Length”.
Reset the indicator. To do this, double-click on the “Hide” button in front of the indicator name.
Examples
EURUSD (FX:EURUSD) – 1D // Scale: Logarithmic, Max Range Length = 1000, Filter: 2X
NASDAQ 100 (CME_MINI:NQ1!) - 1D // Scale: Logarithmic, Max Range Length = 700
GOLD (COMEX:GC1!) – 1D // Scale: Logarithmic, Max Range Length = 650, Filter: 2X
NATURAL GAS (NYMEX:NG1!) – 1D // Scale: Logarithmic, Max Range Length = 625, Filter: 4X
AMAZON (NASDAQ:AMZN) – 1D // Scale: Logarithmic, Max Range Length = 1750, Filter: 2X
APPLE INC (NASDAQ:AAPL) – 1D // Scale: Logarithmic, Max Range Length = 340, Filter: 4X
GBPUSD (FX:GBPUSD) – 1D // Scale: Logarithmic, Max Range Length = 1000, Filter: 3X
SILVER (COMEX:SI1!) – 1D // Scale: Logarithmic, Max Range Length = 550, Filter: 3X
BITCOIN (KUCOIN:BTCUSDT) – 4H // Scale: Logarithmic, Max Range Length = 1250, Filter: 3X
MICROSOFT (NASDAQ:MSFT) – 1D // Scale: Logarithmic, Max Range Length = 340, Filter: 4X
TOTAL (CRYPTOCAP:TOTAL) – 2H // Scale: Logarithmic, Max Range Length = 1075, Filter: 3X
Linear Regression & RSI Multi-Function Screener with Table-LabelHi fellow traders..
Happy to share a Linear Regression & RSI Multi-Function Custom Screener with Table-Labels...
The Screener scans for Linear Regression 2-SD Breakouts and RSI OB/OS levels for the coded tickers and gives Summary alerts
Uses Tables (dynamica resizing) for the scanner output instead of standard labels!
This Screener cum indicator collection has two distinct objectives..
1. Attempt re-entry into trending trades.
2. Attempt Counter trend trades using linear regression , RSI and Zigzag.
Briefly about the Screener functions..
a. It uses TABLES as Labels a FIRST for any Screener on TV.
b. Tables dynamically resize based on criteria..
c. Alerts for breakouts of the UPPER and the LOWER regression channels.(2 SD)
d. In addition to LinReg it also Screens RSI for OB/OS levels so a multifunction Screener.
e. Of course has the standard summary Alerts and programmable format for Custom functions.
f. Uses only the inbuilt Auto Fib and Lin Reg code for the screener.(No proprietary stuff)
g. The auto Zigzag code is derived(Auto fib).
Question what are all these doing in a single screener ??
ZigZag is very useful in determining Trend Up or Down from one Pivot to another.
So Once you have a firm view of the Current Trend for your chosen timeframe and ticker…
We can consider few possible trading scenarios..
a. Re-entry in an Up Trend - Combination of OS Rsi And a Lower Channel breach followed by a re-entry back into the regression channel CAN be used as an effective re-entry.
b. Similarily one can join a Down Trend on OB Rsi and Upper Channel line breach followed by re-entry into the regression channel.
If ZigZag signals a range-bound market, bound within channel lines then the Upper breakout can be used to Sell and vice-versa!
In short many possibilities for using these functions together with Scanner and Alerts.
This facilitates timely PROFITABLE Trending and Counter trend opportunities across multiple tickers.
You must give a thorough READ to the various available tutorials on ZigZag / Regression and Fib retracements before attempting counter trend trades using these tools!!
A small TIP – Markets are sideways or consolidating 70% of the time!!
Acknowledgements: - Thanks a lot DGTRD for the Auto ZigZag code and also for the eagerness to help wherever possible..Respect!!
Disclaimer: The Alerts and Screener are just few tools among many and not any kind of Buy/Sell recommendations. Unless you have sufficient trading experience please consult a Financial advisor before investing real money.
*The alerts are set for crossovers however for viewing tickers trading above or below the channel use code in line 343 and 344 after setting up the Alerts!
** RSI alerts are disabled by default to avoid clutter, but if needed one can activate code lines 441,442,444 and 445
Wish you all, Happy Profitable Trading!

STC Price Action ZoneHow this works:
This Indicator looks to identify patterns which shows high movement area which may have occurred due to big orders at that time. It helps to Identify Price Action Zones where we may anticipate some reverse move. These Zones & Moves are helpful for Traders.
Buying Zone is below current Market Price. It indicates Price Action area where Buyers overpowered Sellers hence there was big Leg out Candle. This zone may again give buying momentum if Price comes back to that level. As a Trader one may take opportunity enter into the Trade on Bullish Side.
Selling Zone is above current Market Price. It indicate Price Action area where Sellers overpowered Buyers hence there was big Leg out Candle. This zone may again give Selling momentum if Price comes back to that level. As a Trader one may take opportunity enter into the Trade on Bearish Side.
DISCLAIMER:
This indicator/code IS NOT intended to be a formal investment advice or recommendation by the author, nor should be construed as such. Users will be fully responsible by their use regarding their own trading vehicles/assets.
It is strongly recommended that you should get full knowledge of how price actions work and wait for the clear indications before attempting.

NVME Breakout DetectorMain Description:
NVME Breakout Detector is an indicator designed for breakout traders that helps those traders simplify trading through saving their time by automatically finding appropriate high and low zones on the chart for the trader. The indicator also provides the user with alerts of newly printed zones and zones that were broken through giving a trader the confirmation to stay in a trade longer or perhaps to find a new trade position following the trend that is shown.
How To Use It?
This is a beginner and user friendly indicator that is simple to follow, firstly the user should add this script on to their charts, secondly they will see 2 generated zones (the high being in red and the low being in green), once the user identifies those zones, the user should wait for price to close past those zones to get the idea that price may want to continue in that direction.
Settings:
Use Higher Accuracy Method - This will add another condition into the zone detection algorithm causing the indicator to detect less zones but these zones will be better for accuracy.
Use Bar Close - This will add another condition into the breakout calculator and alerts, which will force the indicator to wait for the bar to close before any confirmations can take place.
Show Breakout History - This will print all the previous zones and labels for the asset you are on.
Show Breakout Labels - This will show the breakout labels next to each zone and allow the user to see how many times that zone has been broken through or if it hasn't been broken through.
Supported Assets: All Assets Supported
Will This Come With Other NVME Scripts? Yes

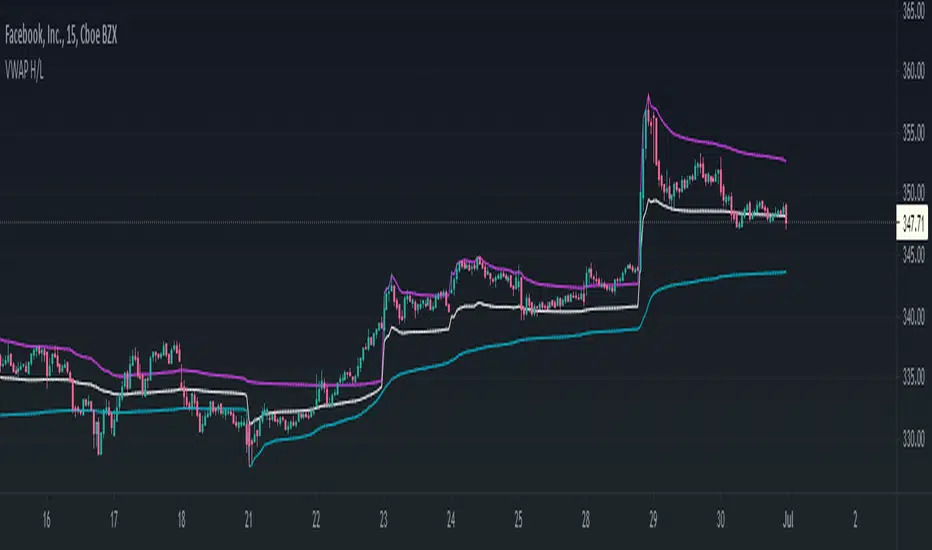
VWAP High/Low ChannelIn short, the VWAP High/Low Channel is based on VWAP "newsession" on swing high/low, with a basis of the two.
The VWAP High/Low channel seems to act like Bollinger bands or Donchain Channels when squeezing for a breakout, while also acting as a pivot after a breakout.
Ichimoku all signalsIchimoku Cloud All Signals!
This indicator shows all Ichimoku Cloud signals for (entering/exiting/confirming/or even staying) in a position.
you can choose a signal related to your strategy and use it.
you can choose which signals to be shown on the chart by changing the settings.
here are some examples of signals that you can get from this indicator:
Crossover/under conversion line & base line
Crossover/under lead line1 & lead line2
Crossover/under conversion line & lead line1
Crossover/under base line & lead line1
Crossover/under conversion line & lead line2
Crossover/under base line & lead line2
Crossover/under close & base line
Cloud Breakouts in both directions!
and 74 signals more !!!!

Volume Level with AlertThis script is made by Bollinger Bands and Volume , BB is using customize setting to filter the surge volume.
Good to use in Cryptocurrency
When Volume Breakout and price is drop, chance to collect at lower price
Try to find out Price * Volume Divergence , a best entry point with low risk

Ichimoku breakoutIf you use Ichimoku Cloud strategies, this indicator is very useful for you!
This code indicates the candles that break the ichimoku cloud in both directions!
conversion line, base line and lagging span are disable by default, you can enable it from settings window.
green triangles under the candles with green backgrounds show break out the red clouds.
red triangles at the top of the candles with red backgrounds show break out the red clouds.
you can set alerts to be notified when an Ichimoku Cloud is broken.

Breakout FinderHelo All,
I got many requests for a Breakout script and here it's. This script searches the breakouts/breakdowns and draw square if there is one.
The options:
"Period" is used to find Pivot Points
"Max Breakout Length" is the maximum length to search breakouts
"Threshold Rate %" is channel width of the breakout area. calculated using highest/lowest of last 300 bars.
"Minimum Number of Tests" is the minimum number of tests that the Price tried to break the S/R level
and some options for coloring and linestyle
Lets see some examples:
in this example "Minimum Number of Tests" is 2 so the Price must have tested to break resistance area 2 times and then it breaks it as seen in the screenshot:
in following example Threshold rate is %10, so the channel width is very big:
as you can see in followinf screenshot you can choose different colors and line styles:
Alerts added ;)
Enjoy!

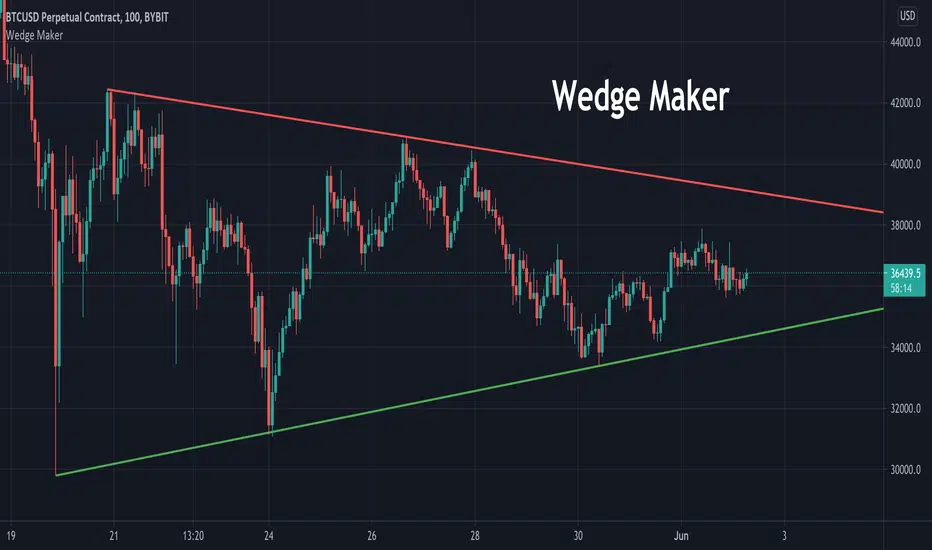
Wedge MakerThis tool is used to draw wedges. Traders can choose which pivot points to draw lines from in settings. Wedge Maker does not automatically detect current wedge and is required to be tweaked in settings.
Support and Resistance V1 This script is based on Range Support and Resistance .
It works by taking the range of the day,week and month calculating them and plotting 3 layers of Support and Resistance , as soon as it gets non directional /range bound , bar color turns GRAY if its in Bullish Trend and Pink if its in Bearish Trend .. As soon as bar turns Aqua it defines BULLISH Trend and RED bar color defines Bearish Trend . This way you can easily visualize the areas of support and resistance .
-----------------
Disclaimer
Copyright by FaizanNawazz.
The information contained in my scripts/indicators/strategies/ideas does not constitute financial advice or a solicitation to buy or sell any securities of any type. I will not accept liability for any loss or damage, including without limitation any loss of profit, which may arise directly or indirectly from the use of or reliance on such information.
All investments involve risk, and the past performance of a security, industry, sector, market, financial product, trading strategy, or individual’s trading does not guarantee future results or returns. Investors are fully responsible for any investment decisions they make. Such decisions should be based solely on an evaluation of their financial circumstances, investment objectives, risk tolerance, and liquidity needs.
My scripts/indicators are only for educational purposes!
Happy Trading!

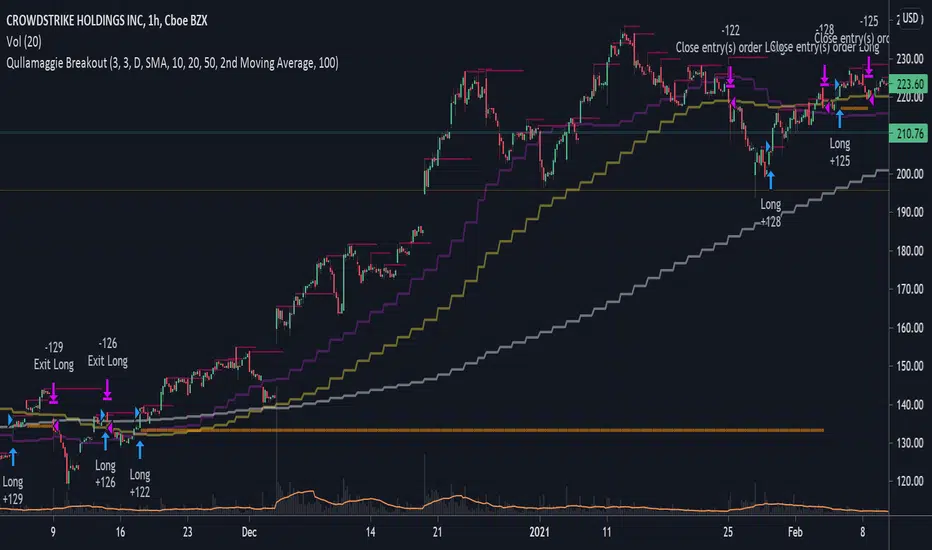
Qullamaggie BreakoutThe intent of this strategy is to buy breakouts with a tight stop on smaller timeframes in the direction of the longer term trend. Default longer term trend is the daily, but the user can choose any timeframe to use for the SMAs (which act as filters and trailing stops).
Exit the trade using a trailing stop of a close below either the 10 MA or 20 MA (user choice) on that larger timeframe as the position moves in your favor (i.e. whenever position price rises above the MA). This is one area where this script could use a little work or some human intervention - when the trade is entered right in the vicinity of the moving averages, you get some whipsaw. Not sure how to avoid that at this point though if you want to look at those longer term moving averages as your exit criteria.
Option of using daily ATR as a measure of finding contracting ranges and ensuring a decent risk/reward. (If the difference between the breakout point and your stop level is below a certain % of ATR, it could possibly find those consolidating periods.)
Best Bulls Bears Volume trend Breakout V2 [badshah_e_alam]This is a intraday indicator. Only to be used on timeframe less than daily charts.
This indicator purely uses volume to plot the graph. The indicator helps in conforming a breakout strategy.
This indicator is advanced version of my previously developed indicator you can check this link
Total volume is made up of buying volume and selling volume . Buying volume is the number of shares, contracts, or lots that were associated with green bars, and selling volume is the number that were associated with red bars.
The labels on the right side are the current bar value and that days bulls /bears weightage.
the first value shows the current bar volume.
second value show the bulls weight in %
third value show the bears weightage throughout the day ( %)
The Blue plot in graph keeps the track of bulls movement in intraday( %)
The Red plot in graph keeps the track of bears movement in intraday ( %)
X axis is time.
Y axis ranges from 100 to -100
I use 1:2 risk to reward ratio. Do your own research.
**not a financial advice**
Example of price increasing, volume decreasing
this indicator can be used for confirming a breakout strategy with bulls or bears in action. In the current example, the buyer’s volume percentage is reducing and the price is increasing throughout the day. Hence a breakout of the trendline is confirmation of a short trade.
Example of Price reducing, volume decreasing
example of price moving down , bears losing the grip
Example of price decreasing volume increasing
Thanks to nizar9599 for giving idea to improve my previous indicator.
DISCLAIMER
Any and all liability for risks resulting from investment transactions or other asset dispositions carried out by the user based on information received or a market analysis is expressly excluded by me.
All the information made available here is generally provided to serve as an example only, without obligation and without specific recommendations for action. It does not constitute and cannot replace investment advice. We therefore recommend that you contact your personal financial advisor before carrying out specific transactions and investments.
Do your own research, This is not a financial advice.

Open Range Breakout with TSLThis ORB with TSL Indicator Session Time is Indian NSE and BSE Equity Market
This indicator Provide you 2 type Setup
Opening Range Plot Only for Observation
1st Range Breakout = Long
2nd Range Breakout = Short
How to work This Indicator?
When Market is Open This Indicator automatically Plot Opening Range High and Low,
if Market bullish & Candle Close above Opening Range high When This Indicator automatically Plot 1st Range High and Low if You Want to 1st Range High Plot Crossingup any Candle You can Also Add Alerts
if Market Bearish & Candle Close Below Opening Range Low When This Indicator automatically Plot 2nd Range High and Low if You Want to 2nd Range Low Plot CrossingDown any Candle You can Also Add Alerts
If you Have any Suggestion please mention here
Thank you so much
This Also Automatically start trailing SL on basis of ATR

Matze BreakoutShows 2 different states of breakout:
Arrow = unusual volume, raising volume, positiv rate of change, standard deviation breakout
Bolt = very unusual volume, very high standard deviation breakout
