Hash Pivot DetectorHash Pivot Detector
Professional Support & Resistance Detection with Multi-Timeframe Zone Analysis
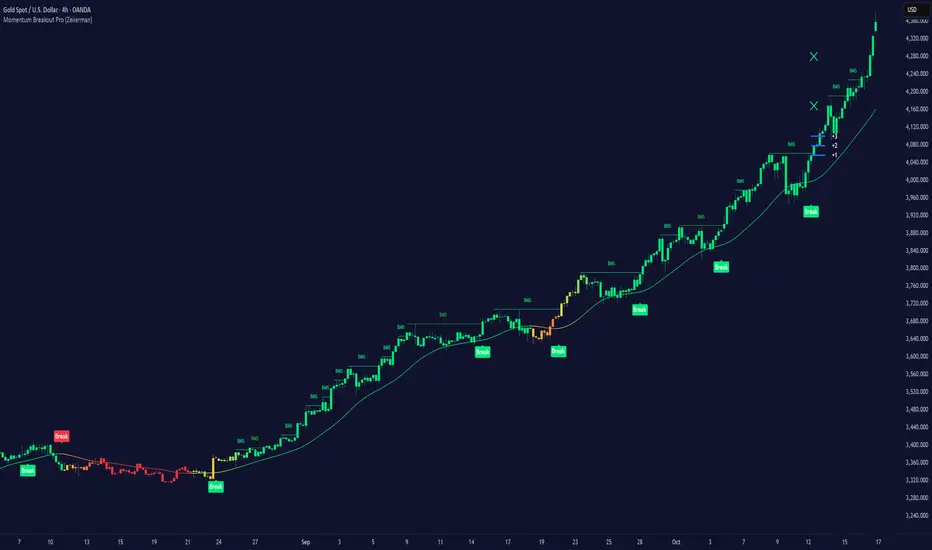
Developed by Hash Capital Research, the Hash Pivot Detector is a sophisticated indicator designed for identifying key support and resistance levels using pivot-based detection with institutional-grade zone analysis.
Key Features
Zone-Based Detection
Unlike traditional single-line S/R indicators, Hash Pivot Detector uses configurable zones around pivot levels to represent realistic institutional order areas. Adjustable zone width accommodates different asset volatilities.
Multi-Timeframe Analysis
Displays higher timeframe support/resistance levels alongside current timeframe pivots, providing crucial context for institutional positioning and stronger price barriers.
Clean Visual Design
Features Hash Capital's signature fluorescent color scheme (pink resistance, cyan support) optimized for dark charts with high contrast and instant visual recognition. Semi-transparent zones keep your chart clean and readable.
How It Works
The indicator uses pivot high/low detection with configurable left and right bar parameters. When a pivot is confirmed, it plots:
Primary support/resistance lines at pivot levels
Semi-transparent zones representing realistic order areas
Higher timeframe S/R levels as crosses for additional context
Recommended Settings
For Swing Trading:
Pivot Bars: 10-20 left/right
Zone Width: 0.5-1.0%
HTF: Daily (on 1H-4H charts)
For Intraday Trading:
Pivot Bars: 5-10 left/right
Zone Width: 0.3-0.5%
HTF: 1H or 4H (on 5min-15min charts)
Asset-Specific Zone Width:
Forex/Crypto: 0.3-0.5%
Stocks: 0.5-1.0%
Volatile Assets: 1.0-2.0%
What Makes It Different
✓ Zone-based approach (more realistic than lines)
✓ Multi-timeframe confluence detection
✓ Minimal visual clutter with maximum information
✓ Professional institutional aesthetic
✓ Comprehensive tooltips for easy optimization
✓ No repainting - all pivots are confirmed
Best Used For
Identifying high-probability entry/exit zones
Setting stop-loss and take-profit levels
Recognizing breakout/breakdown areas
Multi-timeframe confluence analysis
Swing trading and position trading
Intraday scalping with adjusted parameters
Notes
Works on all timeframes and markets
Fully customizable colors and parameters
All settings include detailed optimization guidance
Clean code, efficient performance
No alerts or notifications (visual analysis only)
Indicatore Pine Script®