Breakout Boxes [ChartPrime]⯁ OVERVIEW
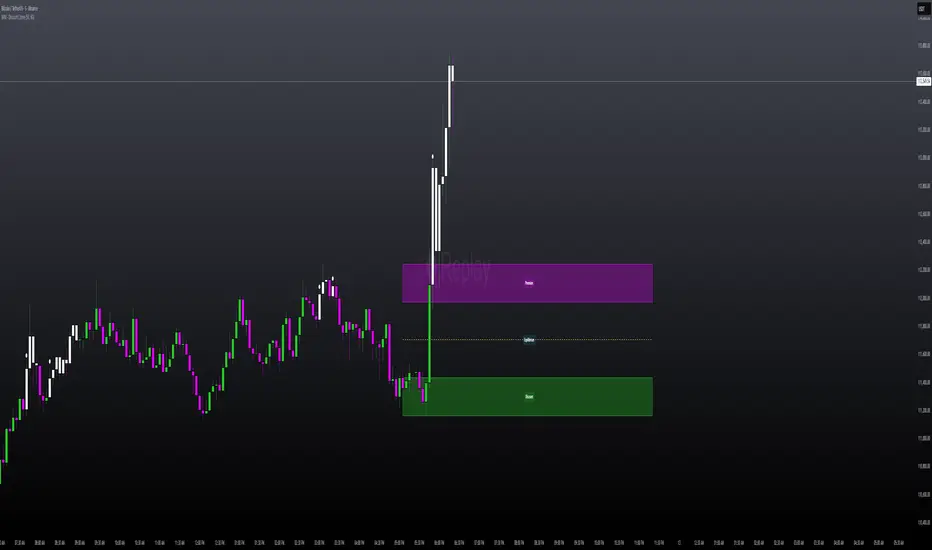
The Breakout Boxes indicator identifies key structural levels by detecting and aligning two consecutive pivots — forming confirmation zones where potential breakouts are most likely to occur. Once two pivots align within a defined ATR range, the indicator constructs a Breakout Box around that area, tracking volume distribution and breakout strength. When price breaks above or below these boxes, breakout labels (⯁ BreakUp / BreakDn) are displayed to confirm trend continuation.
⯁ KEY FEATURES
Pivot-Based Detection: Uses a customizable pivot length to identify market swing highs and lows.
Two-Pivot Alignment Logic: A breakout box is only created when two pivot highs or lows form near the same level, confirming structural alignment and increasing breakout reliability.
Dynamic Box Generation: Builds upper and lower boxes once pivot alignment is confirmed, adapting automatically to new structures.
Volume Distribution Analysis: Each box measures total traded volume and separates it into bullish and bearish components, showing buy/sell percentages inside the range.
The volume data is calculated in real time as long as the box remains active and unbroken, allowing traders to monitor live accumulation or distribution before a breakout occurs.
Breakout Confirmation Signals: Labels appear when price decisively breaks above the upper box (⯁ BreakUp) or below the lower one (⯁ BreakDn).
Adaptive ATR Scaling: Box size dynamically adjusts to volatility, maintaining consistent proportions across assets and timeframes.
Color-Coded Visualization: Upper (bearish) boxes use pink tones; lower (bullish) boxes use green, both with transparent fill for volume clarity.
Automatic Box Resetting: Previous boxes close when a new pivot pair forms, ensuring only the most relevant structure is active.
⯁ USAGE
Watch for Two Pivot Alignments — the indicator only activates when structural confluence exists, reducing false breakout signals.
Upper Boxes represent resistance formed by two aligned swing highs; a breakout above indicates potential bullish continuation.
Lower Boxes represent support formed by two aligned swing lows; a breakdown below indicates bearish continuation.
Analyze the Volume Ratio inside each box — higher buy volume in upper boxes supports bullish breakouts, while higher sell volume in lower boxes supports bearish moves.
Use this tool alongside trend indicators or higher timeframe context to confirm the direction of breakouts.
⯁ CONCLUSION
The Breakout Boxes indicator refines breakout analysis by requiring two aligned pivots to validate structural zones. By combining pivot confluence with volume distribution and adaptive ATR scaling, it provides a precise, data-backed visualization of breakout strength and direction — a powerful tool for structure-based trading confirmation.
Indicatore Pine Script®