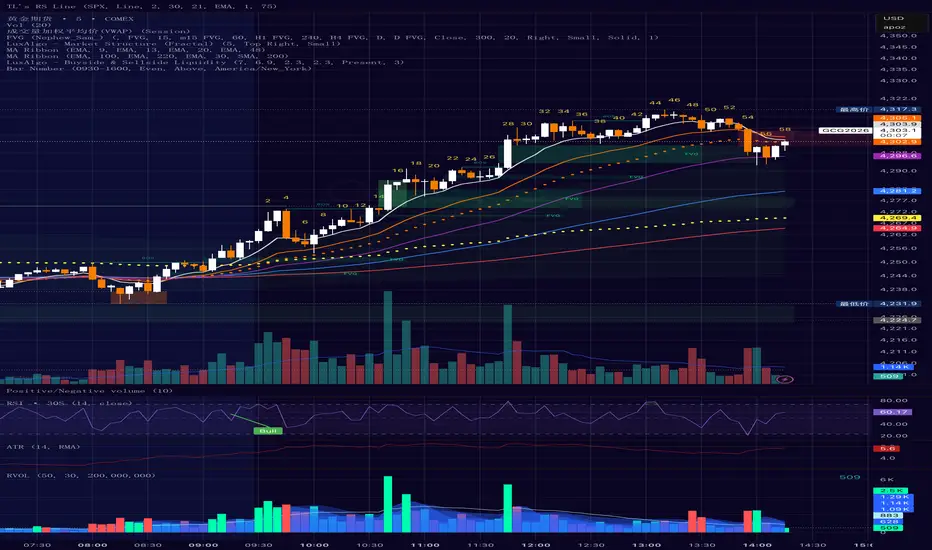
(5+15+60min+1D)EMA20+Y'SH/L+count简介: 这是一个专为 5分钟图表 (5min Chart) 日内交易者设计的综合辅助工具。它结合了多周期趋势均线、美股核心交易时段的时间周期计数以及关键流动性位置(前一日高低点)的智能突破监测。该脚本针对美股个股及 24/7 交易的 BTC/ETH 进行了优化,强制锁定纽约时间进行运算。
核心功能:
1. 多周期 EMA 监控系统 (MTF EMAs)
5min EMA20 (蓝色):日内短期趋势核心线(默认开启)。
60min EMA20 (绿色):小时级别趋势参考(默认开启)。
15min EMA20 (红色) & 1D EMA20 (橙色):可选开启,用于捕捉更大周期的支撑阻力。
特点:所有均线采用最细线宽,平滑显示,右上角表格实时展示当前价格。
2. 美股时段 Bar Count 计数器
时间锚定:以纽约时间 (New York Time) 09:30 开盘为起点(Bar 0)。
显示规则:仅在 K 线底部显示 偶数 序号 (0, 2, 4, 6 ...),直至第 82 根 K 线停止。
关键时间窗 (Time Pivots):
Bar 18 (约 NY 10:55) 和 Bar 40 (约 NY 12:45) 会被自动高亮。
字体变为 蓝色粗体,且对应 K 线实体变为蓝色,提示潜在的变盘或宏观流动性注入时刻。
3. 智能 PDH/PDL 射线 (Smart Rays)
精确锚点:前一日高点 (PDH) 和低点 (PDL) 的射线不是从开盘画起,而是从昨日形成高低点的具体时间点射出,精确还原价格行为。
自动阻断 (Breakout Logic):一旦当前价格触碰或突破该射线,射线将自动停止延伸,直观展示“阻力/支撑已失效”。
自动清理:每日自动清除旧线,仅保留当天的参考线,保持图表整洁。
4. 视觉优化
每日分割线:自动绘制灰色虚线分隔交易日。
图表限制:脚本仅在 5分钟图表上可见,切换周期自动隐藏,避免干扰大周期分析。
设置说明:
可在设置面板中自由开关各周期 EMA 的显示。
可开关底部的计数数字显示。
English Version (for TradingView Publishing)
Title: 5min Intraday Precision Toolkit: MTF EMAs + NY Session Count + Smart Rays
Introduction: This is a comprehensive auxiliary tool designed specifically for 5-minute chart intraday traders. It combines multi-timeframe trend EMAs, time cycle counting based on the US Session, and smart breakout monitoring for key liquidity levels (Previous Day High/Low). Optimized for US Equities and Crypto (BTC/ETH) using New York Time.
Key Features:
1. Multi-Timeframe EMA System
5min EMA20 (Blue): Core short-term intraday trend (On by default).
60min EMA20 (Green): Hourly trend reference (On by default).
15min EMA20 (Red) & 1D EMA20 (Orange): Optional overlays for higher timeframe support/resistance.
Visuals: All EMAs are rendered with fine lines for a clean look, accompanied by a top-right dashboard table.
2. NY Session Bar Count
Time Anchor: Starts counting from 09:30 New York Time (Bar 0).
Display Logic: Displays only EVEN numbers (0, 2, 4...) at the bottom of the bars, stopping at count 82.
Time Pivots:
Bar 18 (~10:55 NY) and Bar 40 (~12:45 NY) are highlighted.
Labels turn Bold Blue, and the specific candles are colored Blue to indicate potential reversal or liquidity injection times.
3. Smart PDH/PDL Rays
Precise Origin: Rays for Previous Day High (PDH) and Previous Day Low (PDL) originate from the exact timestamp they were created yesterday, not just the daily open.
Breakout Stop Logic: Rays automatically stop extending once price touches or breaks them, clearly indicating that the level has been tested.
Auto-Clean: Automatically removes old rays from previous days to keep the chart clean.
4. Visual Optimization
Daily Separators: Automatic vertical dotted lines marking new days.
Visibility: All elements are hidden on non-5m charts to prevent clutter.
Settings:
Toggle visibility for individual EMAs.
Toggle visibility for the bottom bar counter.
Candlestick analysis

Volume Orderblock Breakout — Naaganeunja Lite v3.6Upgrade for stable signals when candle is finished it stay forever, no signal same side
you can not be confused about signal so we can play with trading
FUCKING fantastic trading


Fanfans极简原版优化版### 中英文双语总结(300字内)
中文:该指标为Fanfans极简原版优化版,基于RSI和ATR构建核心交易信号,新增趋势(EMA)、成交量、时间、价格位置多维度过滤,及动态ATR倍数调整功能。含同方向订单间隔限制、多级止盈止损(支持阈值触发),内置信号质量评分、标签标注与警报推送,可自定义过滤规则和显示样式,通过多维度筛选降低无效信号,提升短周期交易信号准确性。
English: This is an optimized version of Fanfans' minimalist indicator, building core trading signals based on RSI and ATR. It adds multi-dimensional filters (trend/EMA, volume, time, price position) and dynamic ATR multiplier adjustment, includes same-direction order interval limits, multi-level SL/TP (supporting threshold triggers), built-in signal quality scoring, label annotation and alert push. Customizable filter rules and display styles reduce invalid signals via multi-dimensional screening, improving short-term trading signal accuracy.

teril 1H EMA50 Harami Reversal Alerts BB Touch teril Harami Reversal Alerts BB Touch (Wick Filter Added + 1H EMA50)
teril Harami Reversal Alerts BB Touch (Wick Filter Added + 1H EMA50)
teril Harami Reversal Alerts BB Touch (Wick Filter Added + 1H EMA50)
teril Harami Reversal Alerts BB Touch (Wick Filter Added + 1H EMA50)

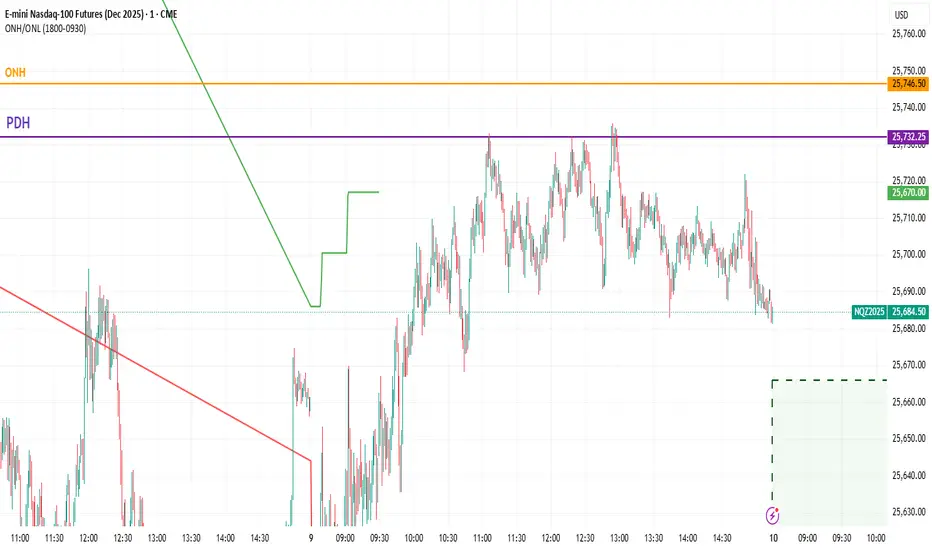
ONH / ONL Auto LevelsThis script automatically detects and plots the Overnight High (ONH) and Overnight Low (ONL) for each trading day.
It scans the entire overnight/Globex session (default: 18:00–09:30 EST for ES futures) and records the highest and lowest prices formed during that period.
At the start of the regular trading session (RTH), ONH and ONL levels remain on the chart as key liquidity zones.
These levels are commonly used for:
• Identifying liquidity sweeps
• Opening drive reversals
• Break-and-retest setups
• VWAP + ON levels confluence
• Scalping on 1m–5m charts
The script updates automatically every day and draws clean, minimal levels suitable for intraday traders.
Time settings can be adjusted to match any market or instrument.
3EMA-8EMA Current Candle Scannerintraday scanner can also be used for short term trades, crossing above the ema high and low with volume gives signal

Entry Scanner Conservative Option AKeeping it simple,
Trend,
RSI,
Stoch RSI,
MACD, checked.
Do not have entry where there is noise on selection, look for cluster of same entry signals.
If you can show enough discipline, you will be profitable.
CT

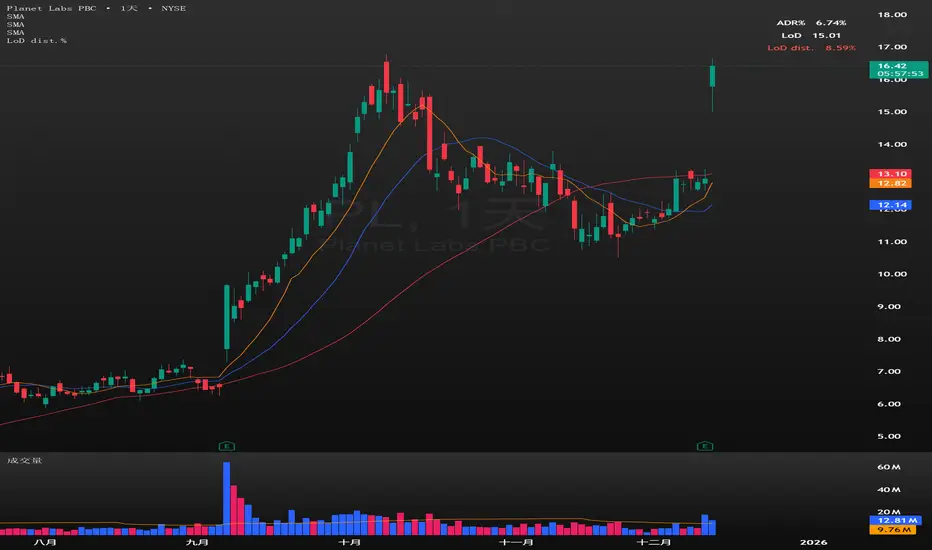
LoD dist.%Lod dist.% is to calculate the percentage distance between the lows of day price and the current price in real-time.
In addition, I also use 20 day ADR%, and based on the comparison to 20 day ADR%, I create the three color of Lod dist.% (green, yellow, and red), tells if the Lod dist.% is <=1/2 ADR% or >1/2 but <=1 ADR% or >1 ADR%.
This help me understand if the buy at the tight risk (green), or is it a chase (red).
True Gap Finder with Revisit DetectionTrue Gap Finder with Revisit Detection
This indicator is a powerful tool for intraday traders to identify and track price gaps. Unlike simple gap indicators, this script actively tracks the status of the gap, visualizing the void until it is filled (revisited) by price.
Key Features:
Active Gap Tracking: Finds gap-up and gap-down occurrences (where Low > Previous High or High < Previous Low) and actively tracks them.
Gap Zones (Clouds): Visually shades the empty "gap zone" (the void between the gap candles), making it instantly obvious where price needs to travel to fill the gap. The cloud disappears automatically once the gap is filled.
Dynamic Labels: automatically displays price labels at the origin of the gap, showing the specific price range (High-Low) that constitutes the gap. Labels are positioned intelligently to avoid cluttering current price action.
Alerts: Configurable alerts notify you the moment a gap is filled.
Customization: Full control over colors, clouds, labels, and alert settings to match your chart style.
How it works: The indicator tracks the most recent gap. If a new gap forms, it becomes the active focus. When price moves back to "close" or "fill" this gap area, the lines and clouds automatically stop plotting, giving you a clean chart that focuses only on open business.

Daily O/C Span (Real Values & SMA Comparison)This Pine Script indicator helps you visualize and track the "momentum" or "strength" of each trading day, and compares it to a recent average. It essentially measures the net movement of the price from when the market opens to when it closes.
What the Script Does
The script performs the following actions:
Calculates Daily Movement: For every single trading day, it calculates the difference between the closing price and the opening price (Close - Open).
Plots the "Span": These daily differences are plotted as vertical bars (a histogram) in a separate window below your main price chart.
-Green bars mean the stock closed higher than it opened (a strong day).
-Red bars mean the stock closed lower than it opened (a weak day).
Calculates the Average: It calculates the Simple Moving Average (SMA) of these daily spans over an adjustable period (default is 30 days).
Plots the Average Line: A blue line is plotted over the green/red bars, showing the typical magnitude of daily movement.
Displays Comparison: A table in the top-right corner provides a quick, real-time numerical comparison of today's span versus the 30-day average span.
How It Can Improve Trading
This indicator helps you understand the character and conviction of price action, offering several trading insights:
Gauging Momentum: It clarifies whether the stock's moves are generally strong and sustained within a day (large spans) or hesitant (small spans).
Identifying Trends: During an uptrend, you might expect the average span line to be consistently positive (above zero), and vice versa for a downtrend. A positive average span indicates buyers are consistently closing the day stronger than where they started it.
Spotting Reversals: If a stock is in a strong uptrend but you suddenly see a series of large red bars (large negative spans), it could signal a shift in momentum and potential upcoming reversal.
Volatility Context: By comparing the current day's bar to the blue average line, you can quickly determine if today is an unusually strong/weak day relative to recent history.
In short, it helps you see the underlying buyer/seller conviction within each day, making it easier to gauge the overall market sentiment and anticipate potential shifts.

Linechart + Wicks - by SupersonicFXThis is a simple indicator that shows the highs and lows (wicks) on the linechart.
You can vary the colors.
Nothing more to say.
Hope some of you find it useful.

HTF Candle Overlay – Multi-Timeframe Visualization ToolThis indicator overlays true Higher Timeframe (HTF) candlesticks directly onto any lower timeframe chart, allowing you to see the larger market structure while trading on precise execution timeframes such as 1-minute, 3-minute, or 5-minute.
Instead of constantly switching chart timeframes, you can now see both higher and lower timeframe price action at the same time. Each HTF candle is drawn as a large transparent candlestick with full upper and lower wicks, perfectly aligned in both time and price.
This makes it easy to identify:
- Trend direction from the higher timeframe
- Key support and resistance zones inside each HTF candle
- Liquidity sweeps and rejections across timeframes
- Optimal entries on lower timeframes with higher-timeframe confirmation
Key Features
- Displays true Higher Timeframe candles on any lower timeframe
- Clear transparent candle bodies for unobstructed price visibility
- Full upper and lower wicks
- Non-repainting confirmed candles
- Optional live display of the currently forming HTF candle
- Accurate time-based alignment
- Lightweight and optimized for performance
Who This Indicator Is For
- Scalpers who want higher-timeframe bias
- Day traders using multi-timeframe confirmation
- Smart Money / ICT traders monitoring HTF structure
- Anyone who wants clean multi-timeframe clarity without chart switching
How To Use
- Apply the indicator to any chart.
- Select your preferred Higher Timeframe (HTF) in the settings.
- Use your lower timeframe for entries while respecting HTF structure and direction.
- This tool helps you trade with the bigger picture in view while executing with precision on lower timeframes.

Custom RSI & Volume Condition//@version=5
indicator("Custom RSI & Volume Condition", overlay=true)
// دوال مساعدة
crossUp(src, level) =>
ta.crossover(src, level)
riseByPercent(src, percent, bars) =>
src > src * (1 + percent/100)
// حساب RSI
rsi = ta.rsi(close, 14)
// الشرط الأول: اختراق RSI لمستوى 45 أو 50
cond1 = crossUp(rsi, 45) or crossUp(rsi, 50)
// الشرط الثاني: RSI > 50 مع اختراق مستوى 55 أو 60
cond2 = (rsi > 50 and crossUp(rsi, 55)) or (rsi > 50 and crossUp(rsi, 60))
// الشرط الثالث: ارتفاع السعر بنسبة 2% مقارنة بالشمعة السابقة
cond3 = riseByPercent(close, 2, 1)
// الشرط الرابع: حجم التداول أكبر من حجم الشمعة السابقة
cond4 = volume > volume
// التجميع النهائي
signal = (cond1 or cond2) and cond3 and cond4
// عرض إشارة على الرسم
plotshape(signal, title="Buy Signal", style=shape.labelup, color=color.green, text="BUY")
NoProcess Prior Month/Week/Day High/Low/EQ Prior Period Levels
Plots key support/resistance levels from previous timeframes: Day, Week, and Month.
Levels Displayed:
PDH/PDL/PDE — Prior Day High, Low, and Equilibrium (midpoint)
PWH/PWL/PWE — Prior Week High, Low, and Equilibrium
PMH/PML/PME — Prior Month High, Low, and Equilibrium
Features:
Toggle each timeframe independently
Single color control for clean chart aesthetics
Configurable right extension (1-50 bars)
Dotted line style with labels positioned at line endpoints
Use Case:
Reference levels for institutional order flow concepts. Prior period highs/lows act as liquidity pools; equilibriums mark fair value zones where price often rebalances. Works on any instrument and timeframe.

Candle detector (Doji & Engulfing) with alerts by SimonezziStupid simple logic - get notified if needed when doji or engulfing candles show up.

猛の掟・本物っぽいTradingViewスクリーナー 完全版//@version=5
indicator("猛の掟・本物っぽいTradingViewスクリーナー 完全版", overlay=false, max_labels_count=500, max_lines_count=500)
// =============================
// 入力パラメータ
// =============================
emaLenShort = input.int(5, "短期EMA", minval=1)
emaLenMid = input.int(13, "中期EMA", minval=1)
emaLenLong = input.int(26, "長期EMA", minval=1)
macdFastLen = input.int(12, "MACD Fast", minval=1)
macdSlowLen = input.int(26, "MACD Slow", minval=1)
macdSignalLen = input.int(9, "MACD Signal", minval=1)
macdZeroTh = input.float(0.2, "MACDゼロライン近辺とみなす許容値", step=0.05)
volMaLen = input.int(5, "出来高平均日数", minval=1)
volMinRatio = input.float(1.3, "出来高倍率(初動判定しきい値)", step=0.1)
volStrongRatio = input.float(1.5, "出来高倍率(本物/三点シグナル用)", step=0.1)
highLookback = input.int(60, "直近高値の参照本数", minval=10)
pullbackMin = input.float(5.0, "押し目最小 ", step=0.5)
pullbackMax = input.float(15.0, "押し目最大 ", step=0.5)
breakLookback = input.int(15, "レジブレ後とみなす本数", minval=1)
wickBodyMult = input.float(2.0, "ピンバー:下ヒゲが実体の何倍以上か", step=0.5)
// 表示設定
showPanel = input.bool(true, "下パネルにスコアを表示する")
showTable = input.bool(true, "右上に8条件チェック表を表示する")
// =============================
// 基本指標計算
// =============================
emaShort = ta.ema(close, emaLenShort)
emaMid = ta.ema(close, emaLenMid)
emaLong = ta.ema(close, emaLenLong)
= ta.macd(close, macdFastLen, macdSlowLen, macdSignalLen)
volMa = ta.sma(volume, volMaLen)
volRatio = volMa > 0 ? volume / volMa : 0.0
recentHigh = ta.highest(high, highLookback)
prevHigh = ta.highest(high , highLookback)
pullbackPct = recentHigh > 0 ? (recentHigh - close) / recentHigh * 100.0 : 0.0
// ローソク足要素
body = math.abs(close - open)
upperWick = high - math.max(open, close)
lowerWick = math.min(open, close) - low
// =============================
// A:トレンド条件
// =============================
emaUp = emaShort > emaShort and emaMid > emaMid and emaLong > emaLong
goldenOrder = emaShort > emaMid and emaMid > emaLong
aboveEma2 = close > emaLong and close > emaLong
trendOK = emaUp and goldenOrder and aboveEma2
// =============================
// B:MACD条件
// =============================
macdGC = ta.crossover(macdLine, macdSignal)
macdNearZero = math.abs(macdLine) <= macdZeroTh
macdUp = macdLine > macdLine
macdOK = macdGC and macdNearZero and macdUp
// =============================
// C:出来高条件
// =============================
volInitOK = volRatio >= volMinRatio // 8条件用
volStrongOK = volRatio >= volStrongRatio // 三点シグナル用
volumeOK = volInitOK
// =============================
// D:ローソク足パターン
// =============================
isBullPinbar = lowerWick > wickBodyMult * body and lowerWick > upperWick and close >= open
isBullEngulf = close > open and open < close and close > open
isBigBullCross = close > emaShort and close > emaMid and open < emaShort and open < emaMid and close > open
candleOK = isBullPinbar or isBullEngulf or isBigBullCross
// =============================
// E:価格帯(押し目&レジブレ)
// =============================
pullbackOK = pullbackPct >= pullbackMin and pullbackPct <= pullbackMax
isBreakout = close > prevHigh and close <= prevHigh
barsSinceBreak = ta.barssince(isBreakout)
afterBreakZone = barsSinceBreak >= 0 and barsSinceBreak <= breakLookback
afterBreakPullbackOK = afterBreakZone and pullbackOK and close > emaShort
priceOK = pullbackOK and afterBreakPullbackOK
// =============================
// 8条件の統合
// =============================
allRulesOK = trendOK and macdOK and volumeOK and candleOK and priceOK
// =============================
// 最終三点シグナル
// =============================
longLowerWick = lowerWick > wickBodyMult * body and lowerWick > upperWick
macdGCAboveZero = ta.crossover(macdLine, macdSignal) and macdLine > 0
volumeSpike = volStrongOK
finalThreeSignal = longLowerWick and macdGCAboveZero and volumeSpike
buyConfirmed = allRulesOK and finalThreeSignal
// =====================================================
// スクリーナー用スコア(0=なし, 1=猛, 2=確)
// =====================================================
score = buyConfirmed ? 2 : (allRulesOK ? 1 : 0)
// 色分け(1行で安全な書き方)
col = score == 2 ? color.new(color.yellow, 0) : score == 1 ? color.new(color.lime, 0) : color.new(color.gray, 80)
// -----------------------------------------------------
// ① 視覚用:下パネルのカラム表示
// -----------------------------------------------------
plot(showPanel ? score : na,
title = "猛スコア(0=なし,1=猛,2=確)",
style = plot.style_columns,
color = col,
linewidth = 2)
hline(0, "なし", color=color.new(color.gray, 80))
hline(1, "猛", color=color.new(color.lime, 60))
hline(2, "確", color=color.new(color.yellow, 60))
// -----------------------------------------------------
// ② Data Window 用出力(スクリーナー風)
// -----------------------------------------------------
plot(score, title="Score_0なし1猛2確", color=color.new(color.white, 100), display=display.data_window)
plot(allRulesOK ? 1 : 0, title="A_Trend_OK", color=color.new(color.white, 100), display=display.data_window)
plot(macdOK ? 1 : 0, title="B_MACD_OK", color=color.new(color.white, 100), display=display.data_window)
plot(volumeOK ? 1 : 0, title="C_Volume_OK", color=color.new(color.white, 100), display=display.data_window)
plot(candleOK ? 1 : 0, title="D_Candle_OK", color=color.new(color.white, 100), display=display.data_window)
plot(priceOK ? 1 : 0, title="E_Price_OK", color=color.new(color.white, 100), display=display.data_window)
plot(longLowerWick ? 1 : 0, title="F_Pin下ヒゲ_OK", color=color.new(color.white, 100), display=display.data_window)
plot(macdGCAboveZero ? 1 : 0, title="G_MACDゼロ上", color=color.new(color.white, 100), display=display.data_window)
plot(volumeSpike ? 1 : 0, title="H_出来高1.5倍", color=color.new(color.white, 100), display=display.data_window)
// -----------------------------------------------------
// ③ 右上に「8条件チェック表」を表示(最終バーのみ)
// -----------------------------------------------------
var table info = table.new(position.top_right, 2, 9,
border_width = 1,
border_color = color.new(color.white, 60))
// 1行分の表示用ヘルパー
fRow(string label, bool cond, int row) =>
color bg = cond ? color.new(color.lime, 70) : color.new(color.red, 80)
string txt = cond ? "達成" : "未達"
// 左列:条件名
table.cell(info, 0, row, label, text_color = color.white, bgcolor = color.new(color.black, 0))
// 右列:結果(達成 / 未達)
table.cell(info, 1, row, txt, text_color = color.white, bgcolor = bg)
if barstate.islast and showTable
// ヘッダー(2列とも黒背景)
table.cell(info, 0, 0, "猛の掟 8条件チェック", text_color = color.white, bgcolor = color.new(color.black, 0))
table.cell(info, 1, 0, "", text_color = color.white, bgcolor = color.new(color.black, 0))
fRow("A: トレンド", trendOK, 1)
fRow("B: MACD", macdOK, 2)
fRow("C: 出来高", volumeOK, 3)
fRow("D: ローソク", candleOK, 4)
fRow("E: 押し目/レジブレ", priceOK, 5)
fRow("三点: ヒゲ", longLowerWick, 6)
fRow("三点: MACDゼロ上", macdGCAboveZero,7)
fRow("三点: 出来高1.5倍", volumeSpike, 8)

AQR Momentum AQR Momentum – Short Description
Uses the slopes of 20/55/200-day moving averages to measure short-, mid-, and long-term trend direction.
Green = rising trend; Red = falling trend.
55-day slope is the primary momentum signal; 200-day shows the market regime.

cảnh báo Khi Nến M15 Đóngtoday timeframe today timeframe today timeframe today timeframe today timeframe

GEBRID Quantum Flow v2GEBRID Quantum Flow v2 is a non-repainting technical indicator that combines price structure, volume, volatility and VWAP analysis to support market context assessment using native TradingView data only.

CRR 5P ZZ SIMPLEIt detects High and Low pivots using the number of bars you choose.
It connects these pivots, forming a professional ZigZag pattern.
Every time the price changes direction (from high to low or low to high), it draws a new leg of the movement.
Each leg receives a number from 1 to 5, showing the "Elliott" wave sequence simply and automatically.
⚙️ How does it work?
It identifies a HIGH pivot → bullish leg.
It identifies a LOW pivot → bearish leg.
When it detects a change from HIGH to LOW or LOW to HIGH:
It draws the ZigZag line.
It advances the wave counter (1–5).
It places a number in the middle of the line.
Green lines represent bullish legs,
red lines represent bearish legs.
🎯 What is it for?
To see the real market structure without noise.
To quickly identify key movements.
To help you understand the 1–5 wave progression without complications.
Ideal for scalping, day trading, and structural analysis.
If you'd like, I can create a short manual, a client version, or a marketing-style explanation for social media.
Ichimoku + VWAP + OBV + ATR Full System (NQ Daytrade)This script provides optimized scalping signals for BTC, designed mainly for the 15-minute timeframe.
Long/short entries are generated using VWAP band position and trend confirmation logic.
OBV momentum is used as a secondary filter to validate breakout or reversal conditions.
Exit signals are displayed when volatility compression or mean-reversion conditions occur.
Simple visual markers (triangles and circles) are included for easy decision-making.
롱/숏 삼각형 시그널
동그라미 청산 시그널
VWAP 밴드 기반 방향성
OBV 보조지표
이름 (Name)
BTC Scalping Signal – VWAP + OBV
짧은 설명 (Short Description)
VWAP 밴드와 OBV를 기반으로 방향성, 진입·청산 시그널을 제공하는 스캘핑 지표입니다.
긴 설명 (Long Description)
이 지표는 BTC 단기 스캘핑을 위해 설계된 것으로, 특히 15분봉 환경에 최적화되어 있습니다.
VWAP 밴드의 위치와 추세 판별 로직을 기반으로 롱·숏 진입 신호를 제공합니다.
OBV 모멘텀을 보조 필터로 사용하여 돌파 및 되돌림 가능성을 판단합니다.
시장 변동성이 축소되거나 평균회귀 신호가 감지될 때 청산 시그널을 표시합니다.
삼각형(진입), 원형(청산) 등 직관적 시각 요소를 통해 빠른 의사결정을 지원합니다.

Bar Number IndicatorBar Number Indicator
This Pine Script indicator is designed to help intraday traders by automatically numbering candlesticks within a user-defined trading session. This is particularly useful for strategies that rely on specific bar counts (e.g., tracking the 1st, 18th, or 81st bar of the day).
Key Features:
Session-Based Counting: Automatically resets the count at the start of each new session (default 09:30 - 16:00).
Timezone Flexibility: Includes a dropdown to select your specific trading timezone (e.g., America/New_York), ensuring accurate session start times regardless of your local time or the exchange's default setting.
Smart Display Modes: Choose to show "All" numbers, or filter for "Odd" / "Even" numbers to keep your chart clean.
Custom Positioning: Easily place the numbers Above or Below the candlesticks.
Minimalist Design: Numbers are displayed as floating text without distracting background bubbles.