MACD Trend Count ScoreThis indicator aims to confirm trends in an asset's price. This confirmation is achieved by counting the MACD bars in a calculation using the chosen timeframe. Positive and negative bars are considered in the calculation of the strength index, which indicates the current trend of that asset.
This Delta index summarizes the predominance of positive or negative bars in the MACD histogram over weekly, bi-weekly, monthly, bi-monthly, and quarterly periods, and, depending on the timeframe used, its result allows one to indicate the intensity of the current trend, according to the results it shows within the following ranges:
Acima de +60 → Strong Raise.
Entre +20 e +60 → Moderate High.
Entre -20 e +20 → Neutral.
Entre -60 e -20 → Moderate Low.
Abaixo de -60 → Strong Low.
Candlestick analysis

Volatility High/Low Projection (PHOD / PLOD)AP Capital – Volatility + High/Low Projection
This indicator is designed to identify high-probability intraday turning points by combining daily range statistics, session behaviour, and volatility context into a single clean framework.
It is built for index, forex, and metals traders who want structure, not noise.
🔹 Core Features
1️⃣ Potential High of Day (PHOD) & Potential Low of Day (PLOD)
The indicator highlights likely intraday extremes based on:
Session timing (Asia, London, New York)
Current day volatility vs historical averages
Prior day expansion or compression behaviour
Each level is displayed with:
A clear label (PHOD / PLOD)
A forward-extending box acting as a live Point of Interest (POI)
Automatic invalidation when price breaks the zone
2️⃣ Volatility & Range Context (Info Panel)
A compact information panel in the top-right corner provides real-time context without cluttering the chart:
20-Day Average Range
% of the average range already used today
Range status (NORMAL / EXHAUSTED)
Average session ranges for:
Asia
London
New York
This allows traders to immediately assess whether price is:
Early in the day with room to trend
Statistically stretched and prone to reversal
Over-extended where breakout chasing is risky
3️⃣ Session-Aware Logic
The model respects how markets behave across the trading day:
Asia favours accumulation and potential lows
London provides expansion
New York often delivers distribution or exhaustion
This prevents random high/low marking and focuses only on structurally meaningful levels.
🧠 How to Use
Use PHOD / PLOD boxes as reaction zones, not blind entries
Combine with your own confirmation (structure break, momentum, volume, EMA reclaim, etc.)
Avoid chasing trades when the Range Status = EXHAUSTED
Particularly effective on 15m – 1h timeframes
⚠️ Important Notes
This indicator does not repaint
It is contextual, not a buy/sell signal generator
Best used as part of a complete trading plan
📈 Suitable Markets
XAUUSD (Gold)
Indices (NASDAQ, S&P 500, DAX)
Major FX pairs
📌 Disclaimer
This indicator is for educational and analytical purposes only.
It does not constitute financial advice. Trading involves risk.

new takesi_2Step_Screener_MOU_KAKU_FIXED4 (Visible)//@version=5
indicator("MNO_2Step_Screener_MOU_KAKU_FIXED4 (Visible)", overlay=true, max_labels_count=500)
// =========================
// Inputs
// =========================
emaSLen = input.int(5, "EMA Short (5)")
emaMLen = input.int(13, "EMA Mid (13)")
emaLLen = input.int(26, "EMA Long (26)")
macdFast = input.int(12, "MACD Fast")
macdSlow = input.int(26, "MACD Slow")
macdSignal = input.int(9, "MACD Signal")
macdZeroTh = input.float(0.2, "MOU: MACD near-zero threshold", step=0.05)
volLookback = input.int(5, "Volume MA days", minval=1)
volMinRatio = input.float(1.3, "MOU: Volume ratio min", step=0.1)
volStrong = input.float(1.5, "Strong volume ratio (Breakout/KAKU)", step=0.1)
volMaxRatio = input.float(3.0, "Volume ratio max (filter)", step=0.1)
wickBodyMult = input.float(2.0, "Pinbar: lowerWick >= body*x", step=0.1)
pivotLen = input.int(20, "Resistance lookback", minval=5)
pullMinPct = input.float(5.0, "Pullback min (%)", step=0.1)
pullMaxPct = input.float(15.0, "Pullback max (%)", step=0.1)
breakLookbackBars = input.int(5, "Pullback route: valid bars after break", minval=1)
// --- Breakout route (押し目なし初動ブレイク) ---
useBreakoutRoute = input.bool(true, "Enable MOU Breakout Route (no pullback)")
breakConfirmPct = input.float(0.3, "Break confirm: close > R*(1+%)", step=0.1)
bigBodyLookback = input.int(20, "Break candle body MA length", minval=5)
bigBodyMult = input.float(1.2, "Break candle: body >= MA*mult", step=0.1)
requireCloseNearHigh = input.bool(true, "Break candle: close near high")
closeNearHighPct = input.float(25.0, "Close near high threshold (% of range)", step=1.0)
allowMACDAboveZeroInstead = input.bool(true, "Breakout route: allow MACD GC above zero instead")
// 表示
showEMA = input.bool(true, "Plot EMAs")
showMou = input.bool(true, "Show MOU label")
showKaku = input.bool(true, "Show KAKU label")
// ★ここを改善:デバッグ表はデフォルトON
showDebugTbl = input.bool(true, "Show debug table (last bar)")
// ★稼働確認ラベル(最終足に必ず出す)
showStatusLbl = input.bool(true, "Show status label (last bar always)")
locChoice = input.string("Below Bar", "Label location", options= )
lblLoc = locChoice == "Below Bar" ? location.belowbar : location.abovebar
// =========================
// EMA
// =========================
emaS = ta.ema(close, emaSLen)
emaM = ta.ema(close, emaMLen)
emaL = ta.ema(close, emaLLen)
plot(showEMA ? emaS : na, color=color.new(color.yellow, 0), title="EMA 5")
plot(showEMA ? emaM : na, color=color.new(color.blue, 0), title="EMA 13")
plot(showEMA ? emaL : na, color=color.new(color.orange, 0), title="EMA 26")
emaUpS = emaS > emaS
emaUpM = emaM > emaM
emaUpL = emaL > emaL
goldenOrder = emaS > emaM and emaM > emaL
above26_2days = close > emaL and close > emaL
// 勝率維持の土台(緩めない)
baseTrendOK = (emaUpS and emaUpM and emaUpL) and goldenOrder and above26_2days
// =========================
// MACD
// =========================
= ta.macd(close, macdFast, macdSlow, macdSignal)
macdGC = ta.crossover(macdLine, macdSig)
macdUp = macdLine > macdLine
macdNearZero = math.abs(macdLine) <= macdZeroTh
macdGCAboveZero = macdGC and macdLine > 0 and macdSig > 0
macdMouOK = macdGC and macdNearZero and macdUp
macdBreakOK = allowMACDAboveZeroInstead ? (macdMouOK or macdGCAboveZero) : macdMouOK
// =========================
// Volume
// =========================
volMA = ta.sma(volume, volLookback)
volRatio = volMA > 0 ? (volume / volMA) : na
volumeMouOK = volRatio >= volMinRatio and volRatio <= volMaxRatio
volumeStrongOK = volRatio >= volStrong and volRatio <= volMaxRatio
// =========================
// Candle patterns
// =========================
body = math.abs(close - open)
upperWick = high - math.max(open, close)
lowerWick = math.min(open, close) - low
pinbar = (lowerWick >= wickBodyMult * body) and (lowerWick > upperWick) and (close >= open)
bullEngulf =
close > open and close < open and
close >= open and open <= close
bigBull =
close > open and
open < emaM and close > emaS and
(body > ta.sma(body, 20))
candleOK = pinbar or bullEngulf or bigBull
// =========================
// Resistance / Pullback route
// =========================
res = ta.highest(high, pivotLen)
pullbackPct = res > 0 ? (res - close) / res * 100.0 : na
pullbackOK = pullbackPct >= pullMinPct and pullbackPct <= pullMaxPct
brokeRes = ta.crossover(close, res )
barsSinceBreak = ta.barssince(brokeRes)
afterBreakZone = (barsSinceBreak >= 0) and (barsSinceBreak <= breakLookbackBars)
pullbackRouteOK = afterBreakZone and pullbackOK
// =========================
// Breakout route (押し目なし初動ブレイク)
// =========================
breakConfirm = close > res * (1.0 + breakConfirmPct / 100.0)
bullBreak = close > open
bodyMA = ta.sma(body, bigBodyLookback)
bigBodyOK = bodyMA > 0 ? (body >= bodyMA * bigBodyMult) : false
rng = math.max(high - low, syminfo.mintick)
closeNearHighOK = not requireCloseNearHigh ? true : ((high - close) / rng * 100.0 <= closeNearHighPct)
mou_breakout =
useBreakoutRoute and
baseTrendOK and
breakConfirm and
bullBreak and
bigBodyOK and
closeNearHighOK and
volumeStrongOK and
macdBreakOK
mou_pullback = baseTrendOK and volumeMouOK and candleOK and macdMouOK and pullbackRouteOK
mou = mou_pullback or mou_breakout
// =========================
// KAKU (Strict): 8条件 + 最終三点
// =========================
cond1 = emaUpS and emaUpM and emaUpL
cond2 = goldenOrder
cond3 = above26_2days
cond4 = macdGCAboveZero
cond5 = volumeMouOK
cond6 = candleOK
cond7 = pullbackOK
cond8 = pullbackRouteOK
all8_strict = cond1 and cond2 and cond3 and cond4 and cond5 and cond6 and cond7 and cond8
final3 = pinbar and macdGCAboveZero and volumeStrongOK
kaku = all8_strict and final3
// =========================
// Display (猛 / 猛B / 確)
// =========================
showKakuNow = showKaku and kaku
showMouPull = showMou and mou_pullback and not kaku
showMouBrk = showMou and mou_breakout and not kaku
plotshape(showMouPull, title="MOU_PULLBACK", style=shape.labelup, text="猛",
color=color.new(color.lime, 0), textcolor=color.black, location=lblLoc, size=size.tiny)
plotshape(showMouBrk, title="MOU_BREAKOUT", style=shape.labelup, text="猛B",
color=color.new(color.lime, 0), textcolor=color.black, location=lblLoc, size=size.tiny)
plotshape(showKakuNow, title="KAKU", style=shape.labelup, text="確",
color=color.new(color.yellow, 0), textcolor=color.black, location=lblLoc, size=size.small)
// =========================
// ★稼働確認:最終足に必ず出すステータスラベル
// =========================
var label status = na
if showStatusLbl and barstate.islast
label.delete(status)
statusTxt =
"MNO RUNNING " +
"MOU: " + (mou ? "YES" : "no") + " (pull=" + (mou_pullback ? "Y" : "n") + " / brk=" + (mou_breakout ? "Y" : "n") + ") " +
"KAKU: " + (kaku ? "YES" : "no") + " " +
"BaseTrend: " + (baseTrendOK ? "OK" : "NO") + " " +
"MACD(mou): " + (macdMouOK ? "OK" : "NO") + " / MACD(zeroGC): " + (macdGCAboveZero ? "OK" : "NO") + " " +
"Vol: " + (na(volRatio) ? "na" : str.tostring(volRatio, format.mintick)) + " " +
"Pull%: " + (na(pullbackPct) ? "na" : str.tostring(pullbackPct, format.mintick))
status := label.new(bar_index, high, statusTxt, style=label.style_label_left,
textcolor=color.white, color=color.new(color.black, 0))
// =========================
// Alerts
// =========================
alertcondition(mou, title="MNO_MOU", message="MNO: MOU triggered")
alertcondition(mou_breakout, title="MNO_MOU_BREAKOUT", message="MNO: MOU Breakout triggered")
alertcondition(mou_pullback, title="MNO_MOU_PULLBACK", message="MNO: MOU Pullback triggered")
alertcondition(kaku, title="MNO_KAKU", message="MNO: KAKU triggered")
// =========================
// Debug table (optional)
// =========================
var table t = table.new(position.top_right, 2, 14, border_width=1, border_color=color.new(color.white, 60))
fRow(_name, _cond, _r) =>
bg = _cond ? color.new(color.lime, 70) : color.new(color.red, 80)
tx = _cond ? "OK" : "NO"
table.cell(t, 0, _r, _name, text_color=color.white, bgcolor=color.new(color.black, 0))
table.cell(t, 1, _r, tx, text_color=color.white, bgcolor=bg)
if showDebugTbl and barstate.islast
table.cell(t, 0, 0, "MNO Debug", text_color=color.white, bgcolor=color.new(color.black, 0))
table.cell(t, 1, 0, "", text_color=color.white, bgcolor=color.new(color.black, 0))
fRow("BaseTrend", baseTrendOK, 1)
fRow("MOU Pullback", mou_pullback, 2)
fRow("MOU Breakout", mou_breakout, 3)
fRow("Break confirm", breakConfirm, 4)
fRow("Break big body", bigBodyOK, 5)
fRow("Break close high", closeNearHighOK, 6)
fRow("Break vol strong", volumeStrongOK, 7)
fRow("Break MACD", macdBreakOK, 8)
fRow("KAKU all8", all8_strict, 9)
fRow("KAKU final3", final3, 10)
fRow("MOU any", mou, 11)
fRow("KAKU", kaku, 12)

VOLUME with DOUBLE MAA volume chart with dual moving averages. If you're looking for a volume chart with dual moving averages, this script is for you. By averaging the volume over two periods, you can discover more subtle relationships between price and volume.

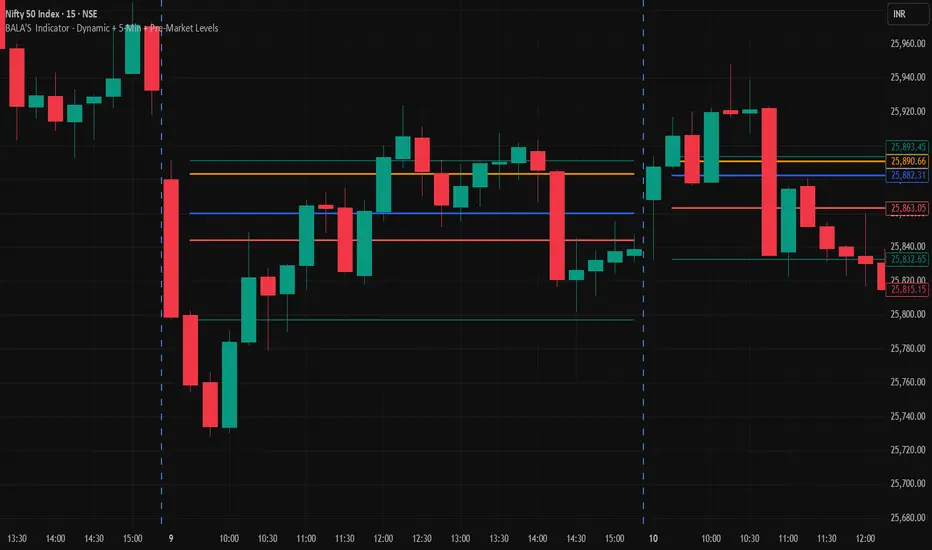
BALA'S Indicator - Dynamic + 5-Min + Pre-Market LevelsINTRADAY Strategy on Nifty with 15min Candle Setup.
takeshi_2Step_Screener_MOU_KAKU_FIXED3//@version=5
indicator("MNO_2Step_Screener_MOU_KAKU_FIXED3", overlay=true, max_labels_count=500)
// =========================
// Inputs
// =========================
emaSLen = input.int(5, "EMA Short (5)")
emaMLen = input.int(13, "EMA Mid (13)")
emaLLen = input.int(26, "EMA Long (26)")
macdFast = input.int(12, "MACD Fast")
macdSlow = input.int(26, "MACD Slow")
macdSignal = input.int(9, "MACD Signal")
macdZeroTh = input.float(0.2, "MOU: MACD near-zero threshold", step=0.05)
volLookback = input.int(5, "Volume MA days", minval=1)
volMinRatio = input.float(1.3, "MOU: Volume ratio min", step=0.1)
volStrong = input.float(1.5, "Strong volume ratio (Breakout/KAKU)", step=0.1)
volMaxRatio = input.float(3.0, "Volume ratio max (filter)", step=0.1)
wickBodyMult = input.float(2.0, "Pinbar: lowerWick >= body*x", step=0.1)
pivotLen = input.int(20, "Resistance lookback", minval=5)
pullMinPct = input.float(5.0, "Pullback min (%)", step=0.1)
pullMaxPct = input.float(15.0, "Pullback max (%)", step=0.1)
breakLookbackBars = input.int(5, "Pullback route: valid bars after break", minval=1)
// --- Breakout route (押し目なし初動ブレイク) ---
useBreakoutRoute = input.bool(true, "Enable MOU Breakout Route (no pullback)")
breakConfirmPct = input.float(0.3, "Break confirm: close > R*(1+%)", step=0.1)
bigBodyLookback = input.int(20, "Break candle body MA length", minval=5)
bigBodyMult = input.float(1.2, "Break candle: body >= MA*mult", step=0.1)
requireCloseNearHigh = input.bool(true, "Break candle: close near high")
closeNearHighPct = input.float(25.0, "Close near high threshold (% of range)", step=1.0)
allowMACDAboveZeroInstead = input.bool(true, "Breakout route: allow MACD GC above zero instead")
// 表示
showEMA = input.bool(true, "Plot EMAs")
showMou = input.bool(true, "Show MOU label")
showKaku = input.bool(true, "Show KAKU label")
showDebugTbl = input.bool(false, "Show debug table (last bar)")
locChoice = input.string("Below Bar", "Label location", options= )
lblLoc = locChoice == "Below Bar" ? location.belowbar : location.abovebar
// =========================
// EMA
// =========================
emaS = ta.ema(close, emaSLen)
emaM = ta.ema(close, emaMLen)
emaL = ta.ema(close, emaLLen)
// plot は if の中に入れない(naで制御)
plot(showEMA ? emaS : na, color=color.new(color.yellow, 0), title="EMA 5")
plot(showEMA ? emaM : na, color=color.new(color.blue, 0), title="EMA 13")
plot(showEMA ? emaL : na, color=color.new(color.orange, 0), title="EMA 26")
emaUpS = emaS > emaS
emaUpM = emaM > emaM
emaUpL = emaL > emaL
goldenOrder = emaS > emaM and emaM > emaL
above26_2days = close > emaL and close > emaL
// 勝率維持の土台(緩めない)
baseTrendOK = (emaUpS and emaUpM and emaUpL) and goldenOrder and above26_2days
// =========================
// MACD
// =========================
= ta.macd(close, macdFast, macdSlow, macdSignal)
macdGC = ta.crossover(macdLine, macdSig)
macdUp = macdLine > macdLine
macdNearZero = math.abs(macdLine) <= macdZeroTh
macdGCAboveZero = macdGC and macdLine > 0 and macdSig > 0
macdMouOK = macdGC and macdNearZero and macdUp
macdBreakOK = allowMACDAboveZeroInstead ? (macdMouOK or macdGCAboveZero) : macdMouOK
// =========================
// Volume
// =========================
volMA = ta.sma(volume, volLookback)
volRatio = volMA > 0 ? (volume / volMA) : na
volumeMouOK = volRatio >= volMinRatio and volRatio <= volMaxRatio
volumeStrongOK = volRatio >= volStrong and volRatio <= volMaxRatio
// =========================
// Candle patterns
// =========================
body = math.abs(close - open)
upperWick = high - math.max(open, close)
lowerWick = math.min(open, close) - low
pinbar = (lowerWick >= wickBodyMult * body) and (lowerWick > upperWick) and (close >= open)
bullEngulf =
close > open and close < open and
close >= open and open <= close
bigBull =
close > open and
open < emaM and close > emaS and
(body > ta.sma(body, 20))
candleOK = pinbar or bullEngulf or bigBull
// =========================
// Resistance / Pullback route
// =========================
res = ta.highest(high, pivotLen)
pullbackPct = res > 0 ? (res - close) / res * 100.0 : na
pullbackOK = pullbackPct >= pullMinPct and pullbackPct <= pullMaxPct
brokeRes = ta.crossover(close, res )
barsSinceBreak = ta.barssince(brokeRes)
afterBreakZone = (barsSinceBreak >= 0) and (barsSinceBreak <= breakLookbackBars)
pullbackRouteOK = afterBreakZone and pullbackOK
// =========================
// Breakout route (押し目なし初動ブレイク)
// =========================
breakConfirm = close > res * (1.0 + breakConfirmPct / 100.0)
bullBreak = close > open
bodyMA = ta.sma(body, bigBodyLookback)
bigBodyOK = bodyMA > 0 ? (body >= bodyMA * bigBodyMult) : false
rng = math.max(high - low, syminfo.mintick)
closeNearHighOK = not requireCloseNearHigh ? true : ((high - close) / rng * 100.0 <= closeNearHighPct)
mou_breakout =
useBreakoutRoute and
baseTrendOK and
breakConfirm and
bullBreak and
bigBodyOK and
closeNearHighOK and
volumeStrongOK and
macdBreakOK
mou_pullback = baseTrendOK and volumeMouOK and candleOK and macdMouOK and pullbackRouteOK
mou = mou_pullback or mou_breakout
// =========================
// KAKU (Strict): 8条件 + 最終三点
// =========================
cond1 = emaUpS and emaUpM and emaUpL
cond2 = goldenOrder
cond3 = above26_2days
cond4 = macdGCAboveZero
cond5 = volumeMouOK
cond6 = candleOK
cond7 = pullbackOK
cond8 = pullbackRouteOK
all8_strict = cond1 and cond2 and cond3 and cond4 and cond5 and cond6 and cond7 and cond8
final3 = pinbar and macdGCAboveZero and volumeStrongOK
kaku = all8_strict and final3
// =========================
// Display (統一ラベル)
// =========================
showKakuNow = showKaku and kaku
showMouPull = showMou and mou_pullback and not kaku
showMouBrk = showMou and mou_breakout and not kaku
plotshape(showMouPull, title="MOU_PULLBACK", style=shape.labelup, text="猛",
color=color.new(color.lime, 0), textcolor=color.black, location=lblLoc, size=size.tiny)
plotshape(showMouBrk, title="MOU_BREAKOUT", style=shape.labelup, text="猛B",
color=color.new(color.lime, 0), textcolor=color.black, location=lblLoc, size=size.tiny)
plotshape(showKakuNow, title="KAKU", style=shape.labelup, text="確",
color=color.new(color.yellow, 0), textcolor=color.black, location=lblLoc, size=size.small)
// =========================
// Alerts
// =========================
alertcondition(mou, title="MNO_MOU", message="MNO: MOU triggered")
alertcondition(mou_breakout, title="MNO_MOU_BREAKOUT", message="MNO: MOU Breakout triggered")
alertcondition(mou_pullback, title="MNO_MOU_PULLBACK", message="MNO: MOU Pullback triggered")
alertcondition(kaku, title="MNO_KAKU", message="MNO: KAKU triggered")
// =========================
// Debug table (optional)
// =========================
var table t = table.new(position.top_right, 2, 14, border_width=1, border_color=color.new(color.white, 60))
fRow(_name, _cond, _r) =>
bg = _cond ? color.new(color.lime, 70) : color.new(color.red, 80)
tx = _cond ? "OK" : "NO"
table.cell(t, 0, _r, _name, text_color=color.white, bgcolor=color.new(color.black, 0))
table.cell(t, 1, _r, tx, text_color=color.white, bgcolor=bg)
if showDebugTbl and barstate.islast
// ❗ colspanは使えないので2セルでヘッダーを作る
table.cell(t, 0, 0, "MNO Debug", text_color=color.white, bgcolor=color.new(color.black, 0))
table.cell(t, 1, 0, "", text_color=color.white, bgcolor=color.new(color.black, 0))
fRow("BaseTrend", baseTrendOK, 1)
fRow("MOU Pullback", mou_pullback, 2)
fRow("MOU Breakout", mou_breakout, 3)
fRow("Break confirm", breakConfirm, 4)
fRow("Break big body", bigBodyOK, 5)
fRow("Break close high", closeNearHighOK, 6)
fRow("Break vol strong", volumeStrongOK, 7)
fRow("Break MACD", macdBreakOK, 8)
fRow("KAKU all8", all8_strict, 9)
fRow("KAKU final3", final3, 10)
fRow("MOU any", mou, 11)
fRow("KAKU", kaku, 12)

indicator("MouNoOkite_InitialMove_Screener", overlay=true)//@version=5
indicator("猛の掟・初動スクリーナー(5EMA×MACD×出来高×ローソク)", overlay=true, max_labels_count=500)
// =========================
// Inputs
// =========================
emaSLen = input.int(5, "EMA Short (5)")
emaMLen = input.int(13, "EMA Mid (13)")
emaLLen = input.int(26, "EMA Long (26)")
macdFast = input.int(12, "MACD Fast")
macdSlow = input.int(26, "MACD Slow")
macdSignal = input.int(9, "MACD Signal")
volLookback = input.int(5, "出来高平均(日数)", minval=1)
volMinRatio = input.float(1.3, "出来高倍率(初動点灯)", step=0.1)
volStrong = input.float(1.5, "出来高倍率(本物初動)", step=0.1)
volMaxRatio = input.float(2.0, "出来高倍率(上限目安)", step=0.1)
wickBodyMult = input.float(2.0, "ピンバー判定: 下ヒゲ >= (実体×倍率)", step=0.1)
pivotLen = input.int(20, "直近高値/レジスタンス判定のLookback", minval=5)
pullMinPct = input.float(5.0, "押し目最小(%)", step=0.1)
pullMaxPct = input.float(15.0, "押し目最大(%)", step=0.1)
showDebug = input.bool(true, "デバッグ表示(条件チェック)")
// =========================
// EMA
// =========================
emaS = ta.ema(close, emaSLen)
emaM = ta.ema(close, emaMLen)
emaL = ta.ema(close, emaLLen)
plot(emaS, color=color.new(color.yellow, 0), title="EMA 5")
plot(emaM, color=color.new(color.blue, 0), title="EMA 13")
plot(emaL, color=color.new(color.orange, 0), title="EMA 26")
emaUpS = emaS > emaS
emaUpM = emaM > emaM
emaUpL = emaL > emaL
// 26EMA上に2日定着
above26_2days = close > emaL and close > emaL
// 黄金隊列
goldenOrder = emaS > emaM and emaM > emaL
// =========================
// MACD
// =========================
= ta.macd(close, macdFast, macdSlow, macdSignal)
// ヒストグラム縮小(マイナス圏で上向きの準備)も見たい場合の例
histShrinking = math.abs(macdHist) < math.abs(macdHist )
histUp = macdHist > macdHist
// ゼロライン上でGC(最終シグナル)
macdGCAboveZero = ta.crossover(macdLine, macdSig) and macdLine > 0 and macdSig > 0
// 参考:ゼロ直下で上昇方向(勢い準備)
macdRisingNearZero = (macdLine < 0) and (macdLine > macdLine ) and (math.abs(macdLine) <= math.abs(0.5))
// =========================
// Volume
// =========================
volMA = ta.sma(volume, volLookback)
volRatio = volMA > 0 ? (volume / volMA) : na
volumeOK = volRatio >= volMinRatio and volRatio <= volMaxRatio
volumeStrongOK = volRatio >= volStrong
// =========================
// Candle patterns
// =========================
body = math.abs(close - open)
upperWick = high - math.max(open, close)
lowerWick = math.min(open, close) - low
// 長い下ヒゲ(ピンバー系): 実体が小さく、下ヒゲが優位
pinbar = (lowerWick >= wickBodyMult * body) and (lowerWick > upperWick) and (close >= open)
// 陽線包み足(前日陰線を包む)
bullEngulf =
close > open and close < open and
close >= open and open <= close
// 5EMA・13EMA を貫く大陽線(勢い)
bigBull =
close > open and
open < emaM and close > emaS and
(body > ta.sma(body, 20)) // “相対的に大きい”目安
candleOK = pinbar or bullEngulf or bigBull
// =========================
// 押し目 (-5%〜-15%) & レジブレ後
// =========================
recentHigh = ta.highest(high, pivotLen)
pullbackPct = recentHigh > 0 ? (recentHigh - close) / recentHigh * 100.0 : na
pullbackOK = pullbackPct >= pullMinPct and pullbackPct <= pullMaxPct
// “レジスタンスブレイク”簡易定義:直近pivotLen高値を一度上抜いている
// → その後に押し目位置にいる(現在が押し目)
brokeResistance = ta.crossover(close, recentHigh ) or (close > recentHigh )
afterBreakPull = brokeResistance or brokeResistance or brokeResistance or brokeResistance or brokeResistance
breakThenPullOK = afterBreakPull and pullbackOK
// =========================
// 最終三点シグナル(ヒゲ × 出来高 × MACD)
// =========================
final3 = pinbar and macdGCAboveZero and volumeStrongOK
// =========================
// 猛の掟 8条件チェック(1つでも欠けたら「見送り」)
// =========================
// 1) 5EMA↑ 13EMA↑ 26EMA↑
cond1 = emaUpS and emaUpM and emaUpL
// 2) 5>13>26 黄金隊列
cond2 = goldenOrder
// 3) ローソク足が26EMA上に2日定着
cond3 = above26_2days
// 4) MACD(12,26,9) ゼロライン上でGC
cond4 = macdGCAboveZero
// 5) 出来高が直近5日平均の1.3〜2.0倍
cond5 = volumeOK
// 6) ピンバー or 包み足 or 大陽線
cond6 = candleOK
// 7) 押し目 -5〜15%
cond7 = pullbackOK
// 8) レジスタンスブレイク後の押し目
cond8 = breakThenPullOK
all8 = cond1 and cond2 and cond3 and cond4 and cond5 and cond6 and cond7 and cond8
// =========================
// 判定(2択のみ)
// =========================
isBuy = all8 and final3
decision = isBuy ? "買い" : "見送り"
// =========================
// 表示
// =========================
plotshape(isBuy, title="BUY", style=shape.labelup, text="買い", color=color.new(color.lime, 0), textcolor=color.black, location=location.belowbar, size=size.small)
plotshape((not isBuy) and all8, title="ALL8_OK_but_noFinal3", style=shape.labelup, text="8条件OK (最終3未)", color=color.new(color.yellow, 0), textcolor=color.black, location=location.belowbar, size=size.tiny)
// デバッグ(8項目チェック結果)
if showDebug and barstate.islast
var label dbg = na
label.delete(dbg)
txt =
"【8項目チェック】 " +
"1 EMA全上向き: " + (cond1 ? "達成" : "未達") + " " +
"2 黄金隊列: " + (cond2 ? "達成" : "未達") + " " +
"3 26EMA上2日: " + (cond3 ? "達成" : "未達") + " " +
"4 MACDゼロ上GC: " + (cond4 ? "達成" : "未達") + " " +
"5 出来高1.3-2.0: "+ (cond5 ? "達成" : "未達") + " " +
"6 ローソク条件: " + (cond6 ? "達成" : "未達") + " " +
"7 押し目5-15%: " + (cond7 ? "達成" : "未達") + " " +
"8 ブレイク後押し目: " + (cond8 ? "達成" : "未達") + " " +
"最終三点(ヒゲ×出来高×MACD): " + (final3 ? "成立" : "未成立") + " " +
"判定: " + decision
dbg := label.new(bar_index, high, txt, style=label.style_label_left, textcolor=color.white, color=color.new(color.black, 0))
// アラート
alertcondition(isBuy, title="猛の掟 BUY", message="猛の掟: 買いシグナル(8条件+最終三点)")

ORB + FVG + PDH/PDL ORB + FVG + PDH/PDL is an all-in-one day-trading overlay that plots:
Opening Range (ORB) high/low with optional box and extension
Fair Value Gaps (FVG) with optional “unmitigated” levels + mitigation lines
Previous Day High/Low history (PDH/PDL) drawn as one-day segments (yesterday’s levels plotted across today’s session only)
Includes presets (ORB only / FVG only / Both) and optional alerts for ORB touches, ORB break + retest, FVG entry, and PDH/PDL touches.


takeshi GPT//@version=5
indicator("猛の掟・初動スクリーナーGPT", overlay = true, timeframe = "", timeframe_gaps = true)
// ======================================================
// ■ 1. パラメータ設定
// ======================================================
// EMA長
emaFastLen = input.int(5, "短期EMA (5)", minval = 1)
emaMidLen = input.int(13, "中期EMA (13)", minval = 1)
emaSlowLen = input.int(26, "長期EMA (26)", minval = 1)
// 出来高
volMaLen = input.int(5, "出来高平均期間", minval = 1)
volMultInitial = input.float(1.3, "出来高 初動ライン (×)", minval = 1.0, step = 0.1)
volMultStrong = input.float(1.5, "出来高 本物ライン (×)", minval = 1.0, step = 0.1)
// 押し目・レジスタンス
pullbackLookback = input.int(20, "直近高値の探索期間", minval = 5)
pullbackMinPct = input.float(5.0, "押し目下限 (%)", minval = 0.0, step = 0.1)
pullbackMaxPct = input.float(15.0, "押し目上限 (%)", minval = 0.0, step = 0.1)
// ピンバー判定パラメータ
pinbarWickRatio = input.float(2.0, "ピンバー下ヒゲ/実体 比率", minval = 1.0, step = 0.5)
pinbarMaxUpperPct = input.float(25.0, "ピンバー上ヒゲ比率上限 (%)", minval = 0.0, step = 1.0)
// 大陽線判定
bigBodyPct = input.float(2.0, "大陽線の最低値幅 (%)", minval = 0.1, step = 0.1)
// ======================================================
// ■ 2. 基本テクニカル計算
// ======================================================
emaFast = ta.ema(close, emaFastLen)
emaMid = ta.ema(close, emaMidLen)
emaSlow = ta.ema(close, emaSlowLen)
// MACD
= ta.macd(close, 12, 26, 9)
// 出来高
volMa = ta.sma(volume, volMaLen)
// 直近高値(押し目判定用)
recentHigh = ta.highest(high, pullbackLookback)
drawdownPct = (recentHigh > 0) ? (recentHigh - close) / recentHigh * 100.0 : na
// ======================================================
// ■ 3. A:トレンド(初動)条件
// ======================================================
// 1. 5EMA↑ 13EMA↑ 26EMA↑
emaUpFast = emaFast > emaFast
emaUpMid = emaMid > emaMid
emaUpSlow = emaSlow > emaSlow
condTrendUp = emaUpFast and emaUpMid and emaUpSlow
// 2. 黄金並び 5EMA > 13EMA > 26EMA
condGolden = emaFast > emaMid and emaMid > emaSlow
// 3. ローソク足が 26EMA 上に2日定着
condAboveSlow2 = close > emaSlow and close > emaSlow
// ======================================================
// ■ 4. B:モメンタム(MACD)条件
// ======================================================
// ヒストグラム縮小+上向き
histShrinkingUp = (math.abs(histLine) < math.abs(histLine )) and (histLine > histLine )
// ゼロライン直下〜直上での上向き
nearZeroRange = 0.5 // ゼロライン±0.5
macdNearZero = math.abs(macdLine) <= nearZeroRange
// MACDが上向き
macdTurningUp = macdLine > macdLine
// MACDゼロライン上でゴールデンクロス
macdZeroCrossUp = macdLine > signalLine and macdLine <= signalLine and macdLine > 0
// B条件:すべて
condMACD = histShrinkingUp and macdNearZero and macdTurningUp and macdZeroCrossUp
// ======================================================
// ■ 5. C:需給(出来高)条件
// ======================================================
condVolInitial = volume > volMa * volMultInitial // 1.3倍〜 初動点灯
condVolStrong = volume > volMa * volMultStrong // 1.5倍〜 本物初動
condVolume = condVolInitial // 「8掟」では1.3倍以上で合格
// ======================================================
// ■ 6. D:ローソク足パターン
// ======================================================
body = math.abs(close - open)
upperWick = high - math.max(close, open)
lowerWick = math.min(close, open) - low
rangeAll = high - low
// 安全対策:0除算回避
rangeAllSafe = rangeAll == 0.0 ? 0.0000001 : rangeAll
bodyPct = body / close * 100.0
// ● 長い下ヒゲ(ピンバー)
lowerToBodyRatio = (body > 0) ? lowerWick / body : 0.0
upperPct = upperWick / rangeAllSafe * 100.0
isBullPinbar = lowerToBodyRatio >= pinbarWickRatio and upperPct <= pinbarMaxUpperPct and close > open
// ● 陽線包み足(bullish engulfing)
prevBearish = close < open
isEngulfingBull = close > open and prevBearish and close >= open and open <= close
// ● 5EMA・13EMAを貫く大陽線
crossFast = open < emaFast and close > emaFast
crossMid = open < emaMid and close > emaMid
isBigBody = bodyPct >= bigBodyPct
isBigBull = close > open and (crossFast or crossMid) and isBigBody
// D条件:どれか1つでOK
condCandle = isBullPinbar or isEngulfingBull or isBigBull
// ======================================================
// ■ 7. E:価格帯(押し目位置 & レジスタンスブレイク)
// ======================================================
// 7. 押し目 -5〜15%
condPullback = drawdownPct >= pullbackMinPct and drawdownPct <= pullbackMaxPct
// 8. レジスタンス突破 → 押し目 → 再上昇
// 直近 pullbackLookback 本の高値をレジスタンスとみなす(現在足除く)
resistance = ta.highest(close , pullbackLookback)
// レジスタンスブレイクが起きたバーからの経過本数
brokeAbove = ta.barssince(close > resistance)
// ブレイク後に一度レジ上まで戻したか
pulledBack = brokeAbove != na ? ta.lowest(low, brokeAbove + 1) < resistance : false
// 現在は再上昇方向か
reRising = close > close
condBreakPull = (brokeAbove != na) and (brokeAbove <= pullbackLookback) and pulledBack and reRising
// ======================================================
// ■ 8. 最終 8条件 & 三点シグナル
// ======================================================
// 8つの掟
condA = condTrendUp and condGolden and condAboveSlow2
condB = condMACD
condC = condVolume
condD = condCandle
condE = condPullback and condBreakPull
all_conditions = condA and condB and condC and condD and condE
// 🟩 最終三点シグナル
// 1. 長い下ヒゲ 2. MACDゼロライン上GC 3. 出来高1.5倍以上
threePoint = isBullPinbar and macdZeroCrossUp and condVolStrong
// 「買い確定」= 8条件すべて + 三点シグナル
buy_confirmed = all_conditions and threePoint
// ======================================================
// ■ 9. チャート表示 & スクリーナー用出力
// ======================================================
// EMA表示
plot(emaFast, color = color.orange, title = "EMA 5")
plot(emaMid, color = color.new(color.blue, 10), title = "EMA 13")
plot(emaSlow, color = color.new(color.green, 20), title = "EMA 26")
// 初動シグナル
plotshape(
all_conditions and not buy_confirmed,
title = "初動シグナル(掟8条件クリア)",
style = shape.labelup,
color = color.new(color.yellow, 0),
text = "初動",
location = location.belowbar,
size = size.small)
// 三点フルシグナル(買い確定)
plotshape(
buy_confirmed,
title = "三点フルシグナル(買い確定)",
style = shape.labelup,
color = color.new(color.lime, 0),
text = "買い",
location = location.belowbar,
size = size.large)
// スクリーナー用 series 出力(非表示)
plot(all_conditions ? 1 : 0, title = "all_conditions (8掟クリア)", display = display.none)
plot(buy_confirmed ? 1 : 0, title = "buy_confirmed (三点+8掟)", display = display.none)

Momentum Candle V3 by Sekolah TradingMomentum Candle v3 by Sekolah Trading
Description:
Momentum Candle v3 is a technical indicator designed to identify market momentum signals based on price movement within a single candle. The indicator measures the size of the candle's body and wick to determine if the market is showing strong bullish or bearish momentum.
Key Features:
Candle Size: Measures price movement within a single candle to assess market momentum.
Short Wick: Focuses on wick length, with short wicks indicating that the closing price is more significant than the opening price.
Bullish/Bearish Momentum: Provides bullish signals when the closing price is higher than the open, and bearish signals when the closing price is lower than the open.
Customizable Minimum Body: Users can adjust the minimum body size for XAUUSD and USDJPY pairs according to their trading preferences.
Timeframe: Works on M5 and M15 timeframes for XAUUSD and USDJPY currency pairs.
How to Use:
Bullish Signal: The indicator signals bullish momentum when the candle body is sufficiently large and the wick is short, with the closing price higher than the open.
Bearish Signal: The indicator signals bearish momentum when the candle body is sufficiently large and the wick is short, with the closing price lower than the open.
Pip Parameters: Adjust the pip values for XAUUSD and USDJPY according to market conditions or your trading preferences.
Note: This indicator is a tool for technical analysis and does not guarantee specific trading results. It is recommended to use it alongside other strategies and analyses for better accuracy.
Realistic Backtest Results:
To ensure transparency and honesty in the backtest, here are some key factors to consider:
Position Size: The backtest uses a realistic position size of about 5-10% of the account equity per trade.
Commission & Slippage: A commission of 0.1% per trade and slippage of 1 pip were used in the backtest simulation to reflect real market conditions.
Number of Trades: The backtest sample includes more than 100 trades for a representative result.
Example of Backtest Results:
Profitability: The backtest results on XAUUSD and USDJPY show consistent performance with this strategy on the M5 and M15 timeframes.
Commission and Slippage: Adjusting for commission and slippage showed better accuracy under more realistic market scenarios.
How to Use the Indicator:
Signals from this indicator can be used to confirm market momentum in trending conditions. However, it is highly recommended to combine this indicator with other technical analysis tools to minimize the risk of false signals.
Important Notes:
Honesty & Transparency: This indicator is designed to provide signals based on technical analysis and does not guarantee specific trading results.
No Over-Claims: The backtest results displayed represent realistic scenarios and are not intended to promise certain profits.
Original Content: The code for this indicator is original and does not violate any copyrights.
Tagging:
Smart Tags: Momentum, Candle, XAUUSD, USDJPY, Bullish, Bearish, M5, M15, Technical Indicator, Market Momentum.

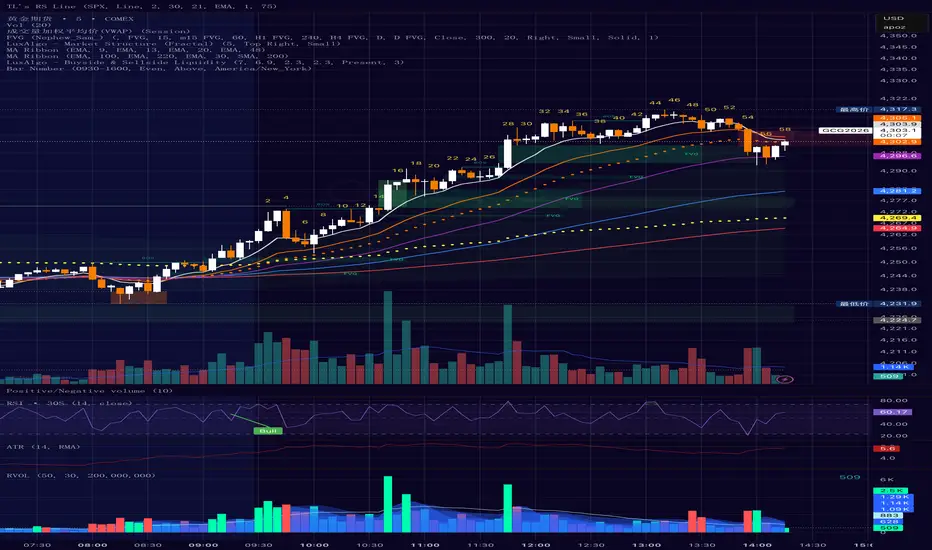
Smart Money Alpha Signals (Performance Dashboard) Smart Money Alpha Signals: Identifying Market Leaders & Generating Alpha
GMP Alpha Signals (Global Market Performance Alpha) is a specialized analysis tool designed not merely to find stocks that are rising, but to identify "Alpha" assets—Market Leaders that defend their price or rise even under adverse conditions where the market index falls or consolidates.
This indicator visualizes the concept of Comparative Relative Strength (RS) and Smart Money accumulation patterns, helping traders capture profit opportunities even during bearish market phases.
Key Objectives (Purpose)
Alpha Capture: Identifying assets generating 'excess returns' that outperform the market Beta.
Smart Money Tracking: Detecting traces of 'institutional buying' and 'accumulation' that defend prices during index plunges.
Decoupling Identification: Spotting assets moving on independent catalysts or momentum, regardless of the broader market direction.
Stop Hunt Filtering: Distinguishing 'fake drops' where price dips temporarily, but Relative Strength remains intact.
Dashboard Guide
Interpretation of the information panel (Table) displayed on the chart.
Rel. Performance: Shows the excess return compared to the index over the set period. (Positive/Green = Stronger than the market).
Decoupling Strength: The correlation coefficient with the index. Lower values (0 or negative) indicate movement independent of market risk.
Bullish: The count/rate of rising or limiting losses when the index drops sharply (e.g., < -0.5%). (Gold = Market Crash Leader).
Defended: The count/rate of holding support levels when the index shows mild weakness (e.g., < -0.05%). (Gold = Strong Accumulation).
Bench. Defense: The defense rate of the comparison benchmark (e.g., TSLA, ETH). Your target asset must be higher to be considered the sector leader.
Input Options & Settings Guide
You can optimize settings according to your trading style and asset class (Stocks/Crypto).
(1) Main Settings
Major Index: The baseline market index for comparison.
(US Stocks: NASDAQ:NDX or TVC:SPX / Crypto: BINANCE:BTCUSDT)
Benchmark Symbol: A competitor within the sector.
(e.g., Set NVDA when analyzing Semiconductor stocks).
Correlation Lookback: The lookback period for judging decoupling. (Default: 30)
Performance Lookback: The number of bars to calculate cumulative returns and defense rates. (Default: 60)
(2) Dashboard Thresholds
These settings define the criteria for what qualifies as "Defended" or "Bullish".
Performance (Max %): Used to find assets that haven't pumped yet. Signals trigger only when Alpha is below this value.
Defended Logic:
Index Drop Condition: The index must drop by at least this amount to start checking. (e.g., -0.05%)
Asset Buffer: How much the asset must outperform the index drop.
(Example: If Index drops -1.0% and Buffer is 0.2%, the asset must be at least -0.8% to count as 'Defended').
Bullish Logic: Measures resilience during steeper market dumps (e.g., -0.5% drop) compared to the Defended Logic.
Volume Settings: Decides whether to count Defended/Bullish instances only when accompanied by volume above the SMA.
(3) Signal Logic Settings (Crucial)
Customize conditions to trigger alerts. The choice between AND / OR is crucial.
AND: Condition must be met SIMULTANEOUSLY with other active conditions (Conservative/High Certainty).
OR: Condition triggers the signal INDEPENDENTLY (Aggressive/Opportunity Capture).
Performance: Is the relative performance within the threshold? (Basic Filter).
Decoupling: Has the correlation dropped? (Start of independent move).
Bullish Rate: Is the Bullish rate high during market dumps?
Defended Rate (High): (Recommended) Is there continuous price defense occurring? (Accumulation detection).
Defended Rate (Low): (Warning) Has the defense rate broken down? (For Stop Loss).
Defended > Benchmark: Is it stronger than the Benchmark (2nd tier)?
Volume Spike: Has volume surged compared to the average? (Institutional involvement).
RSI Oversold: Is it in oversold territory? (Counter-trend trading).
Decoupling Move: Does the current bar show the "Index Down / Asset Up" pattern?
Min USD Volume: Transaction value filter (To exclude low liquidity assets).

Trend detection zero lag Trend Detection Zero-Lag (v6)
Trend Detection Zero-Lag is a high-performance trend identification indicator designed for intraday traders, scalpers, and swing traders who require fast trend recognition with minimal lag. It combines a zero-lag Hull Moving Average, slope analysis, swing structure logic, and adaptive volatility sensitivity to deliver early yet stable trend signals.
This indicator is optimized for real-time decision-making, particularly in fast markets where traditional moving averages react too slowly.
Core Features
🔹 Zero-Lag Trend Engine
Uses a Zero-Lag Hull Moving Average (HMA) to reduce lag by approximately 40–60% versus standard moving averages.
Provides earlier trend shifts while maintaining smoothness.
🔹 Multi-Factor Trend Detection
Trend direction is determined using a hybrid engine:
HMA slope (momentum direction)
Rising / falling confirmation
Swing structure detection (HH/HL vs LH/LL)
ATR-adjusted dynamic sensitivity
This approach allows fast flips when conditions change, without excessive noise.
Adaptive Volatility Sensitivity
Sensitivity dynamically adjusts based on ATR relative to price
In high volatility: faster reaction
In low volatility: smoother, more stable trend state
This ensures the indicator adapts across:
Trend days
Range days
Volatility expansion or contraction
Trend Duration Intelligence
The indicator tracks historical trend durations and maintains a rolling memory of recent bullish and bearish phases.
From this, it calculates:
Current trend duration
Average historical duration for the active trend direction
This helps traders gauge:
Whether a trend is early, mature, or extended
Probability of continuation vs exhaustion
Strength Scoring
A normalized Trend Strength Score (0–100) is calculated using:
Zero-lag slope magnitude
ATR normalization
This provides a quick read on:
Weak / choppy trends
Healthy trend continuation
Overextended momentum
Visual Design
Color-coded Zero-Lag HMA
Bullish trend → user-defined bullish color
Bearish trend → user-defined bearish color
Designed for dark mode / neon-style charts
Clean overlay with no clutter
Trend Detection Zero-Lag is built for traders who need:
Faster trend recognition
Adaptive behavior across market regimes
Structural confirmation beyond simple moving averages
Clear, actionable visual signals

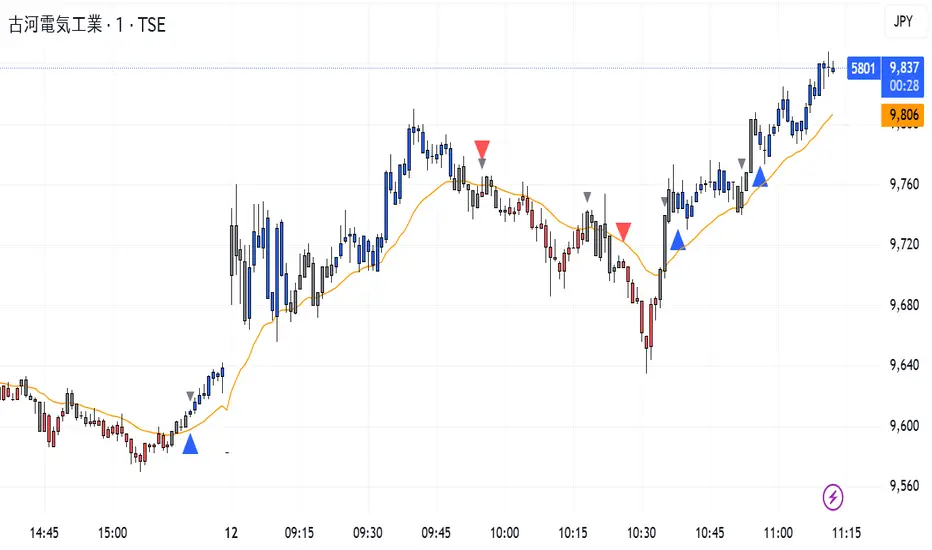
CISD Trend Candle + MACD SignalThis custom TradingView indicator combines trend-based candle coloring with MACD reversal detection to generate clear entry and exit signals:
🔷 Blue triangle (Buy): Appears when the candles confirm an uptrend (e.g., 5 consecutive closes above 21 EMA) and no long position is currently held.
🔴 Red triangle (Sell): Appears when the candles confirm a downtrend (e.g., 5 consecutive closes below 21 EMA) and no short position is currently held.
⚪ Gray triangle (Exit):
If in a long position, it shows when the candle turns neutral (gray) and the MACD crosses down (bearish signal), or the trend turns red.
If in a short position, it shows when the candle turns neutral and the MACD crosses up (bullish signal), or the trend turns blue.
🟠 Orange line: 21-period EMA used for trend validation.
This logic prevents premature entries and provides structured exit points, aiming to avoid false signals in choppy markets.
Ichimoku + VWAP + OBV + ATR Full System (NQ Daytrade)This script provides optimized scalping signals for BTC, designed mainly for the 15-minute timeframe.
Long/short entries are generated using VWAP band position and trend confirmation logic.
OBV momentum is used as a secondary filter to validate breakout or reversal conditions.
Exit signals are displayed when volatility compression or mean-reversion conditions occur.
Simple visual markers (triangles and circles) are included for easy decision-making.
롱/숏 삼각형 시그널
동그라미 청산 시그널
VWAP 밴드 기반 방향성
OBV 보조지표
이름 (Name)
BTC Scalping Signal – VWAP + OBV
짧은 설명 (Short Description)
VWAP 밴드와 OBV를 기반으로 방향성, 진입·청산 시그널을 제공하는 스캘핑 지표입니다.
긴 설명 (Long Description)
이 지표는 BTC 단기 스캘핑을 위해 설계된 것으로, 특히 15분봉 환경에 최적화되어 있습니다.
VWAP 밴드의 위치와 추세 판별 로직을 기반으로 롱·숏 진입 신호를 제공합니다.
OBV 모멘텀을 보조 필터로 사용하여 돌파 및 되돌림 가능성을 판단합니다.
시장 변동성이 축소되거나 평균회귀 신호가 감지될 때 청산 시그널을 표시합니다.
삼각형(진입), 원형(청산) 등 직관적 시각 요소를 통해 빠른 의사결정을 지원합니다.

True Gap Finder with Revisit DetectionTrue Gap Finder with Revisit Detection
This indicator is a powerful tool for intraday traders to identify and track price gaps. Unlike simple gap indicators, this script actively tracks the status of the gap, visualizing the void until it is filled (revisited) by price.
Key Features:
Active Gap Tracking: Finds gap-up and gap-down occurrences (where Low > Previous High or High < Previous Low) and actively tracks them.
Gap Zones (Clouds): Visually shades the empty "gap zone" (the void between the gap candles), making it instantly obvious where price needs to travel to fill the gap. The cloud disappears automatically once the gap is filled.
Dynamic Labels: automatically displays price labels at the origin of the gap, showing the specific price range (High-Low) that constitutes the gap. Labels are positioned intelligently to avoid cluttering current price action.
Alerts: Configurable alerts notify you the moment a gap is filled.
Customization: Full control over colors, clouds, labels, and alert settings to match your chart style.
How it works: The indicator tracks the most recent gap. If a new gap forms, it becomes the active focus. When price moves back to "close" or "fill" this gap area, the lines and clouds automatically stop plotting, giving you a clean chart that focuses only on open business.

Bar Number IndicatorBar Number Indicator
This Pine Script indicator is designed to help intraday traders by automatically numbering candlesticks within a user-defined trading session. This is particularly useful for strategies that rely on specific bar counts (e.g., tracking the 1st, 18th, or 81st bar of the day).
Key Features:
Session-Based Counting: Automatically resets the count at the start of each new session (default 09:30 - 16:00).
Timezone Flexibility: Includes a dropdown to select your specific trading timezone (e.g., America/New_York), ensuring accurate session start times regardless of your local time or the exchange's default setting.
Smart Display Modes: Choose to show "All" numbers, or filter for "Odd" / "Even" numbers to keep your chart clean.
Custom Positioning: Easily place the numbers Above or Below the candlesticks.
Minimalist Design: Numbers are displayed as floating text without distracting background bubbles.
Entry Scanner Conservative Option AKeeping it simple,
Trend,
RSI,
Stoch RSI,
MACD, checked.
Do not have entry where there is noise on selection, look for cluster of same entry signals.
If you can show enough discipline, you will be profitable.
CT

Quicksilver Institutional Trend [1H] The "God Candle" Catcher Most retail traders fail because they lack institutional tooling.
The Quicksilver Institutional Trend is designed to keep you in the trade during massive expansion moves and keep you out during the chop. It replaces "guessing" with a structured, math-based Trend Cloud.
THE LOGIC (Institutional Engine):
Visual Trend Cloud: A dynamic ribbon that identifies the dominant 1H market regime.
Momentum Filter (ADX): The bars change color based on Trend Strength.
Bright Green/Red: High Momentum (Institutional Volume). Stay in the trade.
Dark Green/Red: Low Momentum. Prepare to exit.
Liquidity Zones: Automatically draws Support & Resistance lines at recent institutional pivot points.
👨💻 NEED A CUSTOM BOT?
Stop trading manually. We can convert YOUR specific strategy into an automated algorithm.
Quicksilver Algo Systems specializes in building custom solutions for:
TradeLocker Studio (Python)
TradingView (Pine Script)
cTrader (C#)
MetaTrader 4/5 (MQL)
We don't just sell indicators; we engineer automated execution systems tailored to your exact risk parameters.
🚀 HOW TO HIRE US:
If you have a strategy you want automated, we are currently accepting new custom development projects.
Contact the Lead Developer directly:
📧 Email: quicksilveralgo@gmail.com
(Include "Custom Bot Request" in the subject line for priority review).
🔥 UNLOCK THE NEXT INDICATOR:
We are releasing our "Sniper Scalper" logic next week.
Hit the BOOST (Rocket) Button 🚀 above.
Click FOLLOW on our profile.
Comment "QAS" below if you want to be notified.
Disclaimer: Trading involves substantial risk. Educational purposes only.

ATR + True RangeOne indicator for ATR & TR its a common indictor which can be used as one
instead of 2 different its is trial mode only not to be used with out other references

Daily O/C Span (Real Values & SMA Comparison)This Pine Script indicator helps you visualize and track the "momentum" or "strength" of each trading day, and compares it to a recent average. It essentially measures the net movement of the price from when the market opens to when it closes.
What the Script Does
The script performs the following actions:
Calculates Daily Movement: For every single trading day, it calculates the difference between the closing price and the opening price (Close - Open).
Plots the "Span": These daily differences are plotted as vertical bars (a histogram) in a separate window below your main price chart.
-Green bars mean the stock closed higher than it opened (a strong day).
-Red bars mean the stock closed lower than it opened (a weak day).
Calculates the Average: It calculates the Simple Moving Average (SMA) of these daily spans over an adjustable period (default is 30 days).
Plots the Average Line: A blue line is plotted over the green/red bars, showing the typical magnitude of daily movement.
Displays Comparison: A table in the top-right corner provides a quick, real-time numerical comparison of today's span versus the 30-day average span.
How It Can Improve Trading
This indicator helps you understand the character and conviction of price action, offering several trading insights:
Gauging Momentum: It clarifies whether the stock's moves are generally strong and sustained within a day (large spans) or hesitant (small spans).
Identifying Trends: During an uptrend, you might expect the average span line to be consistently positive (above zero), and vice versa for a downtrend. A positive average span indicates buyers are consistently closing the day stronger than where they started it.
Spotting Reversals: If a stock is in a strong uptrend but you suddenly see a series of large red bars (large negative spans), it could signal a shift in momentum and potential upcoming reversal.
Volatility Context: By comparing the current day's bar to the blue average line, you can quickly determine if today is an unusually strong/weak day relative to recent history.
In short, it helps you see the underlying buyer/seller conviction within each day, making it easier to gauge the overall market sentiment and anticipate potential shifts.


EMA21 Pullback BuyEMA21 Pullback Buy is a tool designed to identify constructive pullbacks to the 21-period EMA in strong uptrends.
It highlights candles where:
• The previous close was above EMA21
• The current low touches or dips below EMA21
• The candle closes back above EMA21
These candles are considered potential “support tests” in a trending stock.
You can configure a maximum number of valid tests to avoid late-stage entries.
The script:
• Colors the test candles (optional)
• Marks them with a small circle
• Triggers a buy signal (green triangle) on the first bullish candle that breaks above the test candle’s high
Optional alerts are included for both:
• New EMA21 test
• Buy trigger after valid test
The goal is to help traders find low-risk entries in clean, trending stocks — without chasing breakouts or reacting emotionally. Best used with strong RS names and proper trend context.
