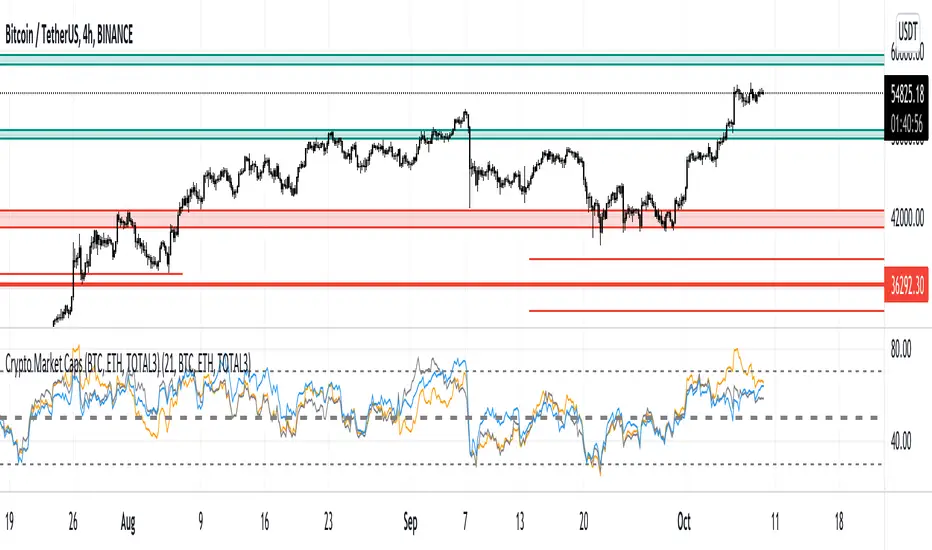
Crypto Market Caps (BTC, ETH, TOTAL3)RSI based Crypto Market Caps (BTC, ETH, TOTAL3) Oscillator
This oscillator displays market caps for:
BTC : CRYPTOCAP:BTC -> in orange
ETH : CRYPTOCAP:ETH -> in gray
ALT (Total crypto excl. BTC & ETH): CRYPTOCAP:TOTAL3 -> in blue
In the settings you can edit:
The 3 market cap symbols
RSI length
All colours ;-)
Hope you enjoy!
Criptovalute
Ultimate ABC Indicator by @DaviddTechThis is the indicator version of my Ultimate ABC strategy we are looking for HH & LL to create an ABC pattern.
Shorts are defined by an ABC pattern.
Short:
* Starting with a low to a Higher High
* Breaking that trend to a new low
* Creating a new Higher High (FOMO HH)
* If the price breaks below the previous HH we have our entry.
Longs:
* Starting with a Hight to a Lower Low
* Breaking that trend to a new high
* Creating a new Lower Low (FOMO LL)
* If the price breaks above the previous LL we have our entry.
Stop loss just above or below the FOMO LL/HH.
Take Profit using a Fib or Risk to Reward.
Additional features :
* Add divergences for confluence MACD/RSI
* Auto Fib levels for taking profit.
WARNING:
- For purpose educate only - My mission is to debunk fake strategies with code to find THE ONE.
- Plots EMAs and other values on chart.
- This script to change bars colors.
If you have any questions or feedback, please let me know in the comments.

Trend Fusion By CryptoScriptsWelcome to Trend Fusion! This isn't your typical moving average indicator. It's a multi-timeframe indicator that consists of 3 different moving averages AND let's you choose between EMA, SMA, WMA, VWMA, HMA, and RMA. For example, you can have the 5min 200 EMA, 15min 200 EMA, and 1 hour 200 EMA all on the SAME chart without having to switch timeframes! This helps to create an edge over the competition so you don't have to have multiple charts open and you can see everything on one screen. You can also modify each moving average to the timeframe and value of your choice.
Signals
The Trend Fusion fires a buy signal (green triangle) whenever Moving Average 1 crosses above Moving Average 2 and 3. This is great for catching a bullish trend early, especially when combined with other indicators.
The Trend Fusion fires a sell signal (red triangle) whenever Moving Average 1 crosses below Moving Average 2 and 3. This is great for catching a bearish trend early, especially when combined with other indicators.
You can also make Moving Average 2 and 3 the same value if you just want to create an alert for one moving average crossing over another. (i.e MA 1 is the 50EMA and MA 2 and 3 both have a value of 200 so you're just looking for the 50EMA to cross over the 200EMA).
This indicator is great for catching big trends and catching them early (as seen by the picture), and fires multiple buy signals or sell signals in case you didn't catch the first one so you still have time to get in the trade.
Alerts
You can also set alerts for the buy and sell signals! Just click the clock icon in the top middle of the chart and click Trend Fusion in the drop-down menu. Make sure to select "Once per bar close" so you know the signal is confirmed.
Each timeframe acts differently so make sure you experiment/backtest with each one and tailor your moving average values accordingly.
Disclaimer: Past results are not indicative of future returns.
PM me to obtain access and please let me know if you have any questions! :)

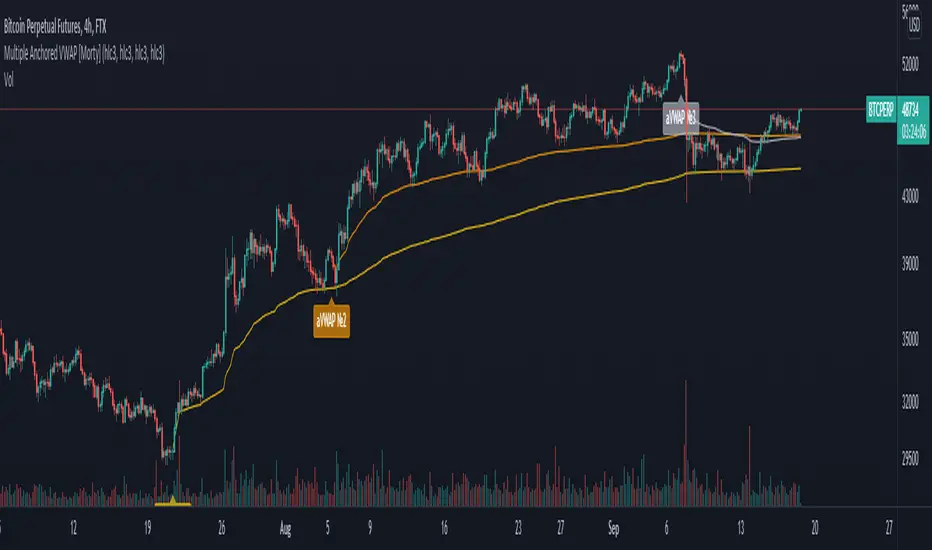
Multiple Anchored VWAP [Morty]The Anchored VWAP (aVWAP) indicator ties VWAP calculations to a specific price bar chosen by the trader. Anchored VWAP allows you to specify the price bar where calculations begin, making it easy to see whether the bulls or bears have been in charge since a very specific point in time. The starting price bar that is chosen generally marks a shift in market psychology, such as a significant high or low, earnings, news, or other announcements. The Anchored VWAP line is charted using price and volume data from that significant event onward.
This indicator plots up to 4 aVWAP lines in the chart.
Features:
- plot up to 4 aVWAP lines
- custom start date of aVWAP
- custom line color
- optional label of starting price bar
- optional custom resolution
----------------------------------------------------
锚定VWAP(aVWAP)指标将VWAP的计算与交易者选择的特定价格柱联系起来。锚定VWAP允许你指定计算开始的价格柱,使你很容易看到自一个非常具体的时间点以来,是牛市还是熊市在起作用。所选择的起始价格条通常标志着市场心理的转变,如一个重要的高点或低点、收益、新闻或其他公告。锚定VWAP线是使用从该重大事件开始的价格和成交量数据绘制的。
该指标在图表中最多绘制了4条aVWAP线。
特色:
- 绘制多达4条aVWAP线
- 自定义aVWAP的开始日期
- 自定义线的颜色
- 可选的起始价格条的标签
- 可选的自定义分辨率
Bitcoin Logarithmic Price BandsBitcoin has been trending up with time. Generally, Bitcoin has been following an increasing logarithmic path, as seen on the chart. This indicator tries to plot areas of buying or selling opportunity. The green area contains data from times when Bitcoin was extremely undervalued. The red area is calculated from times where Bitcoin was extremely overvalued. The logarithmic bands will increase with time, so the values are not static.
Generally speaking, buy when the price is in the green area and sell when the price is in the red area.
The model doesn’t contain ANY data from after November 2020. Nevertheless, it correctly predicted the area where Bitcoin topped in April 2021.
In addition, the yellow logarithmic band manages to indicate strong areas of support or resistance. So did it correctly indicate the top of the mid-cycle peak in 2013, the bottom after the first sell-off in Feb 2018, the 2019 top and at last the mid-cycle bear-market from May-June 2021.
This study will be updated once or twice per year to add new data to the calculation. This means that the logarithmic bands will look slightly different in the future compared to now. Nevertheless, the bands add valuable information on buying or selling opportunities in the market.
The indicator is only useable on the Bitcoin/Dollar index by Tradingview, weekly timeframe.
For access, please take a look at the "Author's Instructions" below.

WEEKLY BTC TRADING SCRYPTWeekly BTC Trading Scrypt(WBTS)
This script is only suggested for cryptocurrencies and weekly buying strategy which is long term.Using it in another markets(e.g forex,stock,e.t.c) is not suggested. The thing makes it different than other strategies we try to understand bull and bear seasons and buying selected crypto currency as using formula if weekly closing value crossover eight weeks simple moving avarage buy,else if selected crypto currency's weekly closing value crossunder eight weeks simple avarage sell. Eight week moving avarage is also uses weekly closing prices but for being able to use this strategy ,trading pair must have more than eight candles in weekly chart otherwise the 8 weeks simple moving avarage value cannot be calculated and script does not work.
This script has a chart called WBTS and it has following features:
Strategy group consist of 3 inputs:
1)Source: Close by default. Our whole strategy uses close values. You can change it but not suggested.
2)Loss Ratio: Because of the cases like the circumstances that manipulates market or high volatility , sometimes graphic show wrong buying signals and this ratio saves user from big money looses(Note : This ratio will always work when selling condition occurs to make user take his profit or prevent him to loss more money because of a wrong positive comes from the indicator.)
3)Reward Ratio : When selling condition happens it will exit user with more profit(if price is already higher than buying point) otherwise it will dimunish loss a bit(if user is below of buying point) or prevents looses(if user is in buying point when selling condition happened.
MA group consist of 2 inputs:
COLOR:Specifies color of the moving avarage.It is equal to #FF3232by hex color code by default.
LINE WIDTH: Specifies linewidth of the moving avarage. It is 2 by default.
GRAPHIC group consist of 2 inputs:
COLOR: It specifies the color of the line which consist of weekly closing prices. It is equal to #6666FF hex color code by default.
LINE WIDTH: Specifies linewidth of the line which consist of weekly closing prices. It is 2 by default.
STRATEGY EXECUTION YEAR: It will show the orders,profits and looses done by script after the input year giving in it.It is 2020 by default.
The last feature is strategy equity,it is not in one of these groups. User should click on settings button on the WBTS indicator than chose Style section and there is a deactivated check box near in the plot section if user activate it, the equity line will show in indicator's graph.
Logic of This Strategy:The story of this strategy began when I studied BTC's price movement from 2020 to today with 8 weeks simple moving avarage (it takes weekly closes as source) and weekly clossing values. I understood that there was a perfect interest between bull and bear market and following conditions:
buy_condition=crossover(weekly_closing_values,8_week_simple_moving_avarage)
sell_condition=crossover(weekly_closing_values,8_week_simple_moving_avarage)
and I tried same thing on the same and bigger time frames("for example i studied how the strategy works from the beginning to today with bitcoin and what is our final equity") with bitcoin and other cryptocurrencies and this made me saw better the relation between giving conditions and general market psychology, however I also witnessed some wrong positives coming by script and used a risk reward ratio to save user and set risk reward ratio 1/3 after a research.
For both conditions(buy_condition and sell_condition),when they are realised,script will alert users and an order will be triggered.
Before finishing the description,from settings/properties/ user can set initial capital,base currency,order size and type,but it is 100000 for initial_amount and 1 contract for order size by default.
In backtesting I used the options like the following example :
Initial capital=1000
Base_curreny=USD
Order size=40 USD
Properties place must set different by every single user according to his or her capital and order size must not be higher than his total money because this script is not the best or a good script for derivatives. It is only written for long term-crypto spot trading and I strongly recommend to users that margin may cause bad results and please do not use it with any margin or any market different than crypto market.
Thank you very much for reading)

Asset through the lens of BTCIntended for the cryptocurrency asset class, this indicator will show via background color whether or not Bitcoin is above the 20w SMA and 21w EMA. This allows for a user to easily distinguish how the behavior of a crypto asset acts when BTC is above the bull market support band and below the bull market support band.

Bitfinex Whale Indicator[Benson]This indicator monitors Bitfinex Whale's margin position.
When the indicator pillar turns green, it implies that whales are stacking long position, which would probably be a a good spot buying opportunity.
We can see green pillar before BTC's big pumps wave, such as:
1. 2020/3/14
2. 2020/7/22
3. 2020/9/30
4. 2021/7/25
PS:The green pillar tends to appear in the end of a long consolidation.
------
該指標用來監控 Bitfinex 巨鯨的動向
當指標柱變為綠色時,表示巨鯨正在累積多頭部位,可能會是現貨的絕佳買點。
過往出現綠色柱子時,都在比特幣主升段之前,例如:
1. 2020/3/14
2. 2020/7/22
3. 2020/9/30
4. 2021/7/25
PS:綠柱通常會出現在大型震盪區間的末端。

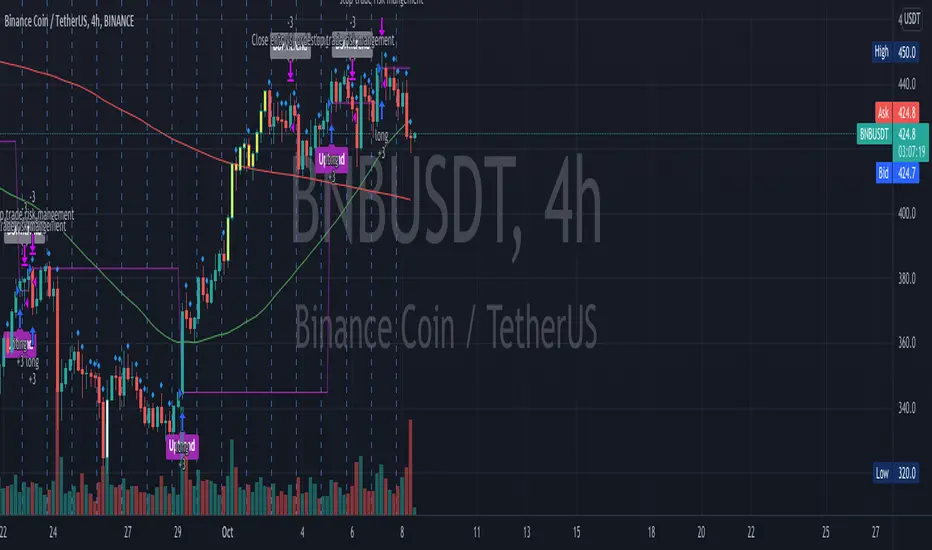
Traffic Lights Strategy4HS Crypto Market Strategy
This strategy uses 4 ema to get Long or Short Signals
Length are: 4, 9, 18, 100
We take long positions when the order of the emas is the following:
green > yellow > red (As the color of Traffic Lights) and they are above white ema (Used as a filter for long positions)
We take short positions when the order of the emas is the following:
green < yellow < red (As the color of inverse Traffic Lights) and they are below white ema (Used as a filter for short positions)
Enable Long and/or Short Positions in settings
Enable Profit and Stop in strategy settings with different percentage to backtest the strategy. Also if it is better to use a Traditional Stop Loss or a Trailing Stop Loss based on ATR
Change ema filter resolution in settings for better strategy performance
This Strategy was tested on Crypto Market with good results in assets as BTC, ETH, BNB, ADA, LTC, XLM, BCH, among others
Feel free to optimize this strategy, optimizing its parameters. Each asset has its own "personality".

CryptoFall v1.0.0Category: Trend Analysis
Timeframe:
- Best on 4H, D
- Faster on 30M, 1H
Suggested Use: In uptrend.
Input option: Is possible to use "Alternative Time Frame" using other candles on different Time Frame charts.
Logic: The tradable market range is calculated, on which the Fibonacci levels are automatically calculated, at this point the entries could be defined entering on the important zone levels.
The calculation takes into account a combination of indicators such as:
- Fibonacci Retracement ( FibRetr )
- Theory of W. D. Gann .
Entry: The indicator uses Fibonacci levels to identify a good time to enter using the Buy the Dip approach (i.e. considering that a typical pullback is in the range between 0.382 and 0.618).
Tips: The best way to enter the market is always to split the positions so as not to enter entirely and expose yourself with all your capital, @TheSocialCryptoClub insists on a careful management of the orders so as to be able to mediate the price depending on the depth of the retracements.
Exit: Defined by the investor's long-term objective.
Thanks for attention.

Bagheri IG EtherThis is a technical trading strategy for Ethereum ( BINANCE:ETHUSDT ). We built and developed it on MetaEditor and optimized it with MetaTrader optimizer.
The main indicators are Donchian Channel, Oscillator of ROC, Bears Power, Balance of Power, and Simple Moving Average (SMA). Default values in the input panel are the best combination of these indicators, but you can change any of them and try it for better results.
Please notice that this strategy has been optimized on the 1-minute chart of Ethereum.
For each position, you can see the Take Profit (TP) and Stop Loss (SL) levels. Also, you can find the values of mentioned TP and SL in points from the input panel of the script.
Attention: The price of Ethereum has 2 decimal places.
Therefore, 3000 points for TP means 30 USDT for trading 1 BINANCE:ETHUSDT .

Current to BTC [Morty]This indicator helps you find strong bull altcoin, it shows the ratio of the current symbol to BTC.
Donchian Channels help to identify trends.
Alts Bull coins:
When BTC goes sideway, they pump first.
Alts Bear coins:
When BTC goes sideway, they move sideway.
When BTC goes down, they go down harder.

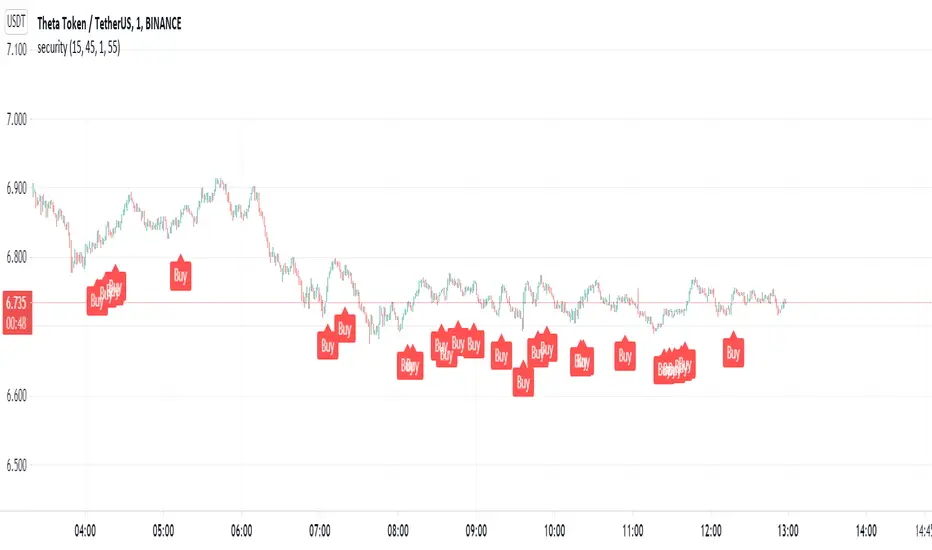
Security. Scalp Adviser by Antony SavacheGreat script for quick deals. Buy and after 5 minutes sell with a target yield of 0.3%
Works on the principle of getting out of the pit. The pit is determined thanks to the rsi on the 15-minute time frame, the exit is determined by the rsi on the 1-minute timeframe. You can play with the rci values in the settings
CryptoKiller Support ResistanceThe CK family is ready to welcome a new indicator: CryptoKiller Support Resistance.
Our oscillator determines the levels where the price has congestion, both up and down.
This is why we decided to exploit these signals so as to make an indicator capable of tracking supports and resistances.
The indicator marks the support and resistance levels found by CryptoKiller Oscillator, the blue / light blue lines are found
during bullish movements; purple and magenta lines are found during bearish movements.
The light blue and magenta colors indicate probable support levels, the blue and purple colors indicate probable resistance levels.
If multiple lines occur in a narrow price range, the price is in an area where there is a high probability of reversal (probable market top or bottom).
As well as CryptoKiller and CryptoKiller Oscillator it is optimized for ETHUSDTPERP 30 min, BTCUSDTPERP 30 min and BNBUSDTPERP 30 min, but it can be used on any chart and timeframe, there is a custom mode with which to change the input parameters.
This script is provided together with CryptoKiller and CryptoKiller Oscillator. It is also possible to have it separately from the others, as always with a free trial week.

OnePunch Algo Momentum Indicator V1This is another Plugin from One Punch Algo Team. We call it OnePunch Algo Momentum Indicator V1.
Basic Use:
One Punch Algo Momentum Indicator plugin is used for momentum stocks and high volatility crypto. It provide signals based on Simple Moving Average, Volume, Support & Resistance Lines.
SIGNALS/ALERTS
Buy Signal: Purple Color uptrend icon gives you a signal of an up-trending movement or we call it momentum movement. This signal basically happen when a stock land in a high volatility zone. We use in-build systems such as SMA, Support and Resistance and Trends to come up with the Buy Signal.
Sell Signal: Gray Color downtrend icon gives you a signal of a downtrend movement.
Other Lines Shown in the Diagram:
Red Line is the 200 Day Simple Moving Average (SMA)
Green Line is the 50 Day Simple Moving Average (SMA)
Strategy Tester
Always make sure to use the strategy tester to test how historically our Algo has performed in different time frames. One Punch Algo Momentum Indicator provide the ability to backtest based on certain time periods. This allows you to backtest our Algo vs some other Algo to find which performed well for the given time period, you if you want to see buy and hold performance better than the use of an Algo. This is a strong tool to use for your analysis of a stock or crypto.
What are the timeframes where it is most effective?
Different Stocks or Crypto perform differently with One Punch Algo Momentum Indicator. Please make sure to backtest a stock or crypto before you use the strategy.
Short Term/Day Trading Setup
For Short Term or Day Trade: 1min, 5min, 15min & 30min candlesticks works really well.
Also 3min, 5min, 7min and 15min works as well
Mid Term Trading Setup
For Mid-term traders: 30min, 1hr,2hr, and 4hr setup works really well.
For Long Term Trading Setup
For long term traders: 4hr, 1D, 1Week and 1Month Setup works well.
Best used with Heikin Ashi or Candlestick charts.
DISCLAIMER: Stocks and options trading involves substantial RISK of LOSS and is NOT suitable for every investor. The valuation of stocks and options may fluctuate, and, as a result, clients may lose more than their original investment. If the market moves against you, you may sustain a total loss greater than the amount you deposited into your account. You are responsible for all the risks and financial resources you use and for the chosen trading system. You should not engage in trading unless you fully understand the nature of the transactions you are entering into and the extent of your exposure to loss. If you do not fully understand these risks, you must seek independent advice from your financial advisor.
All trading strategies are used at your own risk. And OnePunch ALGO Developer, Youtuber or the channel does NOT take any responsibility for your losses using any of the advice or suggestions or strategies are shown/said in any of OnePunch ALGO Youtuber or the channel videos.
ExpertToken Buy/Sell SignalExpertToken Buy/Sell Signal เป็นอินดิเคเตอร์ที่สามารถบอกสัญญาณการซื้อขาย และบอกแนวโน้มของราคาได้
หลักการทำงาน
สัญญาณ Buy/Sell ถูกกำหนดโดยการใช่ CCI วัดโมเมนตัมการซื้อขาย หาก CCI ส่งสัญญาณว่าแรงขายเยอะเกินไป และมีแนวโน้มราคาจะกลับตัวสูงขึ้น ก็จะส่งสัญญาณ Buy แต่หาก CCI ส่งสัญญาณว่าแรงซื้อเยอะเกินไป และมีแนวโน้มราคาจะกลับตัวต่ำลง ก็จะส่งสัญญาณ Buy
เส้นสีน้ำเงินเป็นเส้น EMA 200 ไว้ใช้บอกแนวโน้มระยะยาว
เมฆขาว ประกอบไปด้วย เส้นสีเขียว(เส้น EMA เคลื่อนที่เร็ว) และเส้นสีแดง(เส้น EMA เคลื่อนที่ช้า) โดยให้ทั้งสองเส้นตัดกันเพื่อบอกสัญญาณการกลับตัว ค่าเริ่มต้นของทั้งสองเส้นเป็น 20, 50
วิธีการใช้อินดิเคเตอร์
ขั้นตอนแรก ให้ดูเส้นสีน้ำ หากราคาอยู่เหนือเส้นสีน้ำเงิน อาจมีแนวโน้มที่ราคาจะขึ้น
ขั้นตอนที่สอง ให้ดูเมฆ ที่ถูกสร้างขึ้นโดยการน้ำเส้น EMA 2 เส้น สีเขียวและสีแดง หากเส้นสีเขียวอยู่เหนือเส้นสีแดง ราคาอาจมีแนวโน้มที่ขึ้น หากเส้นสีแดงอยู่เหนือเส้นสีเขียว ราคาอาจจะลง แต่ถ้าหากราคาอยู่ในโซนเมฆขาว(ราคาอยู่ระหว่างเส้นเขียวกับสีแดง) ราคาอยู่ในช่วงเป็นกลาง
สุดท้าย หากมีข้อความบอกสัญญาณบอกว่า Buy หรือ Sell ให้พิจารณาจากสองขั้นตอนก่อนหน้านี้ หากมันสอดคล่องกับสองขั้นตอนก่อนหน้านี้ ให้พิจารณาการเปิดตำแหน่งตามสัญญาณ
################################################################################################
ExpertToken Buy/Sell Signal is an indicator that can give you trading signals. and tell the trend of the price
How it works
Buy/Sell signals are determined by using CCI to measure trading momentum.
If CCI signals too much selling pressure and there is a tendency for the price to reverse higher It sends a buy signal, but if CCI signals that it is overbought and the price tends to reverse lower will send signal Buy
The blue line is the EMA 200 line to indicate a long-term trend.
The white cloud consists of a green line (fast moving EMA line) and a red line (slow moving EMA line), with the two lines intersecting to signal a reversal. The default values for both lines are 20, 50.
How to use the indicator
The first step is to look at the watercolor lines. If the price is above the blue line There may be a tendency for prices to go up.
The second step is to look at the clouds that are created by watering the 2 EMA lines, green and red. If the green line is above the red line The price may tend to go up. If the red line is above the green line, the price may go down, but if the price is in the white cloud zone (the price is between the green and red line), the price is in the neutral range.
Finally, if there is a signal to say Buy or Sell, consider the previous two steps. If it complies with the previous two steps Consider opening a position based on a signal.

RaBot V1.0.0 - BacktestingRabot is an indicator for new users as well as experienced users.
This indicator tries to predict both buy and sell signals. You can configure it for both scalping and swing trading.
It has two modes, one more "conservative", where the number of entries will be less than the other "greedy" mode.
Based on the famous and complex indicator "Koncorde" that combines both trend and volume knowing the manipulation of strong and weak hands, patterns, and crossing of emas customized by us; for example: a buy signal in conservative mode will only open if the trend is bullish and vice versa.
The user can configure the way they like by opening many positions or few but more secure based on their trading style.
The indicator also has the option to configure which chart we want to obtain the trend from, this is to avoid perhaps opening shorts in a very bullish trend line for example.
Rabot is a fairly complex indicator, which can be used for automatic use of inputs and outputs, as well as manual.
You also have the option of NOT opening a position if there is one currently open, and the option for the next signal to be the opposite of the last one.
5TPs, 1SL, and Breakeven after take profit achieved.
Finally version 1.0.0 is now available! :)
This version contains backtesting with 5000 backbars to see if it is being profitable or not.
We are continuously working, testing and updating bugs and improvements.
Do not hesitate to get in touch for a feedback, it will be welcome and we will take it into account.

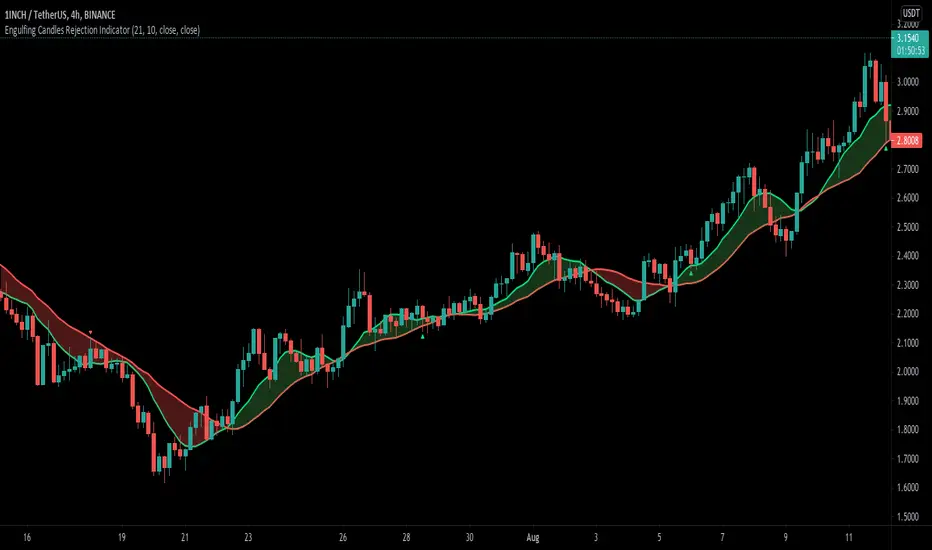
Engulfing Candle Rejection IndicatorThis indicator allows you to filter noisy chart, with engulfing candles which have been rejected from current trend lines. Trend lines by default are 21 MA (fast) and 10 MA (slow one). If fast moving average is greater than slower one, automatically indicator would represent that like uptrend, and if opposite then like a downtrend.
Consider to work only on higher time frames like 1H and higher, so you really can find only best entries.
Have fun, best wishes!
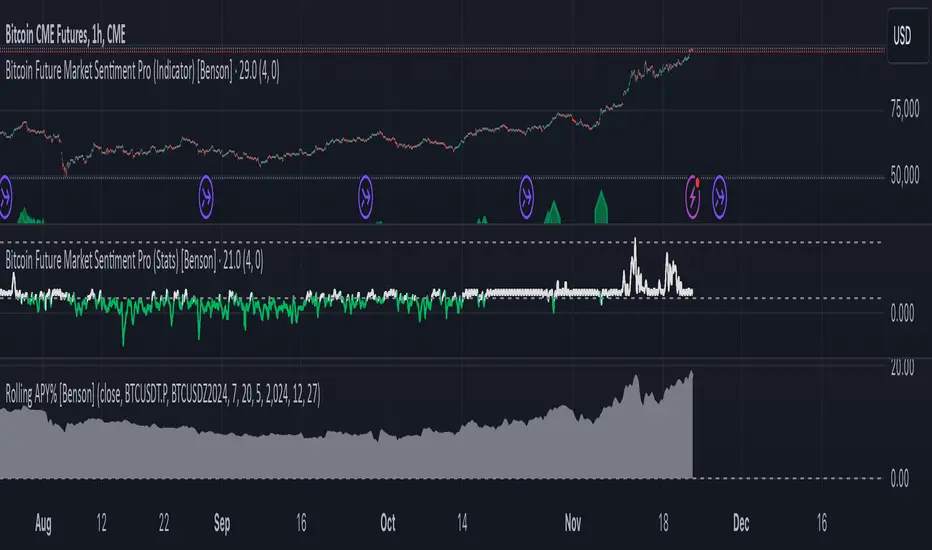
Rolling APY% [Benson]The indicator shows future rolling APY%.
Users can change the market by changing symbol. BTC is the default market.
Meanings of different BTC Rolling APY%:
Below 0 %= DOOMSDAY (it happened during the big crash on March 12, 2020)
0%-5% = extremely fearful
5%-10% = neutral
10%-15% = slightly optimistic
15%-20% = very optimistic
Above 20% = FOMO (it happened during the global top on 14 April, 2021)
Use this indicator to identify the arbitrage opportunities and the price top/bottom.
This is a paid indicator. Only for Sentiment Indicator subscribers.
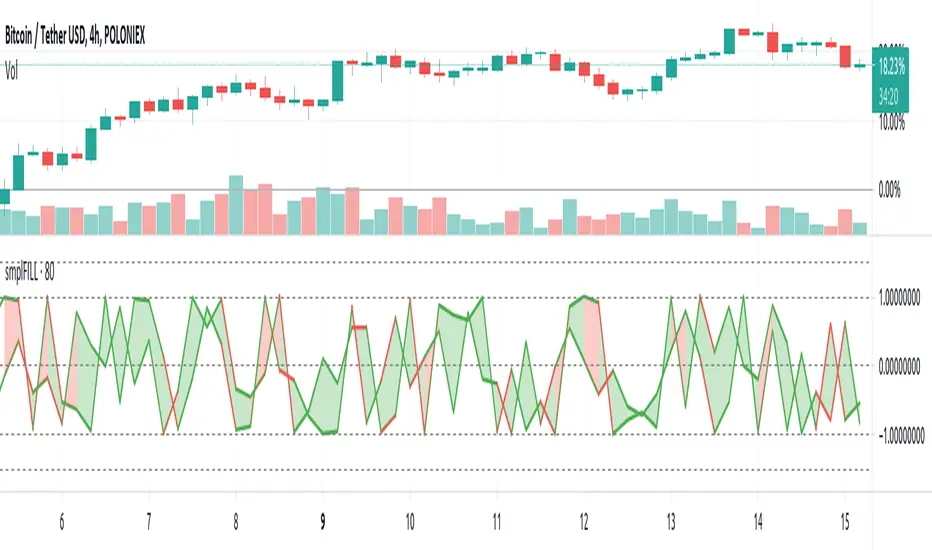
FILL - SimpleFill might flip you a lot of signals close on transitions involving high volatility having wide price swings within settings sensitive intervals. In other words, the script redraws like crazy, so alerts set to 'once per bar' are reset on redraw to view the bar as just having started again.
So, if you do webhook with this, you might find it the easier way to deal with the behaviour; using a personal alert-handling API and programmatic access to an Exchange trading account, filtering and checking that alerts are treated on volatility, volume and velocity, missing ingredients in this particular implementation.
The script is about 20 lines long with declarations and horizontal line decorations included in that number.
Alerts may not work as expected.
Enjoy.
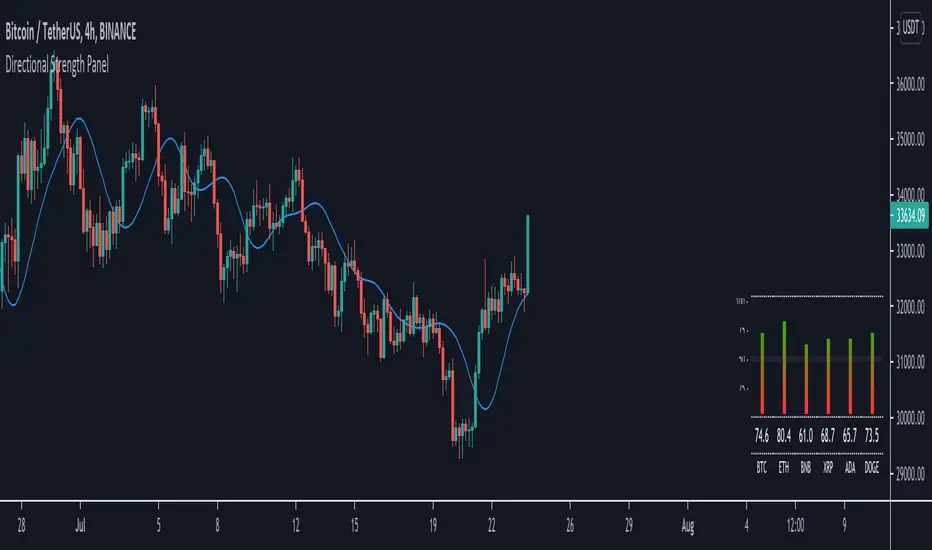
Directional Strength Panel█ OVERVIEW
The panel display trend momentum of selected coins/symbol (up to 6) based on the Arnaud Legoux Moving Average (ALMA). I'm using ALMA to measure the trend because it resolves 2 main issue of the more common moving averages, smoothing and responsiveness. By removing the minor fluctuations in price without sacrificing the responsiveness, the trend become much more clearer and easier to be measured.
In essence, as the meter approaches 100, it means the ALMA is pointing up (0 means pointing down)
█ Features
- Adjustable ALMA settings with options to turn on/off display the ALMA on current chart
- Select 6 symbols of your choice to be monitored in the settings (You have to manually update the label to display)
- Working on all timeframes
- Switch the panel color to suit background chart theme (Light/Dark)
█ Developer Notes
I'm working with table a lot lately and decided to publish this as a sample if anyone wishes to edit the script to display whatever they want. main calculation in get_data() function should be clamped to value between 0-100. As for the panel size, you can edit the row_max (currently set to 20 and 40) if you need it to be smaller or bigger (**i feel anything smaller than 16 is ugly)
█ Disclaimer
Past performance is not an indicator of future results.
My opinions and research are my own and do not constitute financial advice in any way whatsoever.
Nothing published by me constitutes an investment recommendation, nor should any data or Content published by me be relied upon for any investment/trading activities.
I strongly recommends that you perform your own independent research and/or speak with a qualified investment professional before making any financial decisions.
Any ideas to further improve this indicator are welcome :)
Boltoc DominanceThis indicator is simply an oscillator form Bitcoin Dominance made to ease the process of comparing cryptocurrencies with Bitcoin's Dominance

[Shitcoin Paradise]Take Profit + Stop LossThe Take profit + Stop loss indicator is built around The Matrix strategy , it is not suitable for anything else!
*Use it only on 4h charts*
How to use it:
- when a setup from The Matrix is ready, set the date and hour when that setup happened
- set the entry price
- set the targets (you can use the default ones)
- for conservative trading, check the "Use only one TP?" box
- set alert messages for every event
When the price reached the first TP, the stop loss will automatically be moved at entry price, yellow line (entry price) become red(stop loss).
The indicator can be set to have 3 take profits (it takes longer to finish a trade, the reward is greater, but also the risk is bigger), or the conservative way, with only one take profit.
The Take profit + Stop loss indicator uses 3 different stop losses in cascade, multiple algorithms and MTF to calculate them and calculate the starting point, from where the targets are calculated.
Scenario 1:
The price have a setup for continuing the trade, the price touches 1st TP, SL is moved to the entry price, the price reaches all targets => the trade is closed.
Scenario 2:
The price have a setup for continuing the trade, the price touches 1st TP, SL is moved to the entry price, the price fail to touch the other TPs and SL is triggered.
Scenario 3:
The price does not have a setup for continuing the trade, the SL is triggered.
Scenario 4 (conservative trading):
The price have a setup for continuing the trade, the price touches 1st TP => the trade is closed.
For invites, more details and questions, you can send us a private message.
Enjoy!
Shitcoin Paradise
