[astropark] Crypto Swing Trading [alarms]Dear Followers,
today a Swing Trading Strategy , runnable on a bot , which works great from 30m timeframe and above. Best suggested timeframes are 1h and 4h.
If you are a scalper, you will love suggested entries for fast profit. You can run it from 1 minute timeframe if you are used to scalp trading and close each trade whenever you fell happy (a proper trailing stop strategy is suggested anyway).
This indicator can trigger till 5 or 20 buy or sell signals in a row before reverting (it changes greatly depending on timeframe you use), so use a proper money management .
This script will let you set alarms whenever a Buy or a Sell signal is drawn on chart. This way you can set all notifications you may need in order to be alerted on each triggered signal.
The backtesting-strategy version of this script can be found here below or by searching for "Crypto Swing Trading" and then choosing the "strategy" version.
Strategy results are calculated on the timeframe from January 2018 to now, so on about 2 years, using 10000$ as initial capital and working at 3x leverage (very safe leverage!).
This is not the "Holy Grail", so use a proper risk management strategy.
This is a premium indicator , so send me a private message in order to get access to this script.
Criptovalute

[astropark] Crypto Swing Trading [strategy]Dear Followers,
today a Swing Trading Strategy , runnable on a bot , which works great from 30m timeframe and above. Best suggested timeframes are 1h and 4h.
If you are a scalper, you will love suggested entries for fast profit. You can run it from 1 minute timeframe if you are used to scalp trading and close each trade whenever you fell happy (a proper trailing stop strategy is suggested anyway).
This strategy can trigger till 5 or 20 buy or sell signals in a row before reverting (it changes greatly depending on timeframe you use), so use a proper money management .
Strategy results are calculated on the timeframe from January 2018 to now, so on about 2 years, using 10000$ as initial capital and working at 3x leverage (very safe leverage!).
This is not the "Holy Grail", so use a proper risk management strategy.
This script will let you backtest this script.
The alarms version of this indicator, which will let you set all notifications you may need in order to be alerted on each triggered signals, can be found by searching for "Crypto Swing Trading" and then choosing the "alarms" version.
This is a premium indicator , so send me a private message in order to get access to this script.

Cracking Cryptocurrency - ParalloxParallox
Many traders are familiar with or utilize the Relative Strength Index ( RSI ) and/or the Commodity Channel Index ( CCI ). For good reason, these classic and simple to understand indicators have made their way into many traders indicator bays with mixed results. As we often do with our trading style and indicators here at Cracking Cryptocurrency is take things that traders have used one way and attempt to view it in a different light to improve our trading efficiency and performance. That is what we have done with Parallox.
Parallox harnesses the calculations of both the Relative Strength Index and Commodity Channel Index , but through a calculation for a new breed of trader and a new market. RSI and CCI were designed to work in the stock markets of old, and their effectiveness nowadays is more-so due to the "self fulfilling prophecy" concept of so many traders using them rather then their technical applicability to any particular market or market circumstance. Moreover, because so many retail traders now utilize the RSI and CCI , trading it the traditional way, for reversals, has created a golden zone of opportunity for larger traders, institutions, and whales to come in and grab the liquidity of counter-trend retail traders basing their signals off of overbought and oversold conditions in the market utilizing RSI and CCI .
What Parallox does is quite different. Instead of relying on the readings of RSI and CCI , it looks at the value of RSI relative to the value of CCI . By looking at the convergence or divergence of these two indicators, a much more accurate reading of the directional trend can be established. No more using these oscillators to pick false tops and bottoms, instead we can utilize their relative conditions to determine market trend. Not only that, but we can identify objective signals when we cross the barrier between convergence and divergence, therefore giving us clear buy and sell signals for any trading asset.
However, we haven't left reversal traders completely by the way side. What is often an "entry" point for reversal traders, when one has determined that the particular direction of the market is at it's extreme, is where Parallox crosses back the other way, identifying an "overbought" and "oversold" region of sorts, from which we can utilize as an exit indicator when in deeply profitable trending trades.
How to Use
Using Parallox is quite simple. It can be utilized as an Initiator or Confirmer, or also as a longer-term directional marker on any time frame. In it's most simple form, the Parallox Line will cross zero from below and the line will turn green. This is an indication that the market has moved from a bearish zone of control to a bullish zone of control, and can be viewed as a potential buy signal. Conversely, when the line crosses zero from above, the line will turn red, indicating the opposite and can be viewed as a potential short sell signal.
For exit indications in strongly trending markets, when the line goes below the lower dashed line when bearish , and above the upper dashed line when bullish , and comes either back below or back above, those can be seen as trend exhaustion signals and often represent great moments to take profit or to go flat in the market until another trend establishes itself.
Settings
Let's take a look at the settings of Parallox.
First, we can input the look back length we want for our RSI and CCI indicators. You will notice that the defaults are unnatural, that is because they are tuned specifically for the BTC USD market. When trading a different asset, you will want to experiment with the optimum look back length for the best signals.
We then take a moving average of our indicators to have plotted values to work with. As above, the look back lengths for the two moving averages are optimized for BTC USD. The same caveats for optimization apply.
Then we can select the smoothing, or type of moving average we wish to utilize. Parallox performs well with different types of moving average smoothing, and I recommend that you experiment with your style of trade to find the signals that best suit your trading system.
We can also select the source of our indicator values. By default, this is hl2 , which I find to be the best for most indicators, in a close tie with hlc3.
Strategy
Please let me know of your success stories, as well as any features you think would be helpful to add. If you notice any errors within it, please notify me so I can fix them. Trade Safely.

Impulse Scalper [NXT2017] - with included market scannerPrivate Indicator.
HI BIG PLAYERS,
with this indicator it is possible to analyze small rebound effects in the trading market and to scalp the movement into the trend again.
HOW IT WORKS
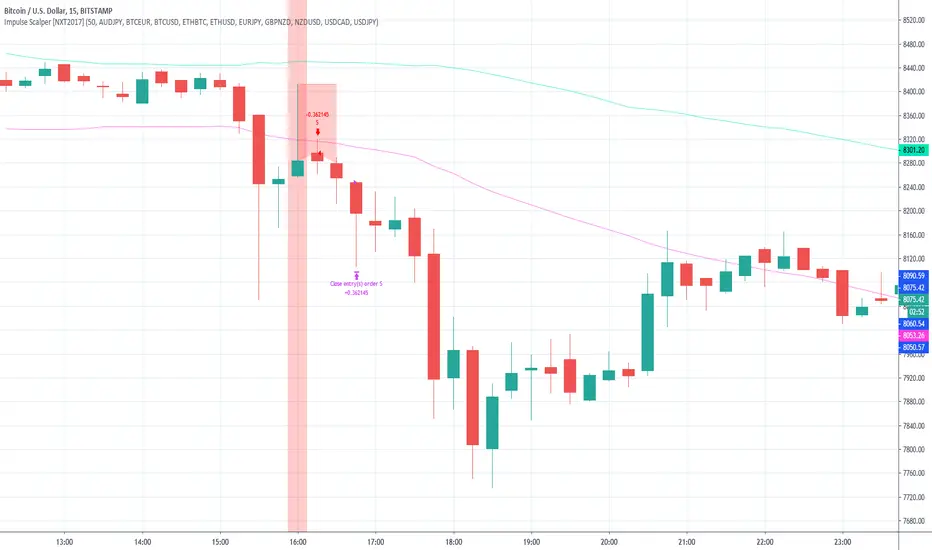
Hereby the indicator use a candleformation with a huge wick inside of a band, based on a Simple Moving Average on the 50 highs and 50 lows.
A signal is shown with vertical red/green background around the bar for selling/buying. Furthermore, the high/low of the signal serves as StopLoss line and makes a horizontal red line inside the active trading time. The trade is to closing if the second candle after the signal is finished.
For example:
1. candle => signal
2. candle => entry on open price with the SL
3. candle => nothing to do
4. candle => close your trade after candle 3 is finished
For the analysis I have set the following settings:
Initial Capital: 100 000 (the default setting)
Base Currency: USD
OrderSize: 3% of equity
Pyramiding: 1 orders
Commission 0%
Verify Price For Limit Orders: 0 ticks
Slippage 0 ticks
Recalculate:
After Order is Filled (deactived)
On Every Tick (deactived)
A market scanner is also integrated in this indicator. Since good signals rarely occur in a market, the market scanner allows up to 10 markets to browse for the signals simultaneously. My favorite markets are currently selected as default.
The 10 default markets are:
AUDJPY
BTCEUR
BTCUSD
ETHBTC
ETHUSD
EURJPY
GBPNZD
NZDUSD
USDCAD
USDJPY
Market Scanner in action (in the settings you can also hide the labels):
Of course, alerts are also possible with the TradingView Alerts system. For example it's possible to get a message per signal to your e-mail, that you use on TradingView.
Access to the indicator: use the link below, thanks for your attention!
Kind regards
NXT2017
CryptoEngineering 🔥Isn’t It Time You Made Your Crypto Portfolio Great Again? 🔥
The falling knives, the heartbreaking crashes, the devastating feeling of watching a missed trade soar all the way to the moon.
The markets aren’t fair, which means you need a tool that gives you an edge. So,It is time to try EngineeringRobo.
The Engineeringrobo is a great ally in a crypto market - when the price moves the algorithm will automatically show Buy and Sell orders when there is a best opportunity to make a profit. It is a just SMART trading system script on TradingView that brings the easiest approach to trading with a high profitability rate.
I created EngineeringRobo to help you on your traders as a robo advisor , It will "not " trade on behalf of you on exchanges via API. It is not an AI robot,It is am ALGO Trading robot. You can use it on any trading markets (BIST, S&P 500,Commodities ,Forex, Crypto ) with any time frame!
My unique algorithm find profitable altcoins based on their Ichimoku, McGinley, MA, RSI, MACD, Stochastic, Volumes and Price Changes gives you BUY and SELL signals. The EngineeringRobo indicator displays two different signals for entry and exit on a coin to maximize its profitability on the chart. The signals can appear at any time during an open candle, but once closed the signal is final and wont change in the future.
One of the biggest advantages of algo trading is removing human emotion from the crypto markets,humans trading are susceptible to emotions that lead to irrational decisions.Robo doesn't have to think or feel good to make a trade. If conditions are met, it enters.When the trade goes the wrong way or hits a profit target, It exits. It doesn't get angry at the market or feel invincible after making a few good trades. The two emotions that lead to poor decisions that algo traders aren't susceptible to are fear,and greed.
That's why It makes money but most of you not!
What Are the Advantages of using it as a ROBO Advisor?
🔴Reduce your required screen-time
🔴Reduce anxiety over missing setups when you are busy
🔴Turn existing indicators into alerts (eg. Whenever RSI goes overbought)
🔴Find comfort in knowing that you have me on your side
To get the maximized results from @EngineeringRobo
Open tradingview
Decide the coin/BTC
Pick 1M
Draw the Support & Resistance lines
Change the 1W
Draw the lines - Support & Resistance
Find out Chart Patterns
Change to 3D/1D / 3H
Check Robo' signals
Set your orders
Enjoy your profits💰
***Even the best automated day trading software can trigger false trends.
In August 2012 by Knight Capital group;who lost over $440 million in just half an hour when their trading software went rogue in response to market conditions. That's why it is a Robo advisor not trading bot! Engineeringrobo is not a get-rich-quick scheme as well!
Disclaimer
Information on EngineeringRobo should not be seen as a recommendation to trade BIST, S&P 500,Commodities ,Forex, Crypto.
EngineeringRobo is not licensed nor authorized to provide advice on investing and related matters.
Information on the page is not, nor should it be seen as investment advice.Any trading decisions that you make are solely your responsibility. Clients without sufficient knowledge should seek individual advice from an authorized source.
Crypto and Forex trading entails significant risks and there is a chance that clients lose all of their invested money. Past performance is not a guarantee of future returns. Before trading with any of the Algos, clients should make sure they understand the risks.
EngineeringRobo nor its agents or partners are not registered and do not provide any services on the US territory.
***I have been trading since 2016 . Got my first bitcoin in 2013

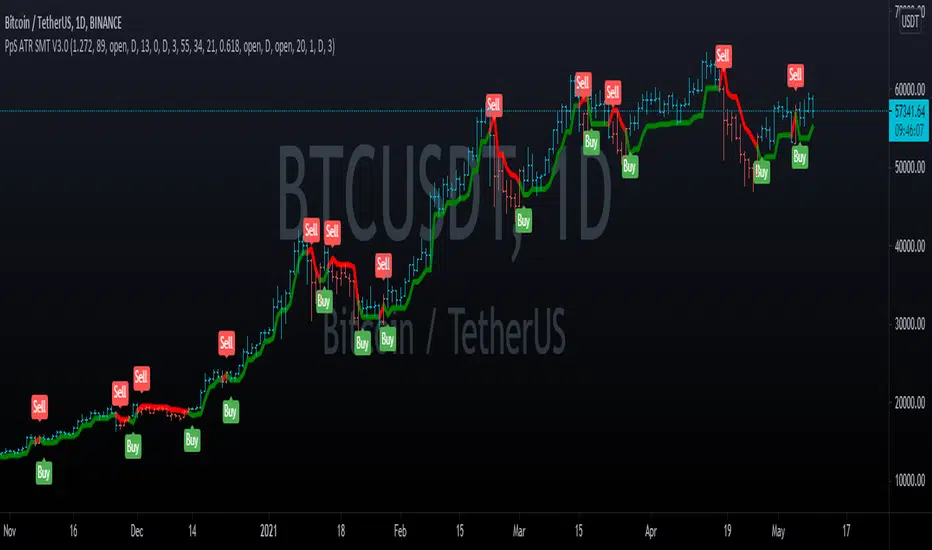
PpSignal ATR Trainling Stop Smooth Version 3.0This indicator is a mix between Ppsignal CFB and ATR smoothe indicators.
It is a very very assertive indicator if you want to operate with a volatile and tendency strategy.
Use other trading tools like channel, triangle, head & shoulder, and Fibonacci extension/retracement.
we added super smooth elder move average with alarm for scalping trade.
cfb and atr INDICATE HAVE ALARM too.
we added ATR move average.
Buy when the price is aqua and sell when the pice is orange.
[SignalFI] MACD PrimeWelcome! As part of our continual process to build and enhance trusted existing indicators, we're proud to release MACD Prime to the PRIME series for those traders that rely on the popular divergence mechanics traditional MACD provides.
MACD Prime provides a default MACD structure using the popular 12,26 EMAs and a 9 lockback signal line as the core of the indicator's functionality. In this way, you will get a consistent view for what you're use to, but of course we've added additional functionality that can be used to increase the value this view provides when trading.
ADDITIONAL Functions:
1) MACD Fast and Slow EMA sources are selectable, thus allowing the user to select OHLC variants as the source input for the 12/26 trendlines.
2) Background Coloring is based on a secondary "Signal" color which be default has been set to 6. This length is configurable, and providing a leading edge to the typical "MACD Cross". Said simply, the background color will change with the trend BEFORE a default MACD cross occurs. This may provide early warning of a MACD cross, and allow for additional entry/exit signals to manifest depending on other confluence with price and trend information.
3) MACD Trend Lines. In accordance with the PRIME series MACD Prime comes bundled with Trend Line support and resistance pivots that provide additional context for how the MACD may act based on a previous and projected trend line information. By default projections are turned off, but can be enabled from within the menu options. These trendlines can be used to spot divergences as well, and can be tuned within the option to increase resolution or decrease noise provided by trend lines.
All other standard functions persist, including the typical MACD line, MACD Signal Line, and MACD Histogram.
SignalFI was created to help traders and investors to effectively analyze the market based on the Golden Mean Ratio (Fibonacci numbers), plan a trade and ultimately execute it. To help inform and educate market decisions we developed a set of Trading Indicators which are available on TradingView.
SignalFI indicators are just that, indicators. Our indicators are generally configured to use completely historical data (negating repaint), and we advise all alerts created with SignalFI indicators to be fired upon "close" of the current candle. Our indicators can provide valuable context and visualization support when performing market analysis and executing buy and sell decisions. However. we are not financial experts, and all information presented on this site or our other media outlets are for educational purposes only.

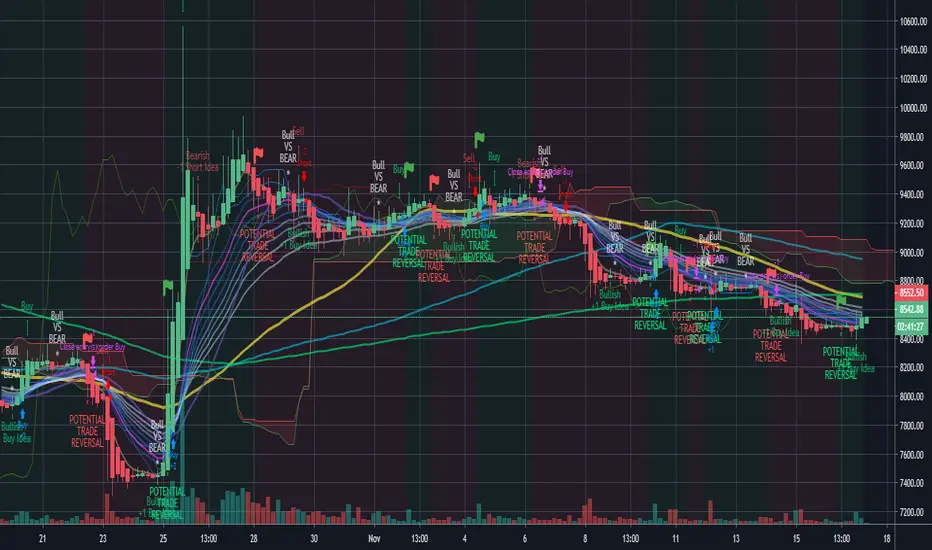
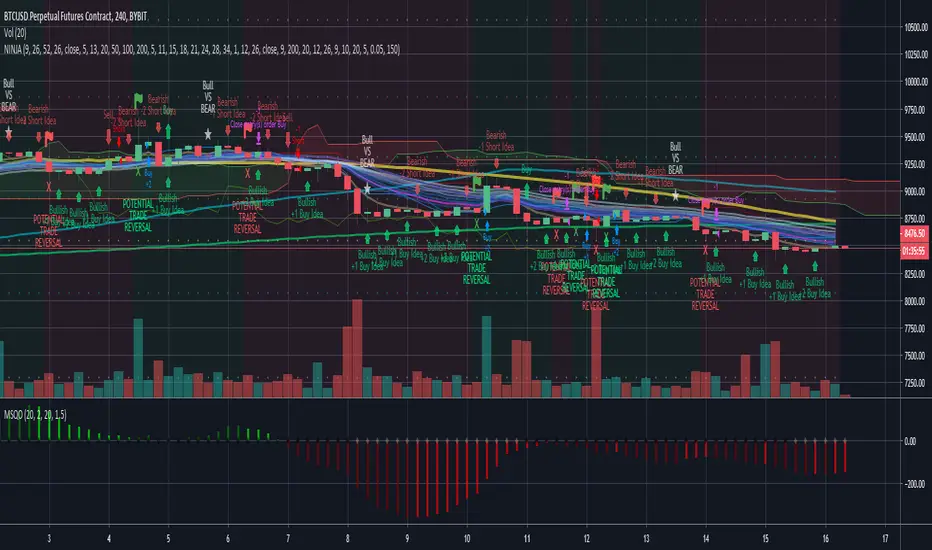
NINJA SCALPERNinja Scalper is the next evolution of the Trade Trend Indicator.
I have been trading for over 23 years now and these indicators are based on my trading style risk verse reward. The change in this is to make it more responsive and to integrate with Sword.
The background of this indicator is:
The original Trade Trend Indicator (indicator) has been the brain child of 23 years of trading experience rolled into a simple to understand all market setup alert system based solely on 5 high probability trade set ups with a 6th high risk. The hope is to provide something that is can assist traders in building confidence in their trades with a little assistance from the indicator.
This like any and all indicators is not a be all and end to trading, yes while back tested the indicator has produced fantastic profitable results; past performance is not a guarantee of future but which with human intervention can increase the return result exponentially.
You need to be able to chart simple candle sticks and you need to have an understanding of support and resistance areas to make sense of what you are doing in trading otherwise even this indicator won't help you.
While this may alert buy or sell / long or short entrance these are to be taken as educational points of reference and if you wish to trade you are understanding that you enter and exit at your own risk. Not many indicators will alert you to the possibility of a rogue wave spike / dump or both, this will but everything is perspective of the time frame you are on.
The indicator is designed for the 4hour time frame with trade entry on the 15min and managed on the 30min time frame. Alot can happen within these time frame but as we know not every trader can sit in front of a screen for hours at a time and this let's one trade for swings. Once you have your entry you place your exits and you set your stops. If you wait for the alert to exit you are in a draw down this should never reach that point pay yourself for being right.
The some set ups are simple:
1. Trend change from bearish to bullish buys are dip interim support entries.
2. Trend change from bullish to bearish sells are top interim resistance exits.
3. Blue buy is an entry position for a trade.
4. Blue long is an add position for a trade.
5. Red short is just that a short trade idea. (this is advanced and requires a manual cover target),
6. Green buy is a break out over the next candle to print above (highest risk)
All trades are based on a 5% to 10% of capital entry with no more than 40% ever in 1 trade goal is many consistent trade wins while limiting the losses and size.
Certain set ups such as longs over the Moving Averages but below the cloud can lead to strong rally returns as well as short in a bearish trend just above the Moving Averages can give prolonged selling pressure.
Pay attention to the golden dump line as it rises the closer to the candle it gets the higher the risk of the trade lacking continuation.
None of this is to be taken as investment advice but rather Edutainment and infotainment
#TradeSocially
Simple Price Momentum - How To Create A Simple Trading StrategyThis script was built using a logical approach to trading systems. All the details can be found in a step by step guide below. I hope you enjoy it. I am really glad to be part of this community. Thank you all. I hope you not only succeed on your trading career but also enjoy it.
docs.google.com
BTC BRAWL NINJA TRADERThe NINJA TRADER was devloped for trading competition higher leverage scalp trading. It is a modified from my Trade Trend Indicator (indicator) has been the brain child of 23 years of trading experience rolled into a simple to understand all market setup alert system based solely on 5 high probability trade set ups with a 6th high risk. The hope is to provide something that is can assist traders in building confidence in their trades with a little assistance from the indicator.
This like any and all indicators is not a be all and end to trading, yes while back tested the indicator has produced fantastic profitable results; past performance is not a guarantee of future but which with human intervention can increase the return result exponentially.
You need to be able to chart simple candle sticks and you need to have an understanding of support and resistance areas to make sense of what you are doing in trading otherwise even this indicator won't help you.
While this may alert buy or sell / long or short entrance these are to be taken as educational points of reference and if you wish to trade you are understanding that you enter and exit at your own risk. Not many indicators will alert you to the possibility of a rogue wave spike / dump or both, this will but everything is perspective of the time frame you are on.
The indicator is designed for the 4hour time frame with trade entry on the 15min and managed on the 30min time frame. Alot can happen within these time frame but as we know not every trader can sit in front of a screen for hours at a time and this let's one trade for swings. Once you have your entry you place your exits and you set your stops. If you wait for the alert to exit you are in a draw down this should never reach that point pay yourself for being right.
The set ups are simple:
1. Trend change from bearish to bullish buys are dip interim support entries.
2. Trend change from bullish to bearish sells are top interim resistance exits.
3. Blue buy is an entry position for a trade.
4. Blue long is an add position for a trade.
5. Red short is just that a short trade idea. (this is advanced and requires a manual cover target),
6. Green buy is a break out over the next candle to print above (highest risk)
All trades are based on a 5% to 10% of capital entry with no more than 40% ever in 1 trade goal is many consistent trade wins while limiting the losses and size.
Certain set ups such as longs over the Moving Averages but below the cloud can lead to strong rally returns as well as short in a bearish trend just above the Moving Averages can give prolonged selling pressure.
Pay attention to the golden dump line as it rises the closer to the candle it gets the higher the risk of the trade lacking continuation.
Made the golden dump line easier to bringing it forward.
Changed the trade trend reversal to stand out more as a marker of a trade even when alerts stacked
Added a calculation for the alert to recalculate based on the time frame chosen
Added a check balance verse the break out buy as to not false alert during the BTC BRAWL CHALLENGE in high risk trade setups
Added notification of bullvsbear action to avoid being caught in the BTC BRAWL CHALLENGE
Added a take profit reminder based on time frame volume
None of this is to be taken as investment advice but rather Edutainment and infotainment
//#TradeSocially
PpSignal Elder Fisher Trasform Alarm V2 v2.19This indicator is the fisher transform on the chart with alarm.
See the next indicator for more information

Main Trend Alert v1.1*** New Version of Main Trend Alert ***
This is an indicator that shows the main trend of and chart (crypto, forex, stock and etc). Good for day trading.
- HOW TO USE: When you are on lower timeframe, set the "Main Timeframe" to a higher timeframe from settings.
For example: Set "Main Timeframe = 1 Hour" when you are trading on 5 minute chart.
* Never trade just based on alerts of this script. Always use it with a system you like. Keep in mind that his script doesn't determine the stop loss and exit point.
* NO REPAINTS *
Good Luck,

PpSignal ATR Trainling Stop Smooth Version 2.0This indicator is based on the smoothing atr stop and a super smoothed moving average both by the elder method.
buy when atr atr signal blue, and sell when atr sale signal red. has alarm and mtf

PpSignal Elder Fisher Trasform The Fisher Transform is a technical indicator created by J.F. Ehlers that converts prices into a Gaussian normal distribution. In this way, the indicator highlights when prices have moved to an extreme, based on recent prices. This may help in spotting turning points in the price of an asset. It also helps show the trend and isolate the price waves within a trend.
Fisher Transform Trading Applications
The Fisher Transform indicator is unbounded, which means extremes can occur for a long time. An extreme is based on the historical readings for the asset in question. For some assets, a high reading may be seven or eight, while a low reading may be -4. For another asset, these values may differ.
An extreme reading indicates the possibility of a reversal. This should be confirmed by the Fisher Transform changing direction. For example, following a strong price rise and the Fisher Transform reaching an extremely high level, when the Fisher Transform starts to head lower that could signal the price is going to drop, or has already started dropping.
The Fisher Transform frequently has a signal line attached to it. This is a moving average of the Fisher Transform value, so it moves slightly slower than the Fisher Transform line. When the Fisher Transform crosses the trigger line it is used by some traders as a trade signal. For example, when the Fisher Transform drops below the signal line after hitting an extreme high, that could be used as a signal to sell a current long position.
As with many indicators, the Fisher will provide many trade signals. Many of these will not be profitable signals. Therefore, some traders prefer to use the indicator in conjunction with trend analysis. For example, when the price is rising overall, use the Fisher Transform for buy and sell signals, but not for short-sell signals. During a downtrend, use it for short-sell signals and ideas on when to cover.
The Difference Between The Fisher Transform and Bollinger Bands®
These two indicators look very different on a chart, yet both are based on a distribution of asset prices. Bollinger Bands® use a normal distribution in that they use standard deviation to show when the price may be overextended. Fisher Transform uses a Gaussian normal distribution. The Fisher Transform appears as a separate indicator on a price chart, while Bollinger Bands® are overlayed over the price.
Limitations of the Fisher Transform Indicator
The indicator can be rather noisy at times, even though its intent is to make turning points easier to identify. Extreme readings are not always followed by a price reversal; sometimes the price just moves sideways or reverses only a small amount.
What qualifies as extreme can also be hard to judge, since the levels tend to vary over time. Four may be a high level for years, but then readings of eight may start to frequently appear.
Looking at all changes in direction on the Fisher Transform can help spot short-term changes in price direction, yet the signal may come too late to capitalize, as many of these price moves may be short-lived.
Asset prices are not normally distributed, therefore attempts to normalize prices is inherently flawed and may not produce reliable signals.

Cyatophilum Ultimate Trading Bot [ALERTSETUP]Private Indicator.
This is an indicator for trading low timeframes . It is generic and configurable meaning you can use it not only on crypto, but also forex, CFD, stocks etc.
HOW IT WORKS
The user chooses between three powerful base strategies: Bollinger Bands + Stoch RSI, RSI Divergences or the SARMA Strategy .
He can also trade support and resistance breakouts , with or without the base strategy.
Use the Alert Setup version to trigger entry and exit alerts .
You can choose between a set of trend lines that will filter trades that are against the main trend in order to increase profitability.
The integrated Trailing Stop Loss will trigger an alert to exit the trade.
You can use the Trailing Take Profit with a configurable % deviation. It will also trigger an exit alert.
SAMPLE USE CASES
XBTUSD 5m BitMEX
XBTUSD 15m BitMEX
ETHUSD 5m BitMEX
ETHUSD 15m BitMEX
USD/WTI 1m IDC (Us Dollar/ WTI Crude OIL)
Backtest below for BITMEX:LTCZ19 in 15m timeframe.
Note: This is the Alert version. You can find the backtest version in my profile.
To get access to the indicator, use the link below, thanks for reading!

Cyatophilum Ultimate Trading Bot [BACKTEST]Private Indicator.
This is an indicator for trading low timeframes . It is generic and configurable meaning you can use it not only on crypto, but also forex, CFD, stocks etc.
HOW IT WORKS
The user chooses between three powerful base strategies: Bollinger Bands + Stoch RSI, RSI Divergences or the SARMA Strategy .
He can also trade support and resistance breakouts , with or without the base strategy.
Use the Alert Setup version to trigger entry and exit alerts .
You can choose between a set of trend lines that will filter trades that are against the main trend in order to increase profitability.
The integrated Trailing Stop Loss will trigger an alert to exit the trade.
You can use the Trailing Take Profit with a configurable % deviation. It will also trigger an exit alert.
SAMPLE USE CASES
XBTUSD 5m BitMEX
XBTUSD 15m BitMEX
ETHUSD 5m BitMEX
ETHUSD 15m BitMEX
USD/WTI 1m IDC (Us Dollar/ WTI Crude OIL)
Backtest below for BITMEX:LTCZ19 in 15m timeframe.
To get access to the indicator, use the link below, thanks for reading!

FS position sizethis is position sizing indicator base on Justin wise and his team on crackingcryptocurrency idea
so all credit goes to them
you can put your capital and risk amount that you tend to put on risk in a trade and it will measure your position size base on USD and BTC and it will measure your Take profits base on ATR which are editable.

Multi-Exchange Volume (30 Tickers) by kurtsmock + BV + rVolauthor: kurtsmock
Fully Customizable ticker set. Up to 30 Tickers. Bitcoin set as default.
-- IMPORTANT NOTE: --
30 Exchanges are a lot. It can take a while to load. You can fully customize this indicator to your liking. Here's how:
1. Load indicator
2. Open Settings
3. Uncheck the switch box for exchanges you want unincluded
4. At the bottom of the settings menu click "Defaults" and hit "Save as Default"
5. To turn them all back on, hit "Reset Settings" in that same "Defaults" menu and click "Save as Default" again.
Also, you don't have to use this with Bitcoin. This works with any asset, just change the ticker in the settings.
There's a lot going on with this indicator so the following is descriptions and instructions to help you better understand what's going on here. Thanks!
Goal:
- To provide a mechanism for assets on multiple exchanges to have their volume evaluated together
Edge:
- Having better and more complete volume information
Notes:
- The Default Exchanges for this indicator are highest volume bitcoin exchanges, but may contain "fake volume"
- Indicator is set for Bitcoin by default. However, you can change the tickers to reflect any asset you want
////// rVol //////
Goal:
- To understand how much volume is being executed relative to the same candle on previous days/periods
Edge:
- Higher rVol implies higher volatility and market interest.
- High rVol = higher than average volume . Markets move on volume so higher than average volume indicates increased market activity/volatility
- rVol is an indirect measure of active or anticipated volatility
Definitions:
- rVol: The volume of a period compared to the Average Volume of that same period in past sessions
- Important to note it does NOT add up the last 10 (default) candles, but rather the last 10 candles at session intervals.
- Example:
-- On a Tuesday, 1h chart it will add up the last ten Tuesday, 9:00 am candles, not including the current, active candle.
-- It then averages those lookback candles.
-- It then plots the percentage relationship between the most recent candle and the average of the lookback candles
-- Avg Vol of Lookback candles = 5000,
-- Volume of most recent candle = 4000: Output = rVol = 80:
-- Volume of most recent candle was 80% of the average volume in the 9 am time period of the last ten Tuesdays in the 9 am, 1h period
Notes:
- rVol does not add current candle volume into lookback sum. So, you set lookback to be: (not including the current day)
- rVol is on a switch. So, if you want to see rVol instead of volume, hit the switch in the settings
- If you want to see both, load 2 instances of the indicator.
////// Better-er Volume //////
Goal:
To Identify:
- When a candle closes at the highest volume * range relative to the lookback period and close > open
- When a candle closes at the highest volume * range relative to the lookback period and close < open
- When a candle closes at the highest volume / price relative to the lookback period
Edge:
- Identifies beginnings of price expansion, climax of price expansion, breakouts, pivots, and take profit points on the volume chart
Notes:
- Based generally on Barry Taylor's "Better Volume" indicator and ideas from Pascal Willain's book "Value in Time."
- Better-er Volume rules are applied to both Total Volume or rVol.
-- When rVol is displayed Better-er Volume is applied to rVol
-- When Total Volume is displayed Better-er Volume is applied to Total Volume
// Plot Key: //
Green Triangle Up = Often marks the beginning and/or end of price expansion to the upside
Red Triangle Up = Often marks the beginning and/or end of price expansion to the downside
Yellow Square = High Volume but Tight Range. Implies a Battle of Bulls and Bears. High Liquidity area. Provided Liquidity is not enough to move price. Thick Limit Order Book.
Purple Triangle Up or Down = Implies high market participation. Typically at the end of expansion when very significant s/r is hit
category: volume Volatility
tags: Volume rVol relativevolume Bitcoin cryptocurrency bettervolume
Many More Volume Indicators Coming Out Soon!

ANN Forecast MACD [Noldo] In this script, I tried to convert ANN MACD to MACD Forecast.
It took me quite a while, but it was fun.
After selecting the ticker, select the instrument from the menu and the system will automatically turn on the appropriate Forecast MACD system.
The system is trained with ANN values of ANN MACD 25 in 1.
But because the system is overloaded, only the most popular instruments are left.
The others were unfortunately eliminated.
The only difference is that it was built on the forecast algorithm of my own creation.
The Forecast algorithm is not open-source.
The codes are a nice framework for some of my most valuable systems about ANN . (Working on them. )
But I'm never remove this script.
You can use it forever for free.
As you can see in the presentation, although it is in the same period, it is more accurate and agile than normal MACD.
I think even a bar is important in trade.
For those who don't see that command,listed instruments with alternative tickers and error rates:
WTI : West Texas Intermediate (WTICOUSD , USOIL , CL1! ) Average error : 0.007593
BRENT : Brent Crude Oil ( BCOUSD , UKOIL , BB1! ) Average error : 0.006591
GOLD : XAUUSD , GOLD , GC1! Average error : 0.012767
SP500 : S&P 500 Index ( SPX500USD , SP1! ) Average error : 0.011650
EURUSD : Eurodollar ( EURUSD , 6E1! , FCEU1!) Average error : 0.005500
ETHUSD : Ethereum ( ETHUSD , ETHUSDT ) Average error : 0.009378
BTCUSD : Bitcoin ( BTCUSD , BTCUSDT , XBTUSD , BTC1! ) Average error : 0.01050
GBPUSD : British Pound ( GBPUSD , 6B1! , GBP1!) Average error : 0.009999
USDJPY : US Dollar / Japanese Yen ( USDJPY , FCUY1!) Average error : 0.009198
USDCHF : US Dollar / Swiss Franc ( USDCHF , FCUF1! ) Average error : 0.009999
USDCAD : Us Dollar / Canadian Dollar ( USDCAD ) Average error : 0.012162
SOYBNUSD : Soybean ( SOYBNUSD , ZS1! ) Average error : 0.010000
CORNUSD : Corn ( ZC1! ) Average error : 0.007574
NATGASUSD : Natural Gas ( NATGASUSD , NG1! ) Average error : 0.010000
SUGARUSD : Sugar ( SUGARUSD , SB1! ) Average error : 0.011081
WHEATUSD : Wheat ( WHEATUSD , ZW1! ) Average error : 0.009980
XPTUSD : Platinum ( XPTUSD , PL1! ) Average error : 0.009964
XU030 : Borsa Istanbul 30 Futures ( XU030 , XU030D1! ) Average error : 0.010727
VIX : S & P 500 Volatility Index (VX1! , VIX ) Average error : 0.009999
ES : S&P 500 E-Mini Futures ( ES1! ) Average error : 0.010709
SSE : Shangai Stock Exchange Composite (Index ) ( 000001 ) Average error : 0.011287
XRPUSD : Ripple (XRPUSD , XRPUSDT ) Average error : 0.009803
Extras :
- Crossover and crossunder alerts
- Switchable barcolor
NOTE :
Australian Dollar / US Dollar (AUDUSD ) removed due to high average error. (Average error > 0.013 )
Timeframe advice :
I suggest you to use that system TF >= 1D
My favorite is 1 week bars. (1W)
Info about forecast series :
www.sciencedirect.com
Special thanks :
Special thanks to dear wroclai for his great effort .

BitMex Liquidation & Bankruptcy PlotsThis script was created for the Bull Bear Bots community to help users manage their risk with respect to avoiding the dreaded liquidation emails from BitMex.
Colour legend:
Dark Green - Liquidation point for Longs
Light Green - Bankruptcy point for Longs
Dark Red - Liquidation point for Shorts
Light Red - Bankruptcy point for Shorts
Disclaimer:
As BitMex do not publish the exact calculations for liquidation, this should be used as an approximation only as the results are slightly offset to what the official calculator provides. This issue is not unique to this script and if you cross-check all the other online calculators with the official one, you will find the same issue.

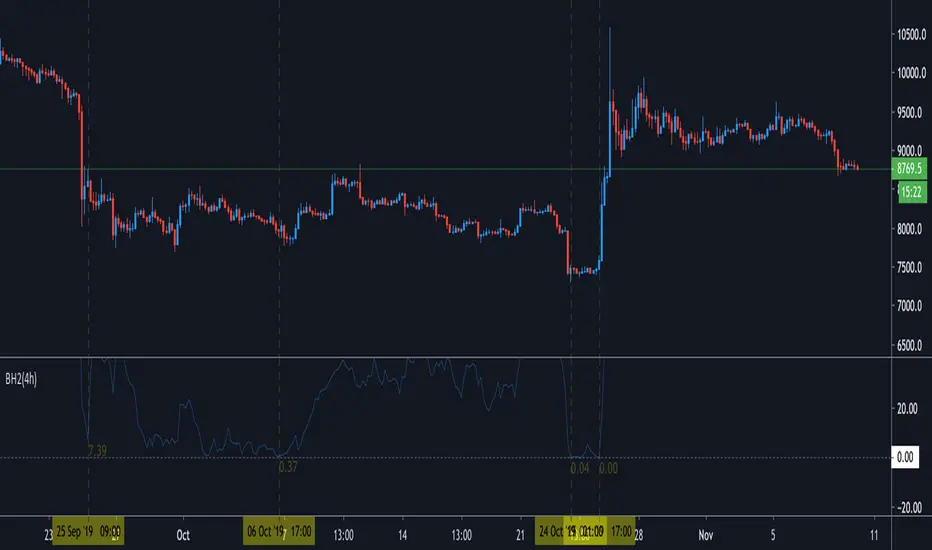
Bottom_hitter2I release the version 2 of Bottom_hitter ;)
This is very simple oscillator. If value become 0.00, it is "BOTTOM". Just is.
Everybody can use ;)
If you can get this script, send 0.01btc to below address and contact to me.
I give you authority to add to your chart as a indicator.
3BMEXqnbLx1j5kn6XGH15fs42YAus5HGDL
BITMEX:XBTUSD
ANN MACD : 25 IN 1 SCRIPTIn this script, I tried to fit deep learning series to 1 command system up to the maximum point.
After selecting the ticker, select the instrument from the menu and the system will automatically turn on the appropriate ann system.
Listed instruments with alternative tickers and error rates:
WTI : West Texas Intermediate (WTICOUSD , USOIL , CL1! ) Average error : 0.007593
BRENT : Brent Crude Oil (BCOUSD , UKOIL , BB1! ) Average error : 0.006591
GOLD : XAUUSD , GOLD , GC1! Average error : 0.012767
SP500 : S&P 500 Index (SPX500USD , SP1!) Average error : 0.011650
EURUSD : Eurodollar (EURUSD , 6E1! , FCEU1!) Average error : 0.005500
ETHUSD : Ethereum (ETHUSD , ETHUSDT ) Average error : 0.009378
BTCUSD : Bitcoin (BTCUSD , BTCUSDT , XBTUSD , BTC1!) Average error : 0.01050
GBPUSD : British Pound (GBPUSD,6B1! , GBP1!) Average error : 0.009999
USDJPY : US Dollar / Japanese Yen (USDJPY , FCUY1!) Average error : 0.009198
USDCHF : US Dollar / Swiss Franc (USDCHF , FCUF1! ) Average error : 0.009999
USDCAD : Us Dollar / Canadian Dollar (USDCAD) Average error : 0.012162
SOYBNUSD : Soybean (SOYBNUSD , ZS1!) Average error : 0.010000
CORNUSD : Corn (ZC1! ) Average error : 0.007574
NATGASUSD : Natural Gas (NATGASUSD , NG1!) Average error : 0.010000
SUGARUSD : Sugar (SUGARUSD , SB1! ) Average error : 0.011081
WHEATUSD : Wheat (WHEATUSD , ZW1!) Average error : 0.009980
XPTUSD : Platinum (XPTUSD , PL1! ) Average error : 0.009964
XU030 : Borsa Istanbul 30 Futures ( XU030 , XU030D1! ) Average error : 0.010727
VIX : S & P 500 Volatility Index (VX1! , VIX ) Average error : 0.009999
YM : E - Mini Dow Futures (YM1! ) Average error : 0.010819
ES : S&P 500 E-Mini Futures (ES1! ) Average error : 0.010709
GAZP : Gazprom Futures (GAZP , GZ1! ) Average error : 0.008442
SSE : Shangai Stock Exchange Composite (Index ) ( 000001 ) Average error : 0.011287
XRPUSD : Ripple (XRPUSD , XRPUSDT ) Average error : 0.009803
Note 1 : Australian Dollar (AUDUSD , AUD1! , FCAU1! ) : Instrument has been removed because it has an average error rate of over 0.13.
The average error rate is 0.1850.
I didn't delete it from the menu just because there was so much request,
You can use.
Note 2 : Friends have too many requests, it took me a week in total and 1 other script that I'll share in 2 days.
Reaching these error rates is a very difficult task, and when I keep at a low learning rate, they are trained for a very long time.
If I don't see the error rate at an average low, I increase the layers and go back into a longer process.
It takes me 45 minutes per instrument to command artificial neural networks, so I'll release one more open source, and then we'll be laying 70-80 percent of the world trade volume with artificial neural networks.
Note 3 :
I would like to thank wroclai for helping me with this script.
This script is subject to MIT License on behalf of both of us.
You can review my original idea scripts from my Github page.
You can use it free but if you are going to modify it, just quote this script .
I hope it will help everyone, after 1-2 days I will share another ann script that I think is of the same importance as this, stay tuned.
Regards , Noldo .

Volume ComparisonThis script shows the volume of the current chart relative to the volume of another selected ticker.
For meaningful information you should compare coins with the same base pair (for example BTCUSD against LTCUSD).
Volume bars will be plotted green if the other security's volume is higher, red otherwise.
You may use this script go generate alerts and automate your trading with a bot such as WolfBot.org
