Tenkan Kijun Cross AlertTenkan Kijun cross alert, best used alongside a Volume indicator to help aid with finding those trend continuation patterns.
I prefer to use the Chaikin Money Flow, when it indicates and holds above the 0 line then you will bias Longs, and when below then you will Bias shorts
If you like this then please donate
BTC: 1LRbUgrkvFLQ5Mt7C62EJRD9aMvhDNT22K
ETH: 0xa509b89bccb788234278eFE63470c10946E26F3c
LTC: LV7MUr6arvCffS5N6pbTWgav5S3Yi1Eejp
Criptovalute

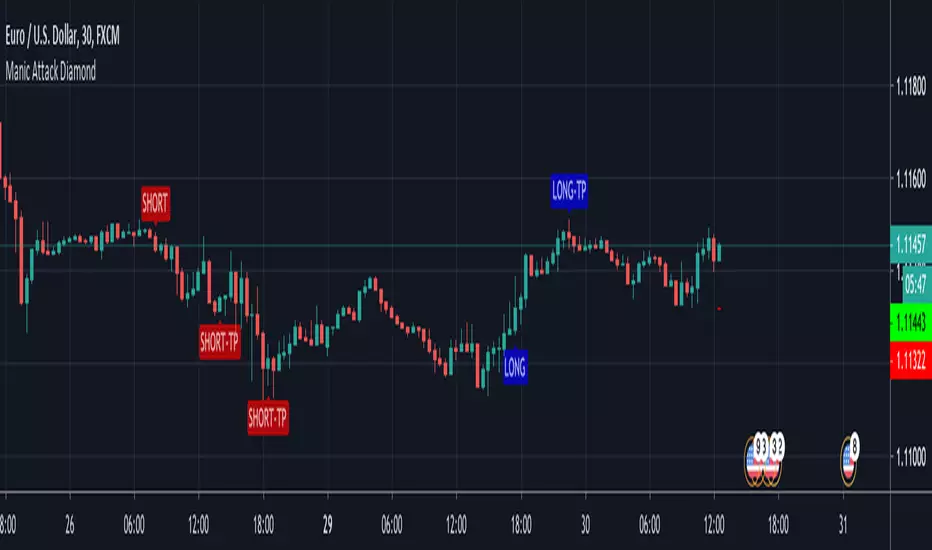
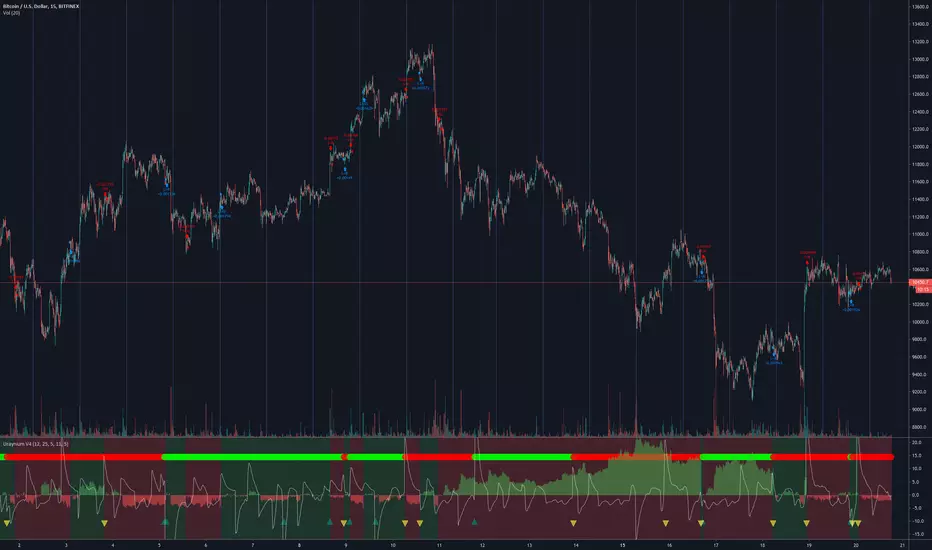
Eunsa Bit_Teaching - pub> 매매 진행중에, 간헐적으로 도움을 받아 볼 수 있는 보조지표입니다
> 절대적인 지표가 아니며, 말 그대로 보조적으로 해당 시장상황에 맞춰 참조, 참고가 가능한 지표입니다
* 매수Position은 총 2차 분할매수로 이루어집니다
> Long (-) : 매수 Signal (1차 분할 매수진입) > Long(-) 1차 분할매수 진입이후, 재차 뜬다면 재진입이 가능하다는 Signal
> Long (+) : 매수 Signal (2차 분할 매수진입) > Long(+) 2차 분할매수 진입 영역입니다
> 따라서, Long(-) 2 ~ 3번 뜬다고, 2 ~ 3번 계속 누적진입 하는 것이 아니라, Long(-) 에 1번 진입입니다, 진입했는데 또 뜬다면 재진입이 가능하다고 인식하시면 됩니다
* 매도Position은 총 2차 분할매도로 이루어집니다
> Short (-) : 매도 Signal (1차 분할 매도진입) > Short(-) 1차 분할매도 진입이후, 재차 뜬다면 재진입이 가능하다는 Signal
> SHort (+) : 매도 Signal (2차 분할 매도진입) > Short(+) 2차 분할매도 진입 영역입니다
> 따라서, Short(-) 2 ~ 3번 뜬다고, 2 ~ 3번 계속 누적진입 하는 것이 아니라, Short(-) 에 1번 진입입니다, 진입했는데 또 뜬다면 재진입이 가능하다고 인식하시면 됩니다
> Long Danger : 급격한 매도세 감지
> Short Danger : 급격한 매수세 감지
(* Long Danger 가 뜬경우, 과매도권이라 보통의 경우 해당 시점부터 반등이 진행되는 경우가 많으며, Bear Trap일 경우가 많습니다. 그러나, 저같은 경우 안전하게 Long Danger시 Long Position에 대한 손절을 진행하며, 손절Sign 으로 인식합니다)
(* Short Danger 가 뜬경우, 과매수권이라 보통의 경우 해당 시점부터 조정이 진행되는 경우가 많으며, Bull Trap일 경우가 많습니다. 그러나, 저같은 경우 안전하게 Short Danger시 Short Position에 대한 손절을 진행하며, 손절Sign으로 인식합니다)
> Long 진입자를 위해, Long TP가 제공되오나 익절은 자유에 맡기고 있습니다
> Short 진입자를 위해, Short TP가 제공되오나 익절은 자유에 맡기고 있습니다
> TP에 꼭 익절하신다는 느낌보다 보조적으로 보시는게 좋습니다
* 가장 중요 *
> Long Term (장기추세) : Long Trend or Short Trend 표기
> Short Term (단기추세) : Long Trend or Short Trend 표기
> 장기추세와 단기추세가, 실시간으로 즉각 차트에 표기가 되어집니다
> 해당 경우를 응용하여 사용하는 경우에 대해서 예시를 보겠습니다
예시1)
- Long Term : Long / Short Term : Long => 장기추세와 단기추세가 모두 Long일 경우, 장기/단기추세가 상승추세를 의미합니다
- 예시1의 상황이 발생할 경우, 추세트레이딩을 하신다면 Short Signal이 나와도 Short 진입에 대해서 고려하지 않습니다
- 예시1의 상황이 발생할 경우, 추세트레이딩으로써 Long 진입에 대해서만 집중합니다
- 예시1의 상황이 발생할 경우, 역추세트레이딩을 하신다면 Short Signal이 나올 시, 진입하여 짧게 먹고 나옵니다
- 역추세트레이딩은 길게 가져 가는것이 결코 아닙니다
예시2)
- Long Term : Short / Short Term : Short => 장기추세와 단기추세가 모두 Short일 경우, 장기/단기추세가 하락추세를 의미합니다
- 예시2의 상황이 발생할 경우, 추세트레이딩을 하신다면 Long Signal이 나와도 Long 진입에 대해서 고려하지 않습니다
- 예시2의 상황이 발생할 경우, 추세트레이딩으로써 Short 진입에 대해서만 집중합니다
- 예시2의 상황이 발생할 경우, 역추세트레이딩을 하신다면 Long Signal이 나올 시, 진입하여 짧게 먹고 나옵니다
- 역추세트레이딩은 길게 가져 가는것이 결코 아닙니다
예시3)
- Long Term : Long / Short Term : Short
=> 장기추세와 단기추세가, 엇갈린 순간
=> 시장의 굉장한 급격한 변동과 추세돌파 및 이탈시점을 의미하며, 이경우 장기추세와 단기추세가 서로 엇갈림을 의미함
=> 해당 경우가 발생할 경우, '추세의 모호함'이라 칭하며, 장세의 방향이 어느곳으로 튈 지 추세가 정확히 잡히지 않은 상황을 의미함
=> 보수적, 안정적으로 트레이딩을 하신다면, '추세의 모호함'이 발생할 경우 매매진입은 고려하지않으며, 관망합니다
예시4)
- Long Term : Short / Short Term : Long
=> 예시3) 과 같습니다
*** 가장 중요 한 것 ***
> 해당 지표는, 말 그대로 보조지표 입니다
> 수익에 대해서 보장 하지 않으며, 손실이 날 수 있습니다
> 오히려, '손절' 에 대한 'Danger' 경고 표시를 함으로써, 해당 지표를 참조, 참고 함으로써 '수익극대화'보다는 '손실최소화'에 중점을 맞추고 있습니다
> 진입에 대한 Risk/Reward (손익비)가 최소 1:1 ~ 1:2 비율로 잡혀지게끔, 알고리즘이 짜여있습니다
> '손절'에 대한 경고를 표시함으로써, 승률 100%를 목표로 하는게 아니며, 승률 51~55% 정도를 겨냥하여 최대한 안정적 보수적인 '손실최소화' 중점의 지표입니다

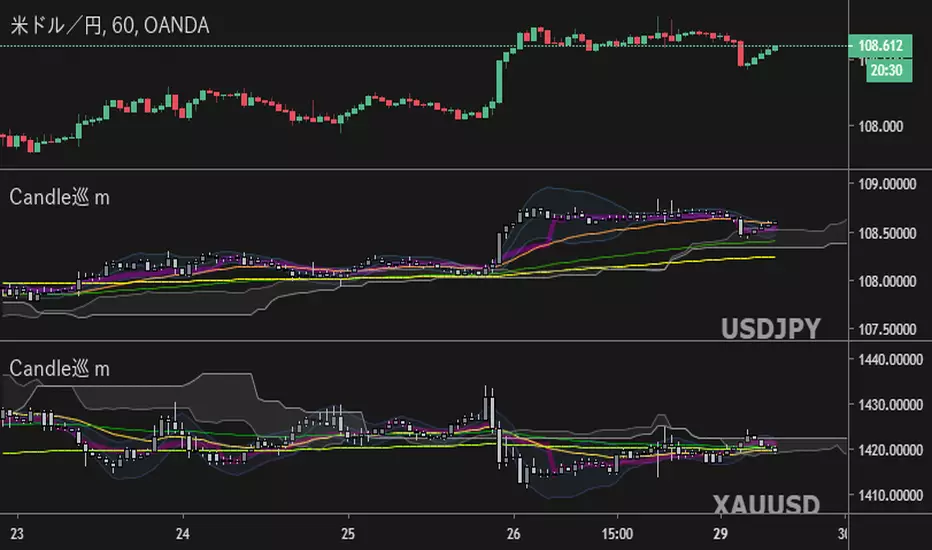
Candles [Meguru] MobileMulti-currency Indication For mobile "Candles[Meguru]Mobile"
The display of exchanges and major currencies has been made selective. (I thought about the use with a smartphone etc. and made it possible to omit the trouble of character input. It is also possible to enter manually.)
モバイル向け多通貨表示インジ『Candles[Meguru]Mobile』
取引所やメジャーな通貨の表示を選択式にしました。(移動時・スマホなどでの利用を考え、文字入力の手間を省略できるよう作成しました。手入力での設定も利用できます。)
反転チャート・時足の固定も可能です。
複数表示することで、多通貨を同時に表示・監視することもできます。
詳細、購入などはこちらにて
note.mu
Various Volume RSI (UNLIMITED)RSI displaying multiple currencies together (arbitrary input version)
forex or cryptcurrencies...economic index or metal or energy...and more...
複数の通貨をまとめて表示するRSIです。(任意入力版)
外国為替や暗号通貨...経済指数・金属・エネルギー...その他を表示できます。
同時に多通貨を監視することで見えてくるものがあります。
詳細、購入などはこちらにて
note.mu

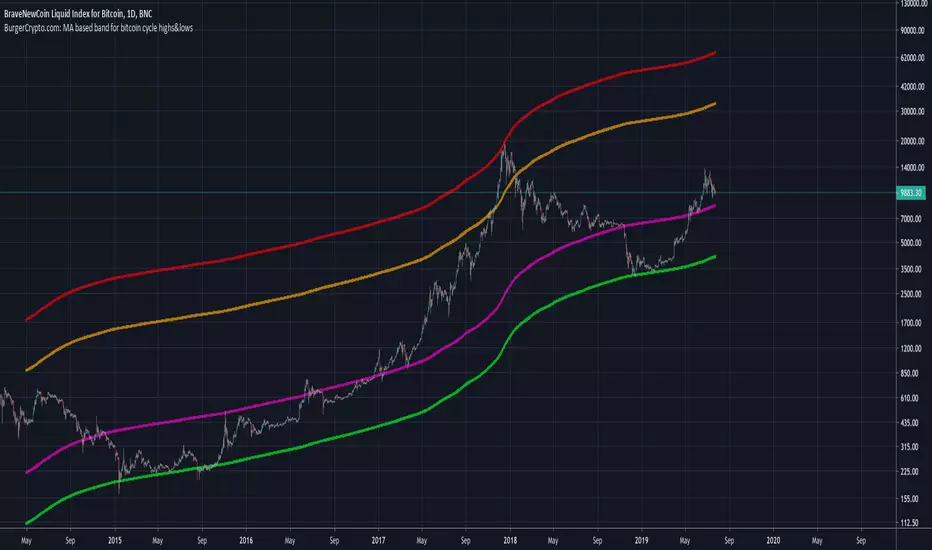
BurgerCrypto.com: MA based band for bitcoin cycle highs&lowsWarning: This script works only on a daily chart and only works for bitcoin charts with a long history. Best to be used on the BLX chart as it goes back to July 2010.
This script shows you the Moving Average with the length of a full bitcoin cycle, in which a cycle is defined as a period between two reward halvings; i.e. 210.000 blocks.
After data analysis in Python, I found that the average inter arrival time is a bit lower than the often communicated 10minutes; it's 9.46minutes, which makes the 210.000 block interval equal to 1379days.
The 1379d Moving Average seems to serve well as a support for the price of bitcoin over time and it's 4th 2^n multiple did a good job in catching the cycle tops.
If you like this indicator, please leave some claps for the Medium article in which I introduced this indicator:
medium.com
BitMEX Funding Visual by Mcrypt28This is a modified script originating from user m59 that better visually represents the BitMEX funding trend over time. Green indicates the funding is positive (longs pay shorts every 8 hours to maintain their position) and red indicates the funding is negative (shorts pay longs). The darker the color means the higher the rate. The unproven theory is that the funding helps to identify what retail investors are doing at a given time. Thus, in downtrends as the negative funding is drying up, a low may be near. In uptrends, as the funding remains negative, retail is generally bearish and continues to sell as institutional investors likely are absorbing. Vice versa for when the funding is positive. In any market in general, money flows from the many to the few. That means whatever retail is doing is generally the opposite of what will be the actual outcome. One more modifier to the m59 script is that volume is factored into the calculation which will impact which threshold (opacity on the chart) it falls within.
If you'd like to chart the BitMEX funding yourself, I'd recommend checking out the source from m59's indicator as that is more likely to stay up to date if BitMEX makes any changes to the way funding is calculated. The source if this is protected for that reason.

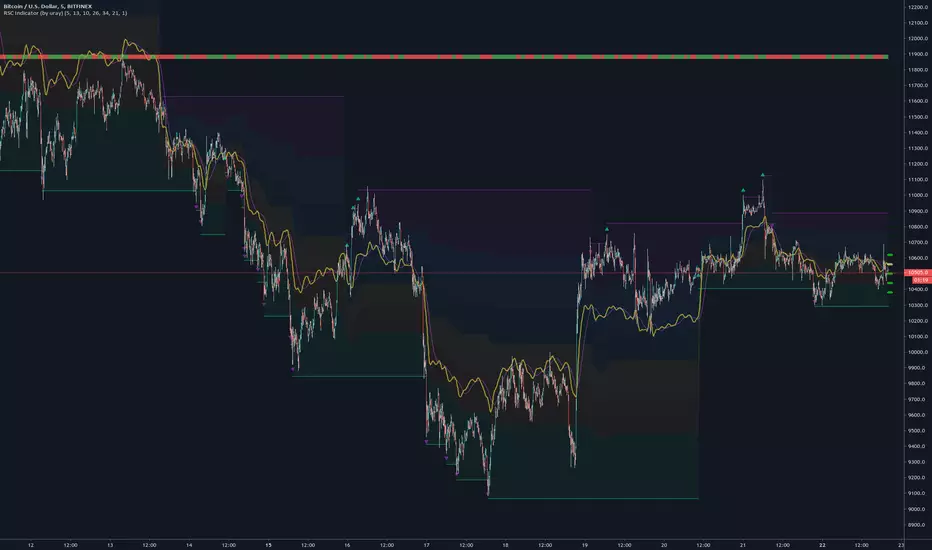
Crypto Fund indicatorThis indicator is just a slight modified version of the godmode indicator developed by xSilas.
It helps to spot and extreme building selling or buying pressure.
I use it mainly for BTC on the 1h chart but can do the job on other crypto-assets and timeframes such as 5min, 30min etc.

[astropark] 21 days EMAAre you tired to edit you EMA indicator to fit the 21-day settings for your timeframe?
Now you have it for free!
Enjoy!

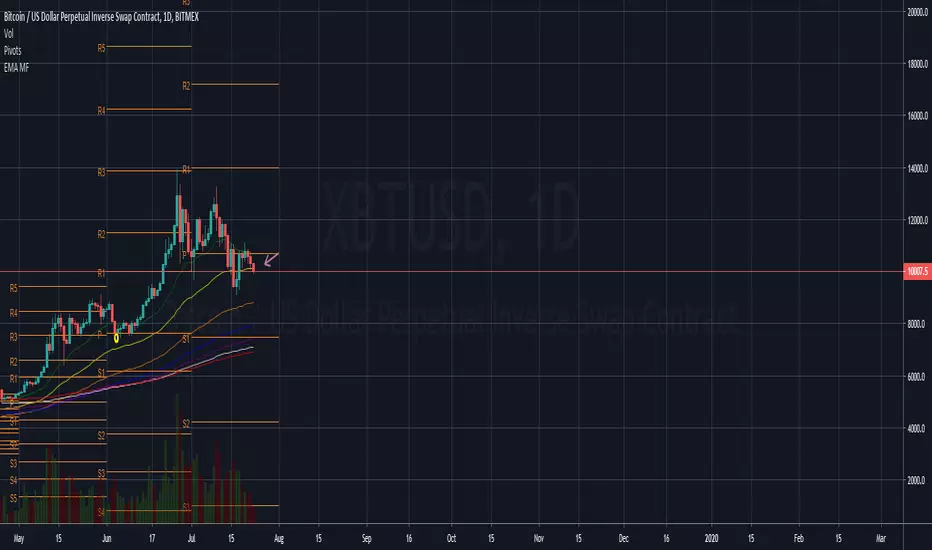
EMA MF - EMA (21,50,100,200,250,300)Hey guys
a simple script for some EMA's at one indicator
For signals news TA and more join BitcoinMF
Links are at the TV profile
--
This is not financial advice
DYOR
Trade Safe and Good Luck
PpSIgnal Quantile Band 3.0We made a multi indicator using the Quantile Band, the Rsi qqe, bollinguer band 10.1 and a sma 34 price per half.
Quentile band: In statistics and the theory of probability, quantiles are cutpoints dividing the range of a probability distribution into contiguous intervals with equal probabilities, or dividing the observations in a sample in the same way.
Quantitative Qualitative Estimation, is based on a rather complex calculation of the smoothed RSI indicators.
The QQE indicator consists of a smoothed Relative Strength Index (RSI) indicator and two volatility-based trailing levels (fast and slow). The Fast Trailing Level (TL) and Slow TL are constructed by calculating the ATR of the smoothed RSI over n-periods and then further smoothing the ATR using an additional n-periods Wilders smoothing function. This smoothed ATR of RSI is then multiplied by the Fast and Slow ATR Multipliers to calculate the final Fast and Slow Trailing Levels.
Bollinger band 13. 1: is the bb with 13 period and deviation 1, we can find the volatile when the price is above or below of the bb band.
the best enter
Buy: price above of quintile band 50, sma 35 and bollinger band.
Sell: invest of the buy signal.

Pump|Dump Tickerthis is just a study to investigate the pumps and dumps that have been happened in a crypto market and it should not be used as an indicator. this is also my very first Pine Script that I've written and I am sure it is not perfect. actually I am curious to know when (I mean the exact time of the day) most pumps and dumps happen as a self investigation. the method that is used to define pumps and dumps is not good (and I know that) but I will modify it for better result in next version.
to use this study, you should define whether you want to display pumps or dumps or both and also you should define percent of change (threshold).

Ppsignal GSV V1Entry pattern GSV (Greatest Swing Value)
We return with another Larry Williams pattern, the Greatest Swing Value or GSV, in principle this pattern was developed for the S & P 500, but it could be extrapolated to other markets, as with the previous pattern we will only explain it for long positions. First of all we have calculated the difference between the maximum and the opening of the last 4 bars and its average, that is to say: /4. Being H the maximum of each bar and the O the opening price of each bar. From this average we will extract 180%, that is, we will multiply it by 1.8. The value of this result will be the GSV.
The logic of this GSV entry pattern is as follows: a widely used way to enter the markets is the breaking of highs, but many times false breakdowns occur or what Larry Williams calls "failure swings", to avoid these false ruptures Larry invented the GSV, which is like a moving average applied to the Swing Value (the difference between the maximum and the opening price).
Once we have the GSV we must add it to the opening price of the current bar and the entry will occur when the price exceeds this level.
to determine the entrance we use bollinguer band and atr. In this way we enter the pattern with volatility.
Patrón de entrada GSV (Greatest Swing Value)
Para esta tecnica usamos la volatilidad para determinar entradas, bollinguer band 13.1 y atr...
Volvemos con otro patrón de Larry Williams, el Greatest Swing Value o GSV, en principio estepatrón fue desarrollado para el S&P 500, pero se podría extrapolar a otros mercados, al igual que con el patrón anterior solamente lo explicaremos para posiciones largas. Primero de todo hemos calculado la diferencia entre el máximo y la apertura de las 4 últimas barras y hacersu media, es decir: /4. Siendo H el máximo de cada barra y la O el precio de apertura de cada barra. De esta media sacaremos el 180%, es decir, lo multiplicaremos por 1.8. El valor de este resultado será el GSV.
La lógica de este patrón de entrada GSV es la siguiente: una forma bastante usada para entraren los mercados es la ruptura de máximos, pero muchas veces se producen rupturas falsas o loque Larry Williams llama "failure swings", para evitar estas rupturas falsas Larry inventó el GSV,que es como una media móvil aplicada al Swing Value (la diferencia entre el máximo y el preciode apertura).
Una vez tenemos el GSV deberemos sumárselo al precio de apertura de la barra actual y la entrada se producirá cuando el precio supere este nivel.
para determinar la entrada usamos bollinguer band y atr. des esta manera entramos al patron con volatilidad.

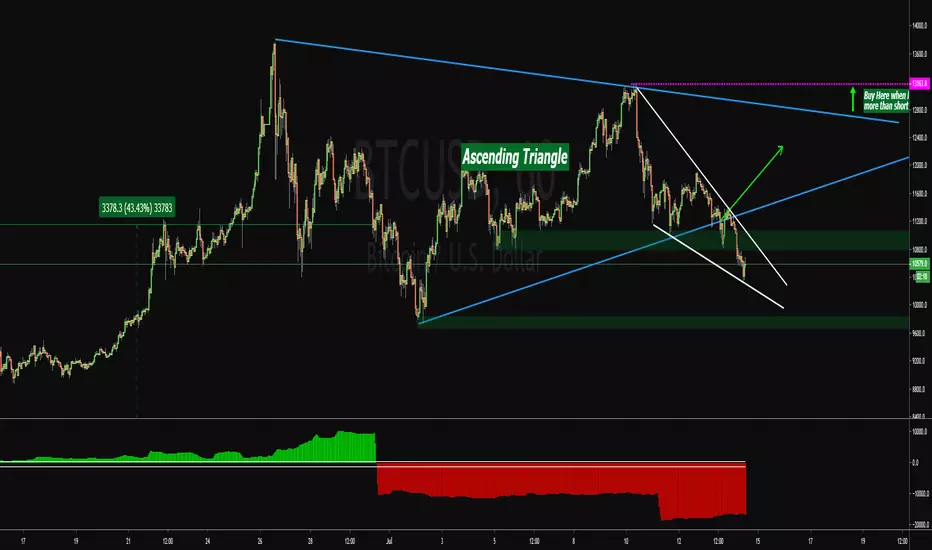
PpSignal LONG SHORT BTC SIGNALanalyzing the open buy or sell positions, we have developed an indicator that avoids falling into trading traps
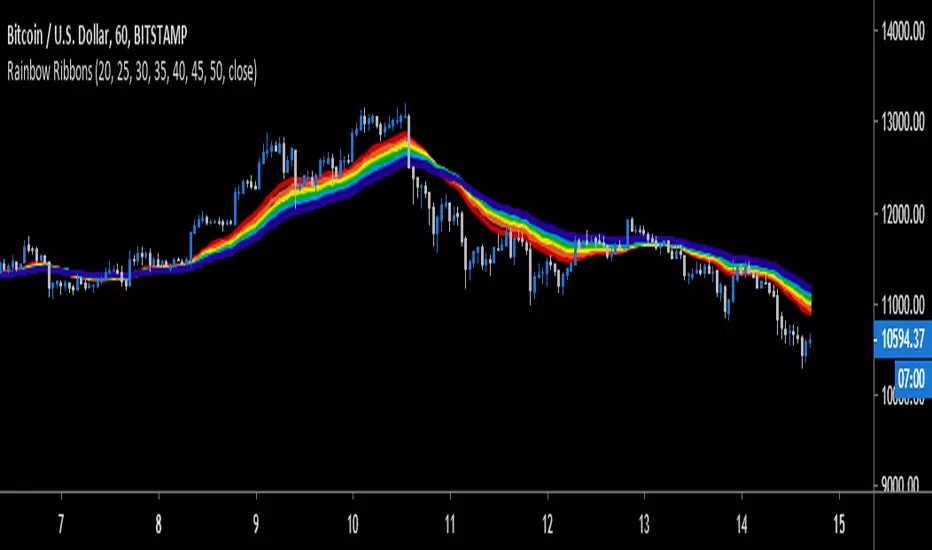
QuantCat Rainbow RibbonQuantCat Rainbow Ribbon
The Rainbow Ribbon is a conglomerate of exponential moving averages of increasing time period plotted on a graph. The ribbon is used to help identify the strength of a trend while also helping spot timely market reversals.
It consists of a 20, 25, 30, 35, 40, 45, and 50 EMA which are interchangeable values for your preference.
Generally in bullish conditions, the price action will be trading on top of the ribbon with the top EMA’s in the ribbon acting as support. In bearish conditions, the price action will be trading underneath the ribbon with the bottom EMA’s acting as resistance.
As shown in the chart above, when the candles penetrate the Rainbow Ribbon and the EMA’s start to converge/cross, market reversal probabilities increase. With this information we can take trades or add to the general consensus of a potential trade.
Be sure to follow us so you're kept up with our projects and any updates to the script!
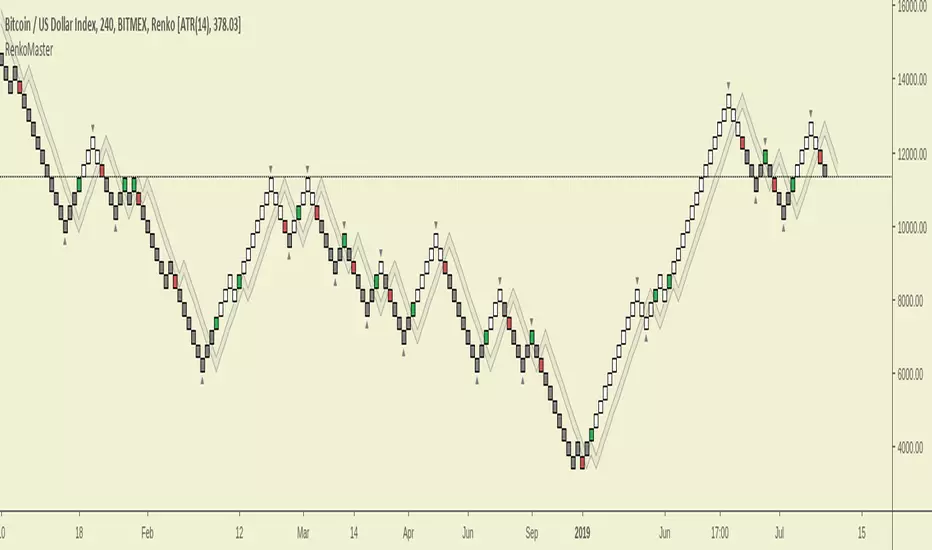
RenkoMasterRenkoMaster is a variant of our popular TrendMaster Script with adjusted parameters. It can be used to provide confluence when determining Renko entries and exits.
Setting Up The Indicator
After purchase, open the TradingView indicator library. Under the Invite-Only Scripts section, you will see RenkoMaster. Add it to your chart. Next, you must customise your theme settings to allow RenkoMaster to take over control of your candle colours. You can find a complete set-up tutorial on our website.
Candle Colours
By default, RenkoMaster will colour your candles in black and white. White candles indicate an uptrend in an asset and the candles will not change colour until the trend has reversed and a counter-trend signal has been printed. Black candles indicate a downtrend, they will remain black until a counter-trend long signal candle has been printed.
Signal candles
A signal candle is printed when the price of an asset closes above or below the moving average cloud and the medium term trend moving average. By requiring two criteria for a single candle to print we will see a drastic reduction in the number of false signals.
The RenkoMaster entry technique further reduces the likelihood of false entries. To enter a trade we do not buy the signal block immediately. Instead, we treat the signal block as an indication that a trend change is possible. We want to see confirmation of this trend before making an entry. To enter we place a pending order a few ticks above or below the high or low of the signal block. By doing this we only enter a trade when the asset has shown a continuation in the direction of the suggested trend change.
Our Story
Founded in 2018 by IchimokuScholar and C00kie, TrendMaster is a team that produces technical analysis indicators with an emphasis on simplicity and noise reduction. We support a large community with educational content, automated market scanners and mentoring in our private chat rooms. We produce technical analysis indicators geared primarily towards the emerging Cryptocurrency asset class. We provide educational material to assist trader development and host a large online trend following community. All of our products are designed to help traders distinguish relevant information from background noise. Our indicators encourage disciplined trade management to maximise the opportunity captured while minimising losses.
IchimokuScholar
IchimokuScholar – In 2017 I retired from a career in higher education to focus on Trading. I like to trade long term trends, focusing primarily on continuation setups. I am dedicated to sharing my knowledge of trading and take great pleasure in simplifying technical analysis for newer traders.
C00kie
I started trading crypto in 2017 and immediately started coding a bunch of tools to improve my quality of life. Some definitely worked out better than others. Like to trade the higher timeframes and drawing horizontal lines on charts. I am also pretty much obligated to like cookies.
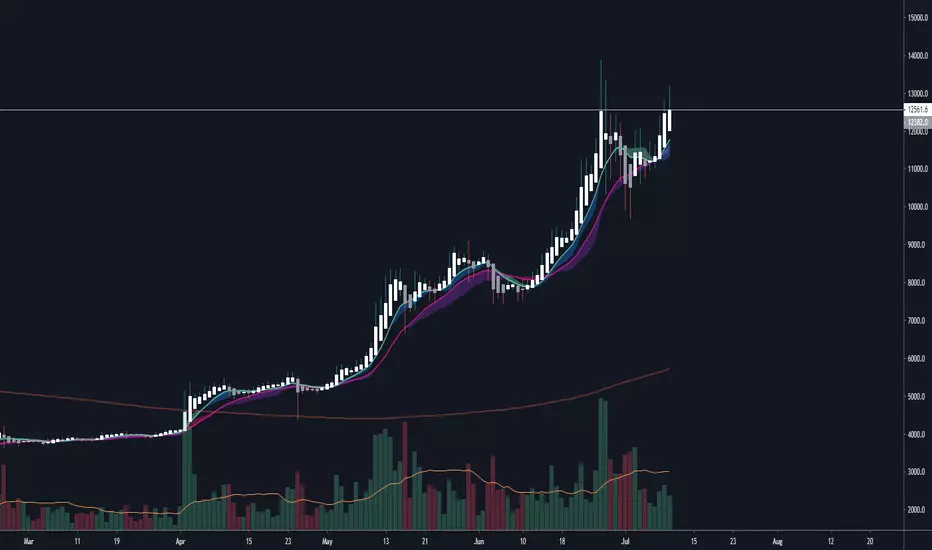
kiska clouds backtest editionkiska clouds: crypto twitter's next cloud meme
Crypto is a fast-paced, highly-volatile asset, therefore, many traditional strategies are thrown out of the window when applied to cryptocurrency markets. In trading, there are only two things known for sure: price and volume . Price and volume data is then manipulated using various math equations in an effort to discover patterns and/or make predictions. kiska clouds are no different.
The kiska clouds are a simple crossover strategy. The clouds are different because of the unique averages being used and the embedded momentum indicator .
To use the clouds is simple:
When the green line crosses above the pink line, you buy/long.
When the green line crosses below the pink line, you sell/short.
The clouds are indicative of the trend's momentum. Using the power of math, the larger the cloud indicates a higher amount of buying/selling pressure. As the cloud thins, momentum is slowing, and the trend may be reversing.
At the time of testing, the strategy had a profitability of 54.55% accuracy with 1133.41% net profit. While I think this could be automated into a bot, adding a human element with stop losses and further analysis will significantly improve the accuracy/profitability.
This indicator is the backtest version of the kiska clouds (). For a trial or to purchase this indicator, send me a message on Twitter @moonkiska or here on TradingView. You will be granted a 2-3 day trial period to the backtesting strategy.

kiska cloudskiska clouds: crypto twitter's next cloud meme
Crypto is a fast-paced, highly-volatile asset, therefore, many traditional strategies are thrown out of the window when applied to cryptocurrency markets. In trading, there are only two things known for sure: price and volume. Price and volume data is then manipulated using various math equations in an effort to discover patterns and/or make predictions. kiska clouds are no different.
The kiska clouds are a simple crossover strategy. The clouds are different because of the unique averages being used and the embedded momentum indicator.
To use the clouds is simple:
When the green line crosses above the pink line, you buy/long.
When the green line crosses below the pink line, you sell/short.
The clouds are indicative of the trend's momentum. Using the power of math, the larger the cloud indicates a higher amount of buying/selling pressure. As the cloud thins, momentum is slowing, and the trend may be reversing.
At the time of testing, the strategy had a profitability of 54.55% accuracy with 1133.41% net profit. While I think this could be automated into a bot, adding a human element with stop losses and further analysis will significantly improve the accuracy/profitability.
This indicator is a "Pay What You Want" model. For a trial or to purchase this indicator, send me a message on Twitter @moonkiska or here on TradingView. You will be granted a 2-3 day trial period to the backtesting strategy.
Tips:
The higher the time frame, the more accurate the strategy.
Personally, I do not short above the 200MA. I do not long below the 200MA.
Coming Soon:
Support/Resistance
Trend Lines
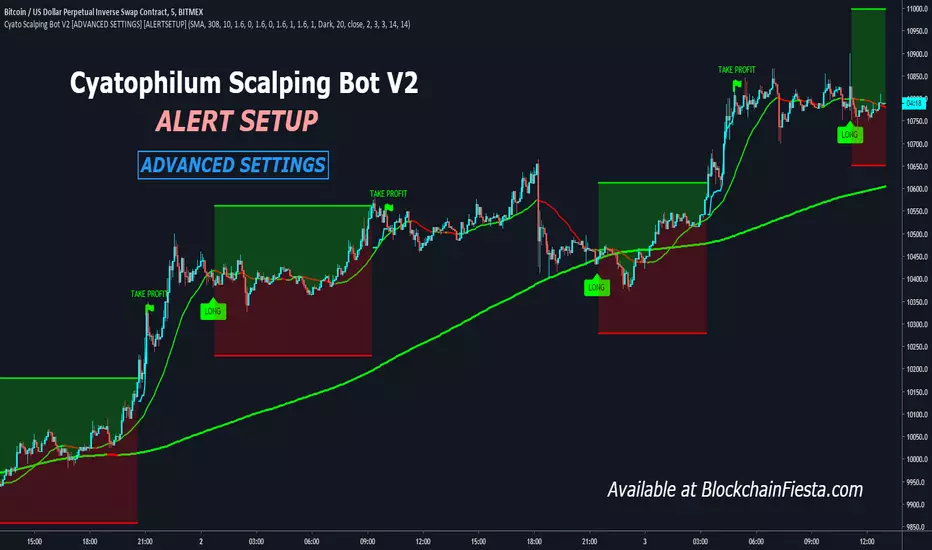
Cyatophilum Scalping Bot V2 [ADVANCED SETTINGS] [ALERTSETUP]Advanced Settings version of Cyatophilum Scalping Bot V2
For people who like tweaking settings =)
Cyatophilum Scalping Bot V2 [ADVANCED SETTINGS] [BACKTEST]Advanced Settings version of Cyatophilum Scalping Bot V2
For people who like tweaking settings =)

Quintalytics TrailingStop MultiTimeQuintalytics TrailingStop MultiTime is a combination of a Trend, Sideways/Chop Detection, and Trailing Stop Loss indicator.
This indicator is suitable for use in all timeframes and markets.
The Multiple time Frame function allows for the TrailingStop to be Calculated from another timeframe and shown in the current chart.
For Example:
4 Hour TrailingStop line on a 60 Minute Chart
Daily TrailingStop line on a 4 Hour Chart
15 Minute TrailingStop line on a 5 Minute Chart
COLORS
The Color GREEN indicates the presence of a Bullish Trend.
The Color RED indicates the presence of a Bearish Trend.
The Color YELLOW indicates that the market is Sideways a.k.a. Flat a.k.a. Choppy.
You have the option of COLORING the BAR to match the current TrailingStop color.
You have the option of applying a Smoothing to the TrailingStop line.
You have the option of showing a Standard Deviation Band based on the TrailingStop line.
SETTINGS
The indicator has seven parameters:
1. Lookback - # of previous bars used to calculate the trailing stop
2. Std Dev Lookback - # of previous bars used to calculate the Standard Deviation
3. Std Dev X – Multiplier of Std dev. i.e. 2 = 2x Std Dev of the TrailingStop line
4. Color Bar? – toggle Coloring of the Candlestick/Bars on the chart
5. Show Std Dev? – toggle showing the Std Dev bands.
6. Smooth? – toggle Smoothing the TrailingStop line
7. Timeframe - Select the time frame used to calculate the TrailingStop (1 Hour, 4 Hours, 1 Day, 1 Week, etc.)
Changing these settings individually or in combination will yield varying results.
2 Alerts are provided with the indicator: CLOSE OVER STOP line and CLOSE UNDER STOP line
