PpSignal Haiken Ashihere is the development of ppsignal Heiken Ashi with a formula of ours.
It also has a Smooth move average.
When HA this green is buying, when red is selling... simple entry system for scalping.
Enjoy it
Criptovalute

Profit MAX MTF HeatMapThis is a powerfull strategy which is made from combining 3 multi timeframes into one for profit max indicator
In this case we have daily, weekly and montly.
Our long conditions are the next ones :
if we have an uptrend on all 3 at the same time, we go long.
If we have a downtrend on all 3 of them at the same time we go short.
For exit, for long, as soon as one of the 3 converts into downtrend we exit the trade.
For exit, for short, as soon as one of the 3 converts into uptrend we exit the trade.
This tool can be used on all types of markets, and can also be changed the time frames.

MACD With Trend Filter: Visual Backtest Module TemplateSample Strategy: MACD Crossover with trend filter options
MA Filter : Price Close Above MA, Search for Buy, Price Close Below MA, Search for Sell
ADX Filter : Take trade only when ADX is above certain treshold
MACD Signal : MACD Cross above signal line while under 0 line indicate Buy Signal
MACD Cross below signal line while above 0 line indicate Sell Signal
-----------------------------
Using Alert Module:
Enable Alert --> Enable TV's alert and plot signal to chart
Alert Type --> Set to take Buy only, Sell only or Both alert
----------------------------
Using Backtest Module:
Enable Backtest --> Enable Backtest simulation
Backtest Type --> Set to take Buy only, Sell only or Both
SL Type -->
ATR : Set SL in ATR times Multiplier below/above entry price
Fixed : Set SL in fixed point below entry point (in 'Dollar'). e.g. for Stocks -> 0.5 equals to 50cent while for EURUSD currency -> 0.005 equal to 50 pips
HiLo Bar : Set SL at highest/lowest wick of previous bar plus/minus Fixed point. e.g. EURUSD HiLo=3 and Fixed Point = 0.0005, buy trade will place SL 5 Pips below lowest of previous 3 bar
SL ATR Period --> Set Lookback Period used for SL's ATR calculation
SL ATR Multi --> Set ATR Multiplier for SL
SL Fixed --> Set Fixed Level for SL (Use when SL Type is either Fixed or HiLo Bar)
SL Bar --> Set Number of previous bar to check for SL placement
TP RR Ratio --> Set TP based on RR multiplier. e.g. 2 means TP level will be twice further from entry point compared to Entry-SL distance.
Notes: The point is for preliminary testing, so it only supports 1 trade at a time and no Trailing Stop
----------------------------
Disclaimer:
This script main objective is to create my personal indicator template so that i just have to modify the indicator module for preliminary testing in future.
Testing Alert Module so i can re-use it as template in future study/indicator
Testing Visual Backtest Module so i can re-use it as template in future study/indicator
i believe using Strategy function is a better approach for this but the entry/exit level seems to be hit n miss (at least for me, still trying to figure what i did wrong)
also, i rather code the strategy in other platform where i can use the more accurate tick data if i want to validate backtest statistics.
My study scripts was built only to test/visualize an idea to see its viability and if it can be used to optimize existing strategy.
credit: ADX code are originally from "ADX and DI" by @BeikabuOyaji although i re-wrote so i can have cleaner read and use RMA instead of SMA

Escaping of Rate from Avarage By Mustafa OZVEREscaping of Rate from Average By Mustafa OZVER
This code shows a location of a rate or price (or etc.) from the average, rated by the standard deviation.
To show that, calculates the ema and standard deviation of our data then calculates the distance between ema and the current data by the standard deviation.
In summary, we can say that this value is the current distance by the long term standard deviation.
This value is between +1 and -1 because we expect the absolute value of the standard distance does not get far from the long term standard deviation.
For scalping, we can use this value as
buy signal when the value is below -1,
sell signal when the value is above +1,
But only this value can not guarantee good results for trading. BE CAREFUL

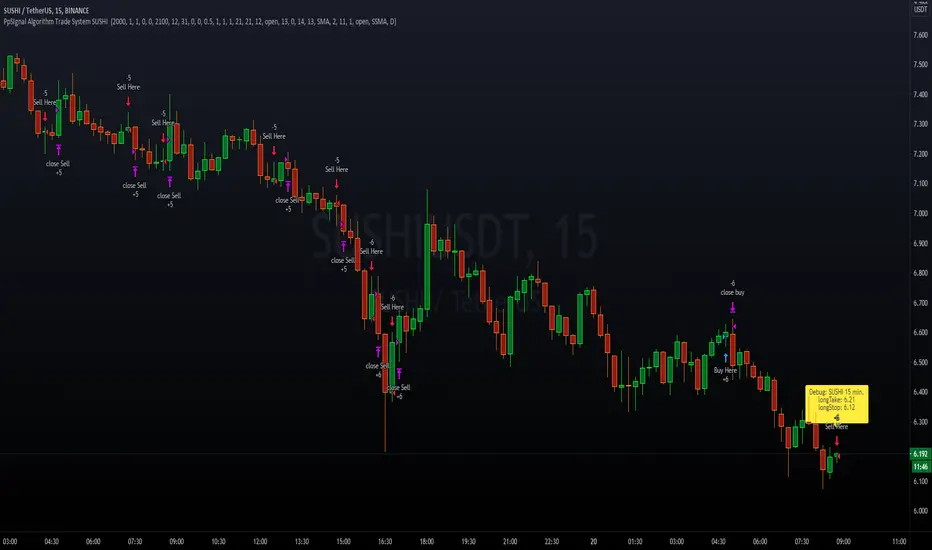
PpSIgnal Algorithm Trade System SUSHI Algorithm-based solely for trading SUSHI USDT.
Initial capital 50 USD, you buy the maximum of the capital since it represents little money at the beginning, you can risk less capital in percentage, for example, 10% of the 50 USD.
Commission 0.0045% per contract, we use the commission of one of the best-known brokers.
You can adjust the slippage you consider.
Date of time strategy
You can choose the start day and the end day of the backtesting test.
Money management
Take profit to buy 0.5%
Stop Lose sell 1%
Take Profit 1%
Stop Loss 1%
How it works?
The system works by looking for trends and volatility in a 15-minute time frame.
Once the system finds the trend and volatility, it opens an operation looking for a profit at the buy of 0.5% and loss control of 1%.
For Sell operations, it will seek a 1% profit with a 1% loss control.
You can find the profit you want
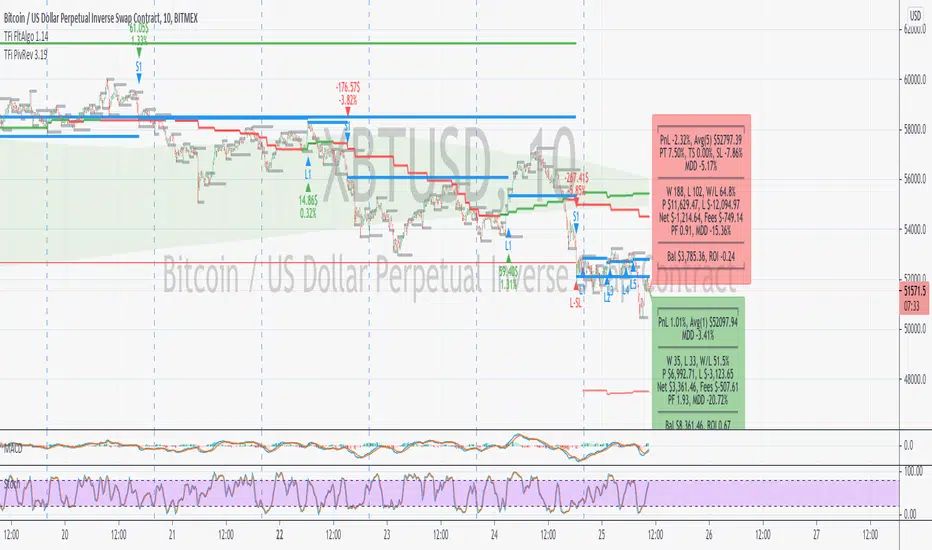
TFi Pivot Reversal V3The Pivot Reversal Study uses pivot points to create a support and resistance level; based on this levels the script creates virtual stop-market orders to catch the trend if the price is crossing the pivot lines.
A "Pyramiding" input allows to configure up to 3 entries; the script enters an additional position if the price falls by a configurable percentage amount (long), the reverse to short orders.
A configurable profit-target and stop-loss is being used to exit an open position.
An optional Moving Average filter can be used to enable only long or short positions.
The script renders a status box at the last bar, which shows the current position status and result of the built-in trading simulation results.
It shows the following statistic values:
current position PnL - also background turns green if position is in profit and red if in loss
the percentage distance to the profit-target and stop-loss level
the overall number of wins and losses and the win/loss ratio
the overall profit and loss amount (assuming a quantity of 1)
the net-profit and profit-ratio
For the correct simulation of entry/exit prices, the script contains inputs for a percentage entry and exit slippage.
The study also creates configurable alerts, which follow the exact position of the entry/exit markers. The default alert messages contain trading instruction to execute orders via Alertatron; but the message content can be replaced if configuring the alert in the Tradingview environment.
The script was mainly backtested with crypto-coins, e.g. XBTUSD at 15min timeframe. But the script also works with any other type of security and timeframe.
How to access
This strategy is a "Invite Only" script. You can can subscribe or purchase the strategy; please use the link below or send me a message via Tradingview to obtain access to the strategy and study script.
For enabling the script in your Tradingview chart window, click on "Indicators" and select "Invite-Only Scripts".
Full list of alerts
'Alertatron Exit' ... Exit all open positions.
'Alertatron Enter Long' ... Enter long position, w/o stop-loss being used.
'Alertatron Enter Short' ... Enter short position, w/o stop-loss being used.
'Alertatron Enter Long SL' ... Enter long position, w/ stop-loss being used.
'Alertatron Enter Short SL' ... Enter short position, w/ stop-loss being used.
Full list of parameters
"Pivot Left Bars" ... Number of bars on the left of the pivot point - used for pivot /peak detection.
"Pivot Right Bars" ... Number of bars on the right of the pivot point - used for pivot /peak detection.
"MA Filter Fast" ... Moving Average filter fast period.
"MA Filter Slow" ... Moving Average filter slow period.
"Profit Target Option" ... Configure the profit-target either as a fix percentage value or an ATR.
"Profit Target " ... Fix percentage profit-target.
"Profit ATR Period" ... ATR profit-target period.
"Profit ATR Factor" ... ATR profit-target factor/multiplier.
"Stop Loss Option" ... Configure the stop-loss either as a fix percentage value or disable the stop-loss completely.
"Stop Loss " ... Fix percentage stop-loss.
"Rebuy Loss " ... Percentage loss of the initial position before script enter a nw position in the same direction.
"Pyramiding" ... Maximum number of positions.
"Show MA Plots" ... Show/hide Moving average plots.
"Slippage Entry " ... Percentage slippage for entering a position.
"Slippage Exit " ... Percentage slippage for exiting a position.
"Statistic Label" ... Defines the position of the statistic label relatively to the last bar in the chart.
"Backtest Start" ... Backtest start time; area outside this timeframe will be grayed out.
"Backtest Stop" ... Backtest stop time; area outside this timeframe will be grayed out.
"Backtest Mode" ... Closes the currently opened position if chart switches to last bar; please only enable if backtesting, otherwise it leads to unwanted alerts.
Profits Unlimited Pro Strategy** This is the backtesting (strategy) version of ~ Profits Unlimited Pro ~ proprietary script in TradingView. **
~ Profits Unlimited Pro Strategy ~
֎ Trading system script on tradingview that brings an easy approach to trading with a high profitability rate
֎ Our proprietary formula was developed over the course of the past two years through a combination of trial and error and algorithmic backtesting.
-- HOW IT WORKS --
֎ The algorithm starts with a proprietary script combining custom inputs with a formula that works with custom bollinger bands settings and specific RSI levels to results in deadly accurate signals for long and short entry points.
but that's not all...
֎ When we first developed our formula, we noticed that it produced a lot of accurate signals but also didn't fully understand the dynamics of market momentum and trending directions...
...so there were a lot of needless calls being made that were reducing profitability.
You see, most markets spend roughly 80% of the time trading sideways with no significant trend either up or down...
...And trading these sideways markets commonly result in what's called a "whipsaw"...
A whipsaw is when price is moving in one direction but then quickly pivots to move in the opposite direction resulting in a loss. And nobody wants to be stuck trading in a sideways market getting killed by whipsaws all day...
So what did we do to fix this?...
-- THE WINNING FORMULA --
֎ We added the Average Directional Index into our custom formula with a goal of teaching the algorithm to only trade during periods of strong momentum and trends whether up or down.
֎ We also added trend exhaustion levels to give clear indication for exit signals and help determine best times of getting out of a trade.
֎ Trend Exhaustion Levels work in conjunction with trailing stop loss % and both are customizable for ideal exits and profitability.
֎ The results are mind blowing!
-- WHO IT'S FOR --
֎ Optimized for crypto markets, to catch trend movements as soon as possible and maximize profitability
֎ It's A Swing Traders Dream.
-- What You Get --
֎ Sell & Buy alerts, Stop Loss alerts and always adding new features!
֎ Customizable settings.
֎ Chrome Extension in development for fine-tuning settings automatically(COMING SOON)
-You will be able to select an asset. push a button. and the extension will find the best settings for you!
֎ Users Facebook community for learning, sharing and direct support
If you’d like to test the trading script in TradingView, I can give you access to a 10 days trial.
Please send me PM in tradingview and I’ll activate it right away.
Thank you!
Ichimoku Cloud ForecastUsing doubled crypto settings, forecast Tenkan and Kijun lines, assuming price remains neutral (constant).
Tenkan - 14 periods
Kijun - 20 periods

Companion::DivergentCompanion::Divergent is a combined indicators strategy optimized for Bitcoin Markets and tested on Bitfinex.
Mainly, it is an Ichimoku based strategy.
Used indicators:
- Ichimoku (displayed on chart): trendline analysis;
- Double Hull MA (displayed on chart): trendline analysis;
- MACD (not displayed): confirmative/momentum detection;
- CCI (not displayed): confirmative/momentum detection;
- ATR: used toghether with Ichimoku to determine Stop Loss/Take Profit levels;
- VWMA: For implementing trailing stop orders based on volumes.
What the script does:
- determines trendlines combining mulitple indicators;
- automaticlally calculates Take profit and Stop Loss levels;
- permits automation generating Autoview signals;
- supports for margin trading. Spot trading will be added in the future.
It can be used on 1D or 1H timeframes but it can be adapted for other time frames tweaking the parameters. I used it a lot on Bitfinex on 1H timeframes. Please check parameters: if you will use the strategy on D or higher timeframes, the "Legacy Chikou analysis" option should be checked.
BACKTESTING
Backtest is not leveraged. Defaults are set as follow:
Capital: 10000
Percent of equity used for trades: 10%
Commission: 0.18% this is Bitfinex commission on orders
Change them accordingly on how you trade to get a more realistic backtest results.

Crypto Breakout Alert DEMOThe indicator plots breakout events of user-defined assets list, providing alert setting for breakout events.
Any big trend begins with a couple of price breakouts. By watching breakout events, we overlook the panorama of the whole market.
Version: DEMO
---------- Features --------------
User-Defined Crypto / or any Asset List, Up To 30 Assets, Demo has some limit
User-Defined Breakout Threshold
Accessible for wide timeframes: 5s - 1 Month, Demo has some limit
Plot the Breakouts History of whole market
Progressive color according to the strength of the breakthrough
--------- Indicator Settings -----------
"Show Bull or Bear?": To show Bull Breakout, Bear Breakout or Both
"User-Defined Breakout Threshold": User can defined the threshold of breakout, default value 999 means using default set up, as following - "Default Breakout Threshold"
"A rate to decrease Bitcoin Threshold": Bitcoin has much lower volatility than other coins, so this rate is usded to lower the threshold for Bitcoin , defval = 0.5
"Use Green for Bull? ": Toggle color for Bull, defval: true, if your region use red for bull, toggle it.
"Exchange": Your exchange name, which is used to defined tickerid, defval="BINANCE", optional - can be empty
"Asset PostFix": postfix of your asset symbol, which is used to define tickerid, defval="USDTP", change it if necessary, this can not be empty.
"Toggle Notice Label": close or open the notice label
--------- Default Breakout Threshold For Popular Timeframes-------------
5s 0.5%
15s 0.75%
30s 0.9%
1m 1.2%
2m 1.4%
3m 1.6%
5m 1.8%
8m 2%
15m 3%
20m 3.5%
30m 4%
60m 5%
120m 6.5%
240m 8%
480m 10%
1D 12%
1W 20%
---------- Versions Description ----------
The features may change later without advance notice.
DEMO version has basic features.
---------- Access to Indicators ----------
Contact the author by Private Chat for access to Invite-Only versions and a trial.
---------- Install Invite Only Version----------
Open the chart -> Add Indicators (On the Top or press /) -> Invite-Only Scripts (last button of the left bar)
Like/Favorite the indicator
Click to install on the chart
---------- About Loading Time ----------
It may take up to 1-3 minutes for your browser to load a new setting, depending on the your computer and network speed. For convenience, you can keep related pages open continuously.
---------- FAQ -----------
1. Why can't I see older breakout labels?
Due to system limit, 500 is the maximum of labels.
In order to see older breakout events, please Select Bull or Bear, instead of Both; Or Increase to filter weak breakouts.
2. How to watch more than 30 coins?
Due to system limit, 30 assets is the maximum.
In order to watch more assets, user can open the indicator in another chart, add your 2nd assets list, save 2nd layout, set alerts for different lists respectively.
---------- Disclaimer ----------
By using or requesting access to the indicator, you acknowledge that you have read and accepted that the indicator and any related content, including but not limited to: user manual, tutorials, ideas, videos, chats, emails, blog, are for the purpose of trading strategies studying and paper trading.
If a customer or user uses the indicator or related content mentioned above for live trading or investment, she/he should take all risks and responsibility of her/his own trading and investment activities.
---------- Updates ----------
The latest updates override the previous description.
To activate a update: Close the browser, Reopen the chart and apply the indicator.
【加密货币突破预警】指标绘制一系列资产的突破事件,提供突破预警
任何大趋势都开始于一系列的价格突破。通过监控突破事件,可以俯瞰市場的運動
版本 DEMO
---------- 产品特征------------
用户自定义的加密货币品种列表,或者其他资产列表,多达30个品种, DEMO 有限品种
用户自定义的突破门槛
适用于宽泛的时间维度:5秒--1月, DEMO 有限制
绘制整个市场的突破历史
漸進顏色 根據突破的力度
------------- 指标设置说明 -------------------
"展示牛熊突破?": 展示牛突破,熊突破或者两者
“用户自定义突破门槛”: 自己定义突破门槛,999代表默认的设置,详见下方“默认的突破门槛”
"比特币突破门槛修正": 比特币的波动性远远低于其他加密货币,这个比率用来调低比特币的门槛
"切换通知标签": 用来开关通知标签
"綠色為牛?": 切換標籤顏色,默認綠色為牛
“交易所”:用来定义资产名称,可以为空
“资产后缀”: 用来定义资产名称,不可以为空
---------默認的突破門檻-------------
5s 0.5%
15s 0.75%
30s 0.9%
1m 1.2%
2m 1.4%
3m 1.6%
5m 1.8%
8m 2%
15m 3%
20m 3.5%
30m 4%
60m 5%
120m 6.5%
240m 8%
480m 10%
1D 12%
1W 20%
---------- 版本描述 ----------------
產品特徵後續可能變化,恕不事先通知
DEMO版本供試用
----------- 獲取指標使用權 ------------
通過私信聯繫作者,要求訂閱或試用
----------- 安裝指標 -----------------
加指標 -》 Invite-Only (左邊欄目)
點贊或者收藏指標
點擊安裝指標
----------- 關於載入時間 ---------------
可能需要1--3分鐘來完成載入,取決於用戶的電腦和網絡速度,方便起見可以保持相關頁面持續開啟
------- FAQ ----------
1. 如何查看更早的突破歷史
由於系統限制,500 個標籤是上限
為了查看更早的突破,請選擇牛或者熊,而不是兩者;或者提高"用戶自定義突破門檻" 來過濾掉弱突破
2. 如何監控更多資產?
由於系統限制,30個資產是上限
為了監控更多資產,可以在第二個圖表加載指標,保存圖表,分別在不同的圖表設置突破預警
---------- 免責聲明 ----------
在要求獲得本指標使用權之前以及在使用本指標之前,用戶認可已經完全了解和接受:本指標僅供學習交流目的, 它不構成任何交易建議或者投資建議。用戶如果將指標用於其他用途,應自行承擔所有風險和責任。
本指標的開發者並非專業投資顧問,因此不對用戶的任何行为負責。
最近的更新會覆蓋之前的說明。請參閱更新來查看指標的新特徵和功能。

Crypto Breakout AlertThe indicator plots breakout events of user-defined assets list, providing alert setting for breakout events.
Any big trend begins with a couple of price breakouts. By watching breakout events, we overlook the panorama of the whole market.
---------- Features --------------
User-Defined Crypto / or any Asset List, Up To 30 Assets
User-Defined Breakout Threshold
Accessible for wide timeframes: 5s - 1 Month
Plot the Breakouts History of whole market
Progressive color according to the strength of the breakthrough
--------- Indicator Settings -----------
"Show Bull or Bear?": To show Bull Breakout, Bear Breakout or Both
"User-Defined Breakout Threshold": User can defined the threshold of breakout, default value 999 means using default set up, as following - "Default Breakout Threshold"
"A rate to decrease Bitcoin Threshold": Bitcoin has much lower volatility than other coins, so this rate is usded to lower the threshold for Bitcoin, defval = 0.5
"Use Green for Bull? ": Toggle color for Bull, defval: true, if your region use red for bull, toggle it.
"Exchange": Your exchange name, which is used to defined tickerid, defval="BINANCE", optional - can be empty
"Asset PostFix": postfix of your asset symbol, which is used to define tickerid, defval="USDTP", change it if necessary, this can not be empty.
"Toggle Notice Label": close or open the notice label
--------- Default Breakout Threshold For Popular Timeframes-------------
5s 0.5%
15s 0.75%
30s 0.9%
1m 1.2%
2m 1.4%
3m 1.6%
5m 1.8%
8m 2%
15m 3%
20m 3.5%
30m 4%
60m 5%
120m 6.5%
240m 8%
480m 10%
1D 12%
1W 20%
---------- Versions Description ----------
The features may change later without advance notice.
DEMO version has basic features.
---------- Access to Indicators ----------
Contact the author by Private Chat for access to Invite-Only versions and a trial.
---------- Install Invite Only Version----------
Open the chart -> Add Indicators (On the Top or press /) -> Invite-Only Scripts (last button of the left bar)
Like/Favorite the indicator
Click to install on the chart
---------- About Loading Time ----------
It may take up to 1-3 minutes for your browser to load a new setting, depending on the your computer and network speed. For convenience, you can keep related pages open continuously.
---------- FAQ -----------
1. Why can't I see older breakout labels?
Due to system limit, 500 is the maximum of labels.
In order to see older breakout events, please Select Bull or Bear, instead of Both; Or Increase to filter weak breakouts.
2. How to watch more than 30 coins?
Due to system limit, 30 assets is the maximum.
In order to watch more assets, user can open the indicator in another chart, add your 2nd assets list, save 2nd layout, set alerts for different lists respectively.
---------- Disclaimer ----------
By using or requesting access to the indicator, you acknowledge that you have read and accepted that the indicator and any related content, including but not limited to: user manual, tutorials, ideas, videos, chats, emails, blog, are for the purpose of trading strategies studying and paper trading.
If a customer or user uses the indicator or related content mentioned above for live trading or investment, she/he should take all risks and responsibility of her/his own trading and investment activities.
---------- Updates ----------
The latest updates override the previous description.
To activate a update: Close the browser, Reopen the chart and apply the indicator.
【加密货币突破预警】指标绘制一系列资产的突破事件,提供突破预警
任何大趋势都开始于一系列的价格突破。通过监控突破事件,可以俯瞰市場的運動
---------- 产品特征------------
用户自定义的加密货币品种列表,或者其他资产列表,多达30个品种
用户自定义的突破门槛
适用于宽泛的时间维度:5秒--1月
绘制整个市场的突破历史
漸進顏色 根據突破的力度
------------- 指标设置说明 -------------------
"展示牛熊突破?": 展示牛突破,熊突破或者两者
“用户自定义突破门槛”: 自己定义突破门槛,999代表默认的设置,详见下方“默认的突破门槛”
"比特币突破门槛修正": 比特币的波动性远远低于其他加密货币,这个比率用来调低比特币的门槛
"切换通知标签": 用来开关通知标签
"綠色為牛?": 切換標籤顏色,默認綠色為牛
“交易所”:用来定义资产名称,可以为空
“资产后缀”: 用来定义资产名称,不可以为空
---------默認的突破門檻-------------
5s 0.5%
15s 0.75%
30s 0.9%
1m 1.2%
2m 1.4%
3m 1.6%
5m 1.8%
8m 2%
15m 3%
20m 3.5%
30m 4%
60m 5%
120m 6.5%
240m 8%
480m 10%
1D 12%
1W 20%
---------- 版本描述 ----------------
產品特徵後續可能變化,恕不事先通知
DEMO版本供試用
----------- 獲取指標使用權 ------------
通過私信聯繫作者,要求訂閱或試用
----------- 安裝指標 -----------------
加指標 -》 Invite-Only (左邊欄目)
點贊或者收藏指標
點擊安裝指標
----------- 關於載入時間 ---------------
可能需要1--3分鐘來完成載入,取決於用戶的電腦和網絡速度,方便起見可以保持相關頁面持續開啟
------- FAQ ----------
1. 如何查看更早的突破歷史
由於系統限制,500 個標籤是上限
為了查看更早的突破,請選擇牛或者熊,而不是兩者;或者提高"用戶自定義突破門檻" 來過濾掉弱突破
2. 如何監控更多資產?
由於系統限制,30個資產是上限
為了監控更多資產,可以在第二個圖表加載指標,保存圖表,分別在不同的圖表設置突破預警
---------- 免責聲明 ----------
在要求獲得本指標使用權之前以及在使用本指標之前,用戶認可已經完全了解和接受:本指標僅供學習交流目的, 它不構成任何交易建議或者投資建議。用戶如果將指標用於其他用途,應自行承擔所有風險和責任。
本指標的開發者並非專業投資顧問,因此不對用戶的任何行为負責。
最近的更新會覆蓋之前的說明。請參閱更新來查看指標的新特徵和功能。

OnTheMoveWith this plot one is able to compare the different % change in the given time frame. It calculates the sma of a given period (defval = 7) for the close/open.
Strategy would be to choose (trade) from one to other asset in order to get higher rates when pumping or lower when dumping.
The Symbol & exchange has to be specified.
defSymbols = BTC, ETH and LINK
defExchange = BINANCE

GreenCrypto PR Strategy for Swing TradesThis is a very good strategy for Swing Trading, I have been using this strategy for very long time and made good amount of profit using this. This works great for both long trades and short trades, Stop loss and Take profit target is must while entering the trade, this make sure that the trade ends up in good profit and in case if the market revers, ends in only small loss.
This strategy works using the pivot points, we calculate the pivot point using the number of candles mentioned in the input field "leftBars" and "rightBars", if you add more number of bars then the frequency of the trade decreases. for example with the leftBars as 4 you will get less trades than the leftBar=2. Every trade entry is represented using "Buy" and "Sell" signals, whenever there is a new signal chart shows buy/sell signal for limit price, you need to add a limit order for the same price.
Parameters:
LeftBars = Number of left bars should be used for calculating the pivot pints, (more bars means less frequent trades)
RightBars = Number of right candle bars used for calculating the pivot points (more bars means less frequent trades)
Date/month/day : for selecting the right backtesting the period (currently it set to Jan 2018 to current day )
for this backtesting i have used 1000$ capital and with 10% capital used for each trade, free to modify it as per your needs.
This strategy works best on 4H time frame but you can also try backtesting on other time periods.
The default parameters present in the strategy is works best for most of famous cryptocurrencies on 4H time period.
Please DM me if you would like to tryout 7 Days free trail.

[5F] Bitcoin Hash Rate + Miners revenue-═════════════════════════-
📋 Description :
This script display the Bitcoin' Hash Rate and the Miners revenue based on the data provided by Quandl.
Hashrate is displayed in TH/s : trillion hashes per second with an moving average.
Miners revenue is calculated by : (the number of bitcoins mined per day + transaction fees) * market price
The dates of previous halving are also displayed.
🛠 Note :
There is a multiplier on the miners revenue that you can configurate. It's only used to bring the 2 curves closer together for better visibility but the multiplier don't affect the revenue's data.
You can choose between different types of moving average for the hashrate's signal : SMA, EMA, DEMA, TEMA, WMA, VWMA or TMA.
You can show and hide each elements of the indicator
Thanks to all Pinecoders who share their work with the community.
-═════════════════════════-

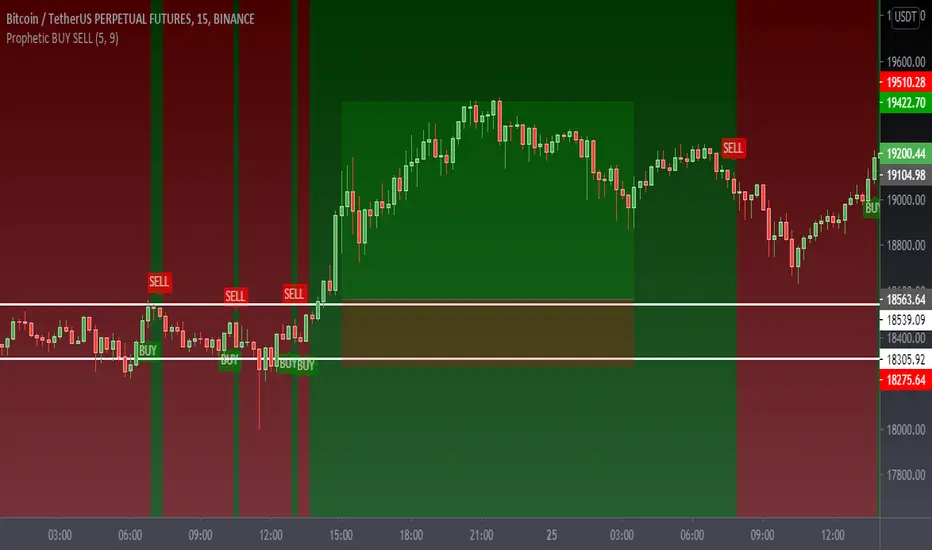
Prophetic BUY SELL IndicatorThis premium indicator will help you to do quick scalping on Cryptocurrencies, Forex, and Stocks.
This indicator is very simple to understand.
Green BUY Alert - Buy Signal Market is up
Red SELL Alert - Sell Signal Market is down
Caution:- Do not use it during market being choppy or sideways
Once the BUY signal appears the background changes green and same with SELL it turns red
can change the color according to requirements
It also has a moving average which also changes the color as the candles close above the MA or the below Default color are green and red
Please Like Share and Follow and if required please contact:- @mobudd (TELEGRAM)
or Ping me on trading view
Guys, It takes effort so please do not ask for free access.
You're always welcome to share any type of suggestion & feedback.
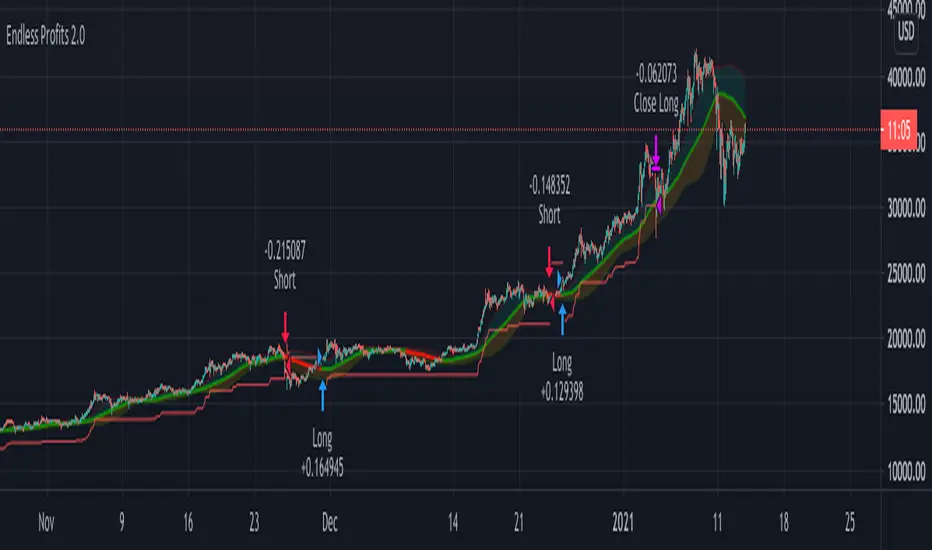
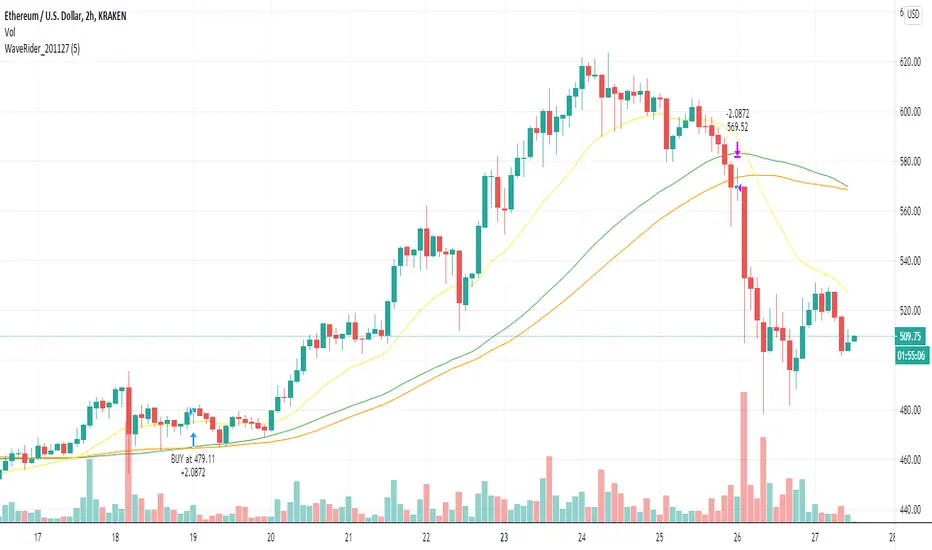
The WaveRider - Help me to exit position!Hello,
I always like to refer to my previous articles to allow people to understand where am I in terms of knowledge at the time when I write this article.
BTC and ETH Long strategy version 1
BTC and ETH Long strategy version 2
Although some part of my crypto trading is automated via HaasOnline software, I like to take discretionary trades to feel the excitement of manual trading, especially during bull market :).
I write this new article and script because I did struggle to decide when to exit a recent LONG position on Ethereum.
Most of the novice traders struggles to know when to exit the position when gains are made.
The is exactly what happens to many people trading cryptos in the beginning of this bull market.
We always want more, we want to ride the wave as much as possible.
We see the gains growing every day and don't want to exist the position because tomorrow will bring more gains.
Yes, but sometimes there is a small retracement, the price is bleeding slowly but we want to hold because the price will move UP again in one of two days.
So the big question is went to exit (or not).
This subject is a difficult one because we are humans and highly influenced by our psychology.
Depending on the mood we are in, we can take different decisions.
If we are not feeling good and we are not in good mood, we will probably close a winning position as soon as a retracement comes in to keep our gains because we see this retracement as something bad.
On the other side, if we feel good and are in a good mood that day, we might take to opposition decision and keep the trade running as we believe that this retracement is something healthy for the price to allow it to continue to move up.
For novice traders, these emotions can impact the way how we trade and create frustrations if we exit a position too soon or too late.
So, why not to let a script giving us advices on this decision? If we are not sure if we should exit or not, this script might help us to take a better decision.
I have named this script the "WaveRider" because it is supposed to be used during bull market only when the asset is moving up.
Best time frame to use with crypto such as Bitcoin and Ethereum are 2H, 4H and 6H candles.
Even if it can also give you entry points to open a trade, the goal of this script is more to give you exit points.
So, if you have opened a trade manually and you are wondering if this is the right time to close it, this script is made for you.
Technically, entry points are based on 2 Moving averages (slow and fast). We can enter in position when crossing over.
The Position can be closed if the same Moving averages are crossing down. In addition, it will exit if the price suddenly drops below the Moving average.
I know it sounds simple and stupid, but sometimes we don't ask ourselves the right questions when taking the decision to exit a position. So, this script will remind you the basic stuff to consider before closing your position.
I hope that such idea will help you to take good exit decisions in the future.
Let me know if you need more details or want to access it.
Trendy Bar Trend Color LiteLite version of the original Trendy Bar Trend Color
This will only color the candlestick body of your chart
Can be used with solid, hollow, renko, or any other chart type
Custom coloring for Highs, Lows, and consolidation is removed

BTC and ETH Long strategy - version 2I wrote my first article in May 2020. See below
BTC and ETH Long strategy - version1
After 6 months, it is now time to check the result of my script for the last 6 months.
XBTUSD (4H): 14/05/2020 --> 22/11/2020 = +78% in 4 trades
ETHXBT (4H): 14/05/2020 --> 22/11/2020 = +21% in 9 trades
ETHUSD (4H): 14/05/2020 --> 22/11/2020 = +90% in 6 trades
Using the signals from this strategy to trade manually has shown that this was a bit frustrating because of the low rate of winning trades.
If you have to enter 100 trades and see 75% of them failing and 25% winning, this is frustrating. For sure the strategy makes good money but it is difficult to hold this mentality.
So, I have reviewed and modified it to get a higher winning rate.
After few days of work, tests and validation, I managed to get a wining rate close to 60%.
The key element was also to decrease the number of trades by using a higher time frame. (4H candles instead of 2H candles).
- Entry in position is based on
MACD, EMA (20), SMA (100), SMA (200) moving up
AND EMA (20) > SMA (100)
AND SMA (100) > SMA (200)
- Exit the position if: Stoploss is reached OR EMA (20) crossUnder SMA (100)
The goal of this new script is to be able to follow the signals manually and only make few trades per years.
I have also validated it against some other altcoins where some are giving very good results.
Here are some results for 2020 (from 01/01/2020 until now (22/11/2020). Those results are the one I get when using 4H candles.
ETH/USD: +144% in 8 trades.
BTC/USD: +120% in 7 trades.
ETH/BTC: +33% in 9 trades.
ICX/USD: +123% in 10 trades.
LINK/USD: +155% in 11 trades.
MLN/USD: +388% in 8 trades.
ADA/USD: +180% in 7 trades.
LINK/BTC: +97% in 10 trades.
The best is that above results are without considering compound effect. If you re-invest all gains done in each new trade, this will give you the below results :)
ETH/USD: +189% in 8 trades.
BTC/USD: +260% in 7 trades.
ETH/BTC: +29% in 9 trades.
ICX/USD: +112% in 10 trades.
LINK/USD: +222% in 11 trades.
MLN/USD: +793% in 8 trades.
ADA/USD: +319% in 7 trades.
LINK/BTC: +103% in 10 trades.
As you can see, the results are good and the number of trades for 11 months is not big, which allows the trader to place orders manually.
But still, I'm lazy :), so, I have also coded this strategy in HaasScript language which allows you to automate this strategy using the HaasOnline software specialized in automated crypto trading.
I hope that this strategy will give you ideas or will be the starting point for your own strategy.
Let me know if you need more details.

Crypto ZigZag RSI strategy 15minThis strategy is designed for crypto markets like ETHUSD/T, BTCUSD/T and so on.
It works amazingly with 15 min time frames.
Its idea consists in :
We have the RSI indicator, and with it we check for the crossover with overbought and oversold levels. At the same time we have the zigzag which is made from the higher highs and the lower lows between a specific price movement in %.
For entries, they are going to be based on the crossover of rsi with overbought or oversold levels , combined together with cross over 0 line from the the zigzag.
At the same time the strategy has the posibility to go only long, only short or both.
Let me know if you have any questions.

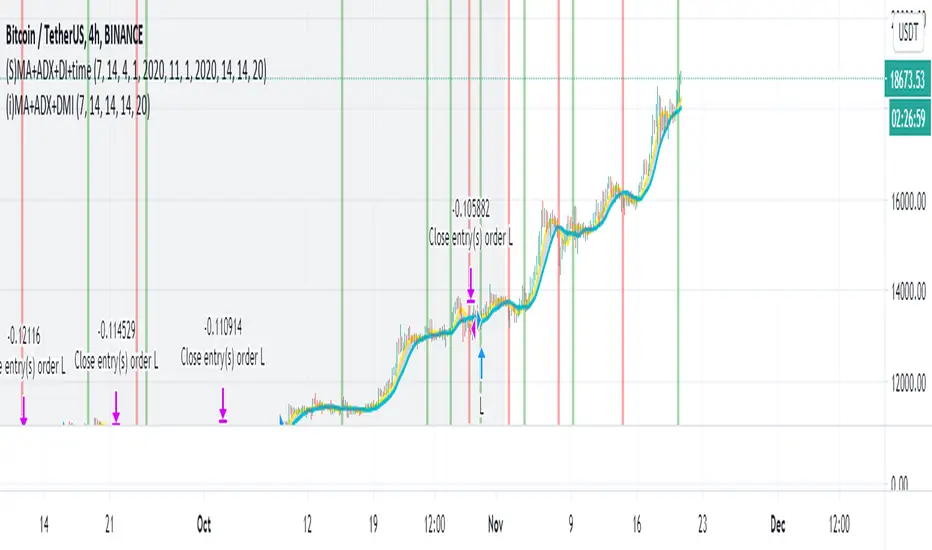
Simple Moving Average + ADX + DMI + Time Range Test
Use long and short moving average to look for a potential price in/out. (default as 14 and 7, bases on the history experience)
ADX and DMI to prevent the small volatility and tangling MA.
This script allows you to set the beginning & end time to test the bullish & bearish market.
If you want an indicator version, here is it.
Thanks.
Velocity To Inverse Correlation to VIX/Bonds Strategy (2020)This strategy measures and creates a signal when an asset is moving out of a correlation with high yield bonds or the CBOE VIX into an inverse correlation, as well as when an asset is losing correlation with a top corporate bonds ETF. When this signal is triggered, the simulation has the portfolio asset go long.
Additionally, exits are based on a 2% stop loss and a 2% take profit for simplicity sake to indicate whether the direct next move in the asset is up or down.
This was originally tested as a descent indicator for Ethereum's 2020 moves as institutional investors moved into the market.

Bitcoin (BTC) Scalp / Short-term Short IndicatorThe purpose of this scalping Indicator is to help identifying Sell signals for short term trades on Bitcoin (Spot, Features, etc.) .
This script is working with more indicators and everything is balanced by hard work on (back)testing.
Result for users is a simple signal to SELL.
You can use it as easy indicator in your graph or create alerts.
I have the best results on 1min graph, with leverage and stop-loss feature.
This is my own version of scalping Sell Script / Indicator, which is a combination of few indicators, for example RSI , BB and price levels (actual and average) and works on standard candles.
SELL signal paints above the candle and you can set your target / trailing / stop-loss in the settings and check how it works in Strategy Tester.
Settings of this Indicator:
Take Profit
Stop Loss
Trailing Stop Loss
Trailing Stop Loss Offset
Initial Capital
Base Currency
Order size
Pyramiding
Commissions
Slippage
Average price lines (colors and visibility)
Plot background
These signals can be often observed at the beginning of a strong move, but there is a significant probability that these price levels will be revisited at a later point in time again.
Therefore these are interesting levels to place limit orders.
A Sell signal is defined as the last up candle before a sequence of down candles.
In my trading settings I have more but small positions, one safety limit order (for price averaging = better entry - easier close in profit) and stop-loss.
Sometimes trailing-profit feature have very nice profits.
Settings depends on your own money-management and free capital.
Don't ignore UP / DOWN trend. For UP trend I have an Indicator too (check my profile).
In addition to the upper/lower limits of each line, also average value is marked as this is an interesting area for price interaction and better view.
PM me to obtain access, more informations or support.
NOTICE: By requesting access to this script you acknowledge that you have read and understood that this is for research purposes only and I am not responsible for any financial losses you may incur by using this script.

S2F Price LevelsThis is the indicator that plots Bitcoin's Stock to Flow model price and its significant levels.
Grey: S2F price
Green: S2F bottom (S2F multiple of 0.5)
Blue: S2F mode (S2F multiple of 0.67)
Red: S2F top
