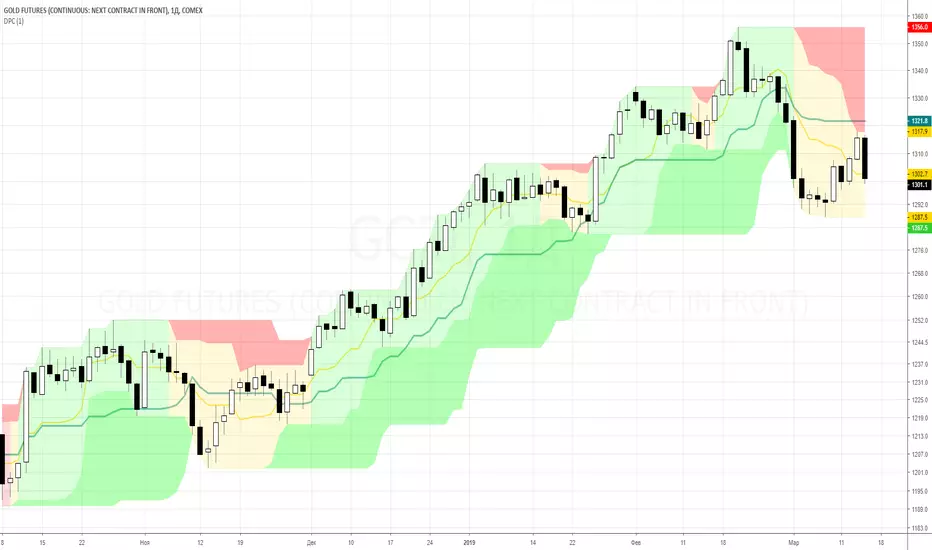
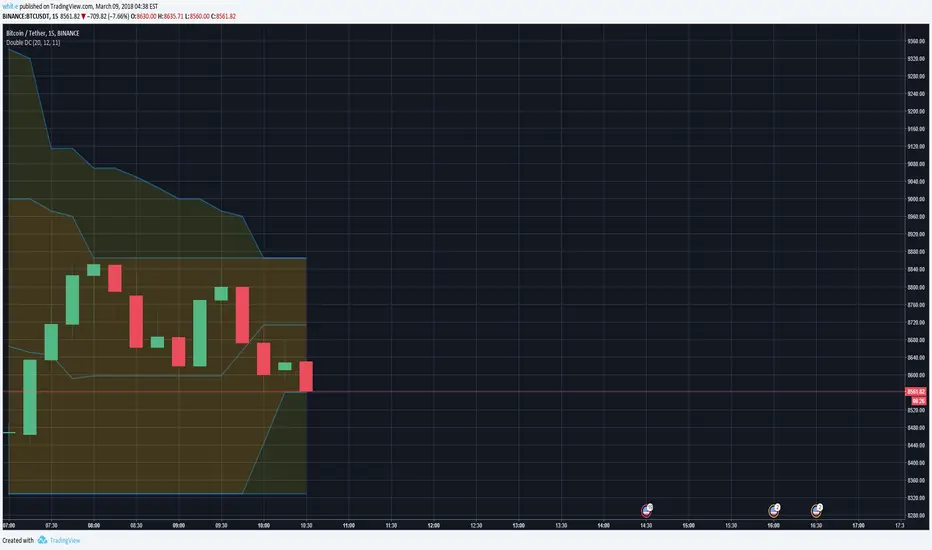
Double Price ChannelsDouble Price Channels is a simple and intuitive way to control the market phase. Trend is your friend!
Два ценовых канала с разными таймингами, это простой и наглядный способ контролировать фазу рынка.
Subscribe at $120/yr. Include Double Price Channel and Double Aroon.
Подписка всего за $120 в год. Включает в себя оба индикатора показанные на графике: Double Price Channel и Double Aroon.
Canali Donchian (DC)
Liberix ChannelsThis indicator combines a Donchian Channel with the ATR (it adds 1/2 ATR on top of the DC, and 1/2 below).
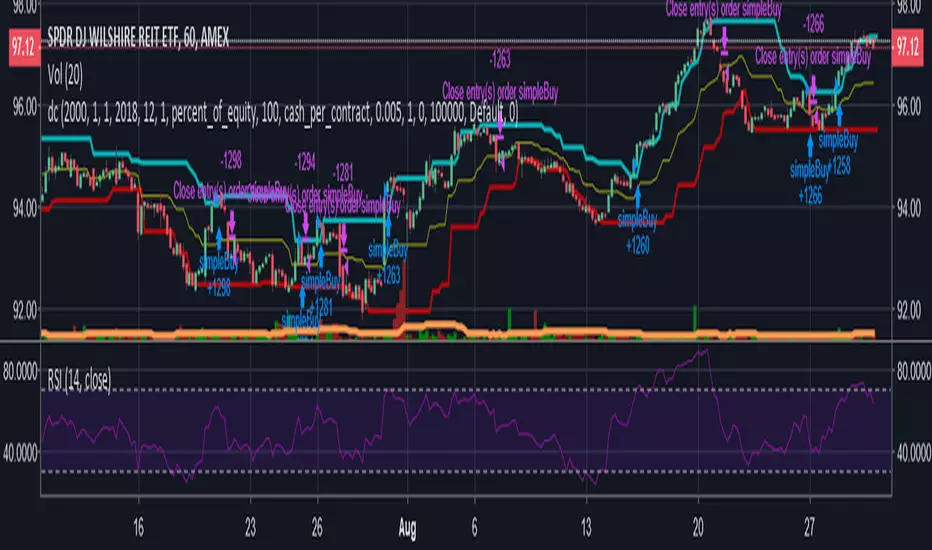
donchian channelssimple donchian channels strategy. can be modified for long or short, futures / equities / crypto / forex
Session RangeSimple script for showing the high/low/midrange of a session. By default configured to do the Daily range using the "regular" session. But it's configurable. For example on this chart I am showing the Weekly range.

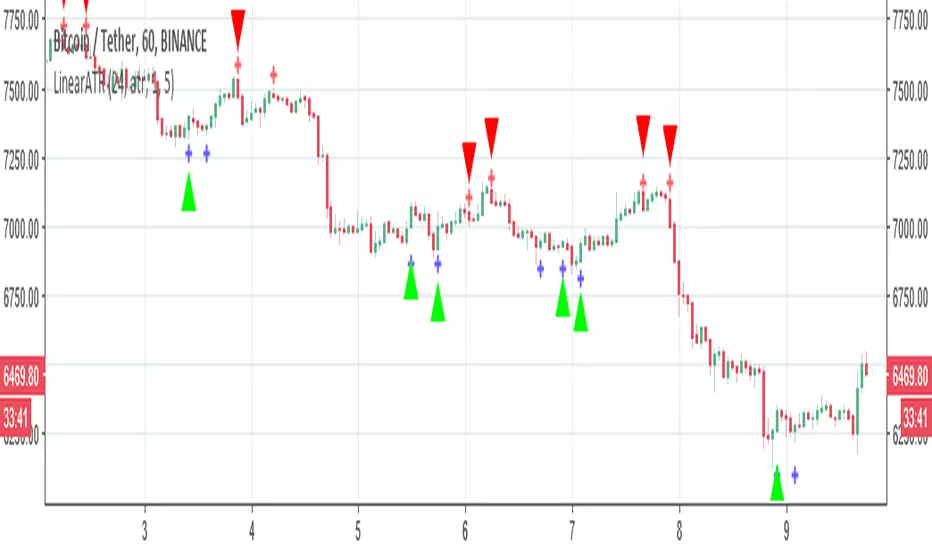
LinearATRThis model based on ATR donochian signal and linear regression slope
you can make the model buy less or more just by making either the length of either shorter or longer
alerts inside
in next model i will try to make it with some more stuff
Consecutive Highs/LowsTrack consecutive new highs/lows outside the Donchian range. Fans of the oldschool Turtle Strategy should enjoy the visualization.
Same logic as my "Walking the Bands" script, just with Donchian breaks instead of Bollinger tags.

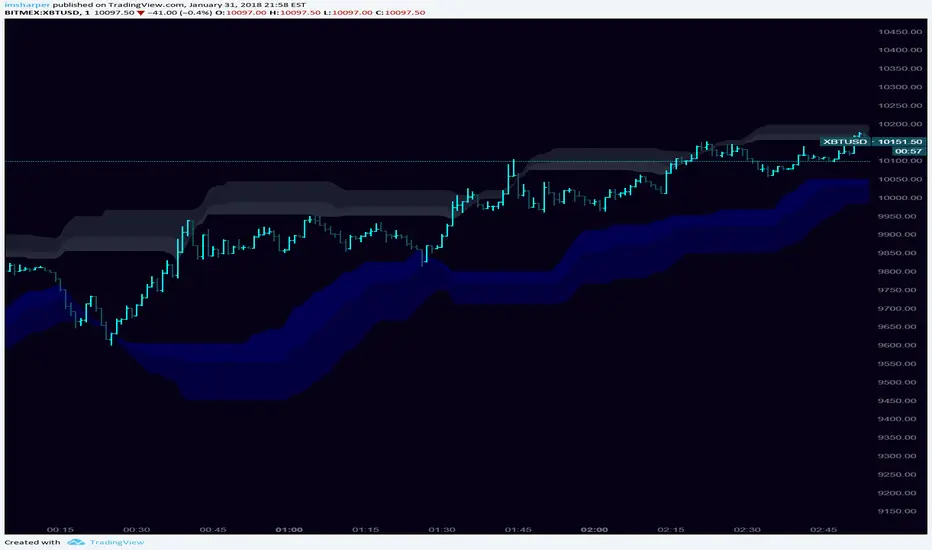
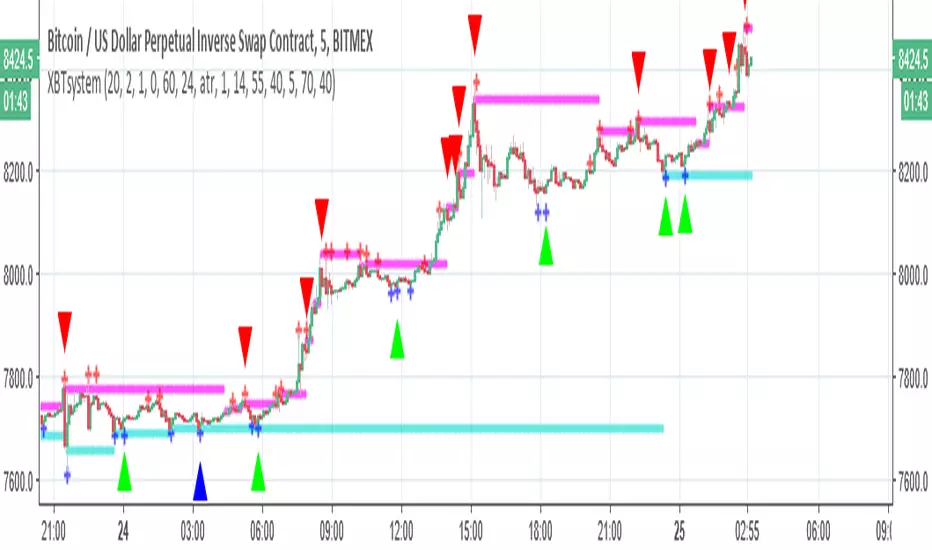
XBTsystemThis is 5 min system for XBT on bitmex. for different time frame just change the setting
it a semi auto system and you need to follow the rules exact in order to be in the profit
1. the system show you the line of support and resistance of XBT
there are 3 buy points (strong green based on rsi ,lime based on cross up ATR donochian channel and blue based up on crossing up the support and system.
the arrow is just to help you to find your way and to give you alerts when it happen.
the exit is based on the resistance level shown in red triangle.
2. you buy at arrow cross up. take profit is the next line of resistance (pink) . if it breaking it up set your take profit to next resistance level
there are warning made by blue and red crosses this is based on ATR . you use them as a guide for fast exit if need or entry . there is no alerts for it.
3. each support level is the lower point exists to guide you for your stop loss ' put bellow it
4. set your take profit correctly
this is 15 min chart
30 min chart
fibgameI have no power to finish it so who ever want to continue is welcome, exit point are good but still need work on entry points
have fun

[f(x)] Bollinger Donchian RemixThis is my version of a mixture of Bollinger and Donchian (BB/DC Remix)
It is a modified fork of Dolchian/Bollinger Hybrid by Ricardo Santos ( DBH.V0)
this is the two pictures comparing it.
Made this Fork because Santos' code starts getting chopping with my type of settings.
His time input is 24, but mine varies between 13 and 21.
You really notice in scalping and sometimes intraday timeframes with my settings.
His also differ from mine based on the trendline, where he modifies his Simple Moving Average, which is default color is black, and I use the the default one, which the default color is red.
Also you can change the trendline type input (open,close,hl2,etc...) to tailor your preference.
Note: Default is close, Santos use hl2, I use ohlc4.


BoSThis is a customized indicator that helps to confirm and identify breakouts displayed in the form of signals:
The tool can be customised for all pivot strengths
It can be applied on all timeframes but works best on the daily and weekly
A “Buy” signal is displayed when a pivot high is broken
A “Sell” signal is displayed when a pivot low is broken
This tool also helps to identify fake breakouts

Donchian Fibonacci ZonesDonchian Fibonacci Zones
1. CM_Donchian Channels Modified_V2 With Alert Capability by ChrisMoody
2. DONCHIAN FIBONACCI TRADING TOOL by eykpunter
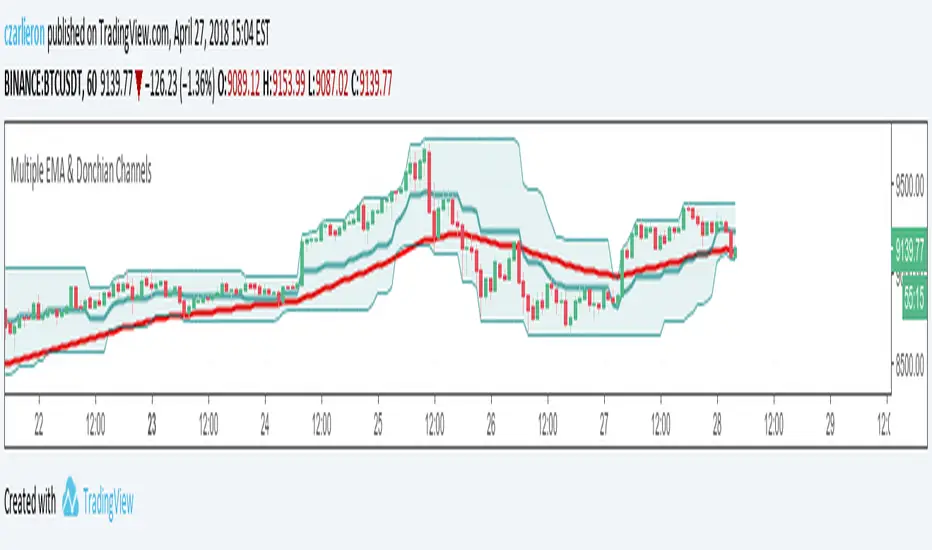
My Multiple EMA with Donchian ChannelsDonchian Channels with EMA's 8, 13, 21, 34, 55, 89 (fib numbers). Everything is configurable.
CTC Turtle Official V3In CTC(www.ctc.in.th), we believe trading strategy should be simple but effective. That is why we love turtle so much. For more information about turtle strategy, please read www.metastocktools.com
This strategy follows most rules in the original turtle with some enhancements. we added a trend filter to filter noise for lower time frame.
Trading view strategy can be repainted, the real world result will be never the same as the back test result. to prevent this and achieve most accurate result, we use open rather than close in calculation.
This strategy works best with established crypto currencies, for example, ETH, NEO. as they are most likely to have a healthy trend. Avoid using this strategy on low quality crypto currencies with no volume support.
So far we have found this strategies works best with ETH, NEO, XRP, XLM etc.
For small time frame like 1H, it is recommended to turn on the trend filter to avoid noice. For large time frame like 1D, turn it off for better result.
Don't use it on time frame less than 1H, it does not work.

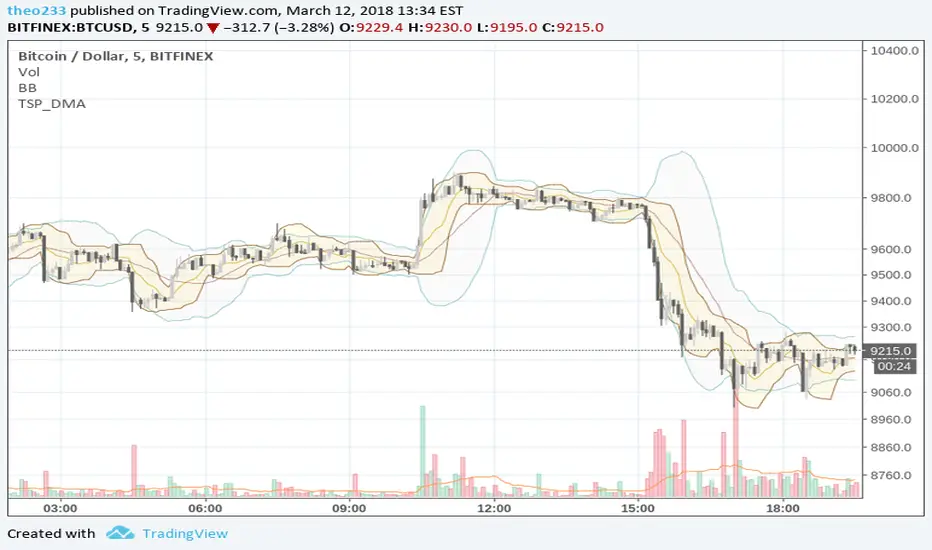
TSP Donchian EMADonchian with EMA
This show EMA of Donchain Channel (Highs and Lows)
It is nice to identify Support and Resistance, in range period
Should work well for scalp
This is a complement to Bollinger Bands
Double Donchian Channels & Custom AverageAllows to calculate 2 Donchian Channels and plot the average of a 3rd Donchian which can be arbitrary.
Donchian 1 and 2 Completely displayed (without average)
Donchian 3 only shows the average
Stationary Extrapolated LevelsBeta Peek/Valey based forecast
The idea behind this indicator is to extrapolate a stationary time series and find the peeks of the extrapolated result. The highest and lowest of the extrapolated data represent really precise support and resistance if the data and its extrapolation are barelly equal with an error lower than the average.
When the detrended price ( in blue ) crossover the lower level then the indicator detect a valey and the possibility of an up movement, if the higher is crossed down then the indicator detect a peek and the possibility a down movement.
When "Show extrapolated values" is checked the indicator will show the forecast of the detrended price with a forecast of length periods ahead.
Feel free to contact me for any questions regarding my indicators :)

Bollinger/Donchian ChannelsProvides a blending of Bollinger Bands and Donchian Channels with shading criteria between.

Donchian Channel Width Strategy The Donchian Channel was developed by Richard Donchian and it could be compared
to the Bollinger Bands. When it comes to volatility analysis, the Donchian Channel
Width was created in the same way as the Bollinger Bandwidth technical indicator was.
You can change long to short in the Input Settings
WARNING:
- For purpose educate only
- This script to change bars colors.

Donchian Channel Width Strategy The Donchian Channel was developed by Richard Donchian and it could be compared
to the Bollinger Bands. When it comes to volatility analysis, the Donchian Channel
Width was created in the same way as the Bollinger Bandwidth technical indicator was.
WARNING:
- This script to change bars colors.

Donchian Channel Width The Donchian Channel was developed by Richard Donchian and it could be compared
to the Bollinger Bands. When it comes to volatility analysis, the Donchian Channel
Width was created in the same way as the Bollinger Bandwidth technical indicator was.
As was mentioned above the Donchian Channel Width is used in technical analysis to measure
volatility. Volatility is one of the most important parameters in technical analysis.
A price trend is not just about a price change. It is also about volume traded during this
price change and volatility of a this price change. When a technical analyst focuses his/her
attention solely on price analysis by ignoring volume and volatility, he/she only sees a part
of a complete picture only. This could lead to a situation when a trader may miss something and
lose money. Lets take a look at a simple example how volatility may help a trader:
Most of the price based technical indicators are lagging indicators.
When price moves on low volatility, it takes time for a price trend to change its direction and
it could be ok to have some lag in an indicator.
When price moves on high volatility, a price trend changes its direction faster and stronger.
An indicator's lag acceptable under low volatility could be financially suicidal now - Buy/Sell signals could be generated when it is already too late.
Another use of volatility - very popular one - it is to adapt a stop loss strategy to it:
Smaller stop-loss recommended in low volatility periods. If it is not done, a stop-loss could
be generated when it is too late.
Bigger stop-loss recommended in high volatility periods. If it is not done, a stop-loss could
be triggered too often and you may miss good trades.

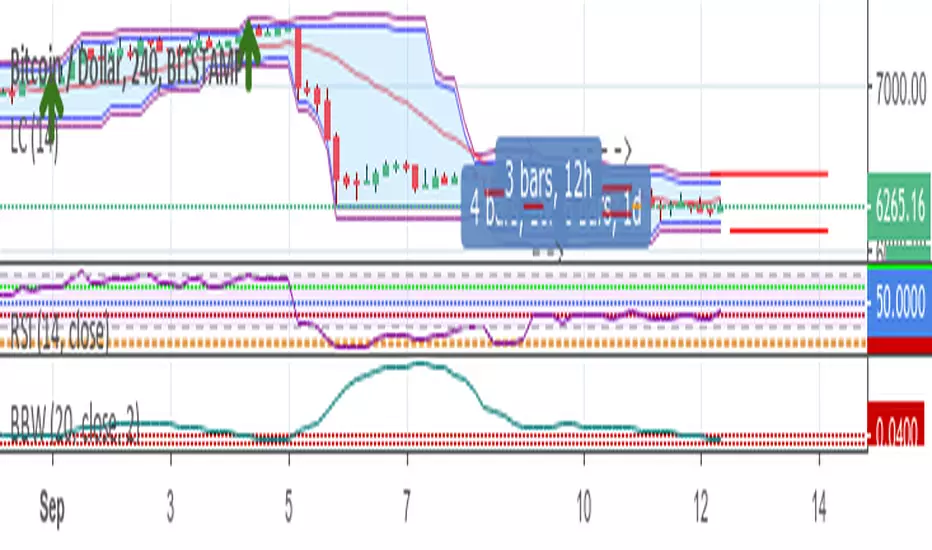
RSI ZonesThis is a combination of a couple ideas I saw on here. The result is from three configurable EMA smoothed RSI overbought/oversold zones. The default is set to Donchian Channel mode where the highs/lows of the RSI's are plotted. An optional basis line derived from the slowest RSI is also included. Toggling this mode off gives you different results.
You'll want to play with different lengths for your own preferences and to see what works best for you.
Being able to see price bounce between these zones should hopefully give you some ideas on how you could potentially use this.
Credit to LazyBear for the initial idea.