Donchian Channel - CustomThis is an extension to Donchian Channel - Pivot High Low indicator. Creating new version as the new type added isn't related to pivot high/low.
New type added is based on moving average. Instead of using highest and lowest of n bars, here, we are using lowest and highest of moving average of highs and lows for n bars.
Previous version of Donchian channel pivot points can be found here:
Canali Donchian (DC)

Donchian Zig-Zag [LuxAlgo]The following indicator returns a line bouncing of the extremities of a Donchian channel, with the aim of replicating a "zig-zag" indicator. The indicator can both be lagging or lagging depending on the settings user uses.
Various extended lines are displayed in order to see if the peaks and troughs made by the Donchian zig-zag can act as potential support/resistance lines.
User Settings
Length : Period of the Donchian channel indicator, higher values will return fewer changes of directions from the zig-zag line
Bounce Speed : Determine the speed of bounces made by the zig-zag line, with higher values making the zig-zag line converge faster toward the extremities of the Donchian channel.
Gradient : Determine whether to use a gradient to color the area between each Donchian channel extremities, "On" by default.
Transparency : Transparency of the area between each Donchian channel extremities.
Usage
It is clear that this is not a very common indicator to see, as such usages can be limited and very hypothetical. Nonetheless, when a bounce speed value of 1 is used, the zig-zag line will have the tendency to lag behind the price, and as such can provides crosses with the prices which can provide potential entries.
The advantage of this approach against most indicators relying on crosses with the price is that the linear nature of the indicator allows avoiding retracements, thus potentially holding a position for the entirety of the trend.
Altho this indicator would not necessarily be the most adapted to this kind of usage.
When using a bounce speed superior to 1, we can see the predictive aspects of the indicator:
We can link the peaks/troughs made by the zig-zag with the precedent ones made to get potential support and resistance lines, while such a method is not necessarily accurate it still allows for an additional to interpret the indicator.
Conclusions
We presented an indicator aiming to replicate the behaviour of a zig-zag indicator. While somehow experimental, it has the benefits of being innovative and might inspire users in one way or another.

OH2B Trading Indicator Ver2.0OH2B TRADING INDICATOR
The OH2B Trading Indicator is an indicator built for beginners.
It gives you entry points for BUY and SELL based on Trend Channel and Ema-Crossover.
It also gives you EXIT POINTS for taking profits based on the Average Directional Index and Relative Strength Index.
TRADING WITH OH2B INDICATOR
The OH2B Trading Indicator gives you entry points for BUY or SELL .
When the ema1 crosses above ema2, the trend channel will be painted GREEN in color, and a BUY signal will appear. = BUY
When the ema1 crosses below ema2, the trend channel will be painted RED in color, and a SELL signal will appear. = SELL
When a BUY or SELL signal appears on the chart, don't rush into any trade.
Please allow a few hours for confirmation of signals .
After confirmation, it is suggested to enter 50% first and another 50% near the Trendlines .
After entering a trade, please remember to set a stop-loss alert of an opposite signal.
To TAKE PROFIT , please follow the Triangles indicated on the chart
RED Triangles are the Take-Profit targets for the BUY (long) signal
GREEN Triangles are the Take-Profit targets for the SELL (short) signal
*After taking profit, please set a Stoploss to at least break-even level to protect your profits.
Often the price goes to the Trendlines after the signal, so keep some funds to increase the position or even open all position near the Trendlines , or use it for re-enter with SL after you closed position on TPs.
Setting alerts for Trade
Remember to set an alert so that you won't miss any opportunity.
TradingView will notify you immediately when a new signal pops up on the chart.
Tips for the beginners:
Recommended using the indicator at 1H - 2H Timeframe .
Recommended using the indicator for Spot Trading at both Crypto and Stock Market.
Do not use leverage above 5x.
No more than 5% of the deposit in one trade.
Do not rush into any trade when a new signal pops up, please allow a few hours for confirmation of signals.

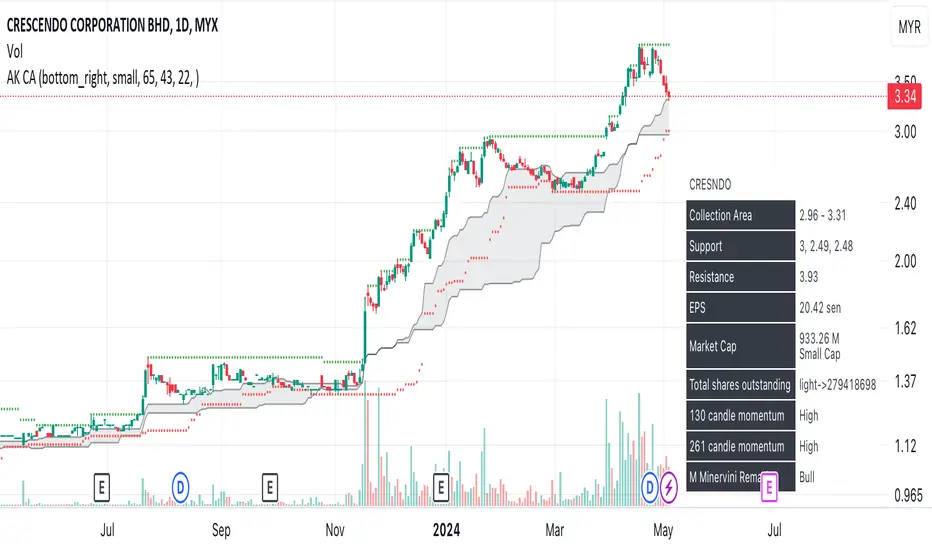
AK collection area- Based on Coach AK formula of determining collection area of retracement stock.
- If price below collection area, collect in tranches.
Relative Channel BandwidthThis indicator uses different volatility channels - Bollinger Band, Donchian Channel and Keltner Channel width to measure volatility.
Indicator plots channel bandwidth percentage with respect to close price.
This is not same as Bollinger Percent B - which is measure of where price is with respect to band. Instead this indicator is similar to ATR Percent indicator published here:
Plotting is color coded to indicate volatility zone:
Red : Extreme volatility
Orange : High volatility
Lime : Low volatility
Green : Extreme low volatility
These levels are again derived by long period bollinger bands

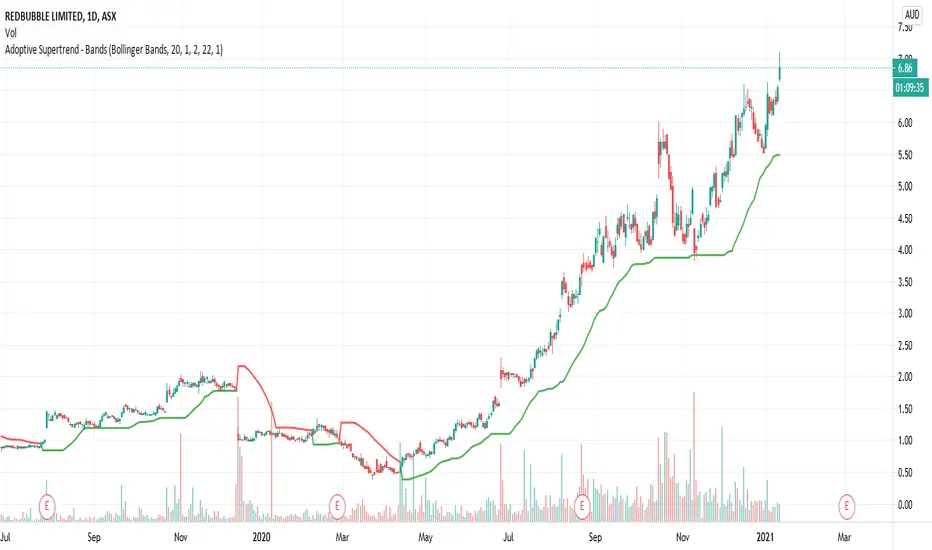
Adoptive Supertrend - BandsAnother adoption of supertrend. This time based on different channels - Bollinger Band, Keltner Channel, Donchian Channel and Pivot point based Donchian channel.
When price hits top of bands, it is considered as start or continuation of uptrend. When price hits bottom of the band it is considered as start or continuation of downtrend. Hence, supertrend is drawn based on these calculations. Use ATR Periods and ATR Multiplier to create stops certain ATR away from band's top and bottom.
Other supertrend adoptions published are here:
Pivot point based donchian channel is published here:

Donchian Channel - Pivot High-LowCombining Pivot High Low and Donchian Channel - both of which are useful indicators for trend following.
Donchian Channel shows highest and lowest prices for X number of bars.
Pivot High-Low identifies when price made new Highs and Lows
Applying Donchian Channel on Pivot High-Low channel, we are plotting highest and lowest pivots formed in X bars.
In this indicator, we have 3 options for Channel Base :
Price : This is regular Donchian channel based on High-Low Price
Pivots : This is Donchian channel based on pivot points.
Combined : Combines both. Takes highest of Price and Pivots for plotting high, lowest of Price and Pivots for plotting low

Donchian DipThe Donchian Dip
This strategy is designed to look for good "Buy the Dip" entries on stocks that are clearly in a strong 1-year upward trend. If you do not know how to identify those stocks on your own please do not use this system or continue your education until you do. The Donchian Dip strategy was designed on the daily time frame but works amazingly well on both daily and weekly timeframes. It does still work on intraday charts also if the current trend on the daily chart is in a strong uptrend.
Chart Setup:
3-period Donchian Channel with a 1-period offset (hide basis)
Bollinger Bands with the default settings of 20/2 (display basis)
Entry Signals:
There are 3 different entry signals that will be printed on the chart that have similar underlying criteria but are ranked based on skill level just like ski slope skill levels! I recommend only taking green entries until you are familiar with the system and the stocks you are trading.
Green Easy Entry:
This is the safest buy the dip entry that is normally found at or near a large retracement bottom. You might get one or two bad entries but be persistent and eventually, a great entry will present itself!
These are the specifics for the conditions that trigger a Green entry if you want to know what they are:
1. The current bar is an up bar (green or white bar) and closed above the lower Donchian channel
2. Previous bar or 2 bars back closed below the lower Donchian channel
3. Previous bar or 2 bars back closed below the Bollinger Band Basis (20 SMA )
4. The low of the previous bar or 2 bars back was below the lower Bollinger Band
Blue Intermediate Entry:
This is a decent entry if you missed the green entry, want to add to an existing position, or are not sure it will pull back far enough to even give a green entry. I would suggest only trade these entries to add to an existing pyramid position or get back into a trade that you were recently stopped out of. However, on high-flying stocks like TSLA these signals and the Black Diamond entry signals might be the only ones you get for a long time. Also, on the weekly chart, Blue or Black entries are sometimes all you will get for a year or more.
These are the specifics for the conditions that trigger a Blue entry if you want to know what they are:
1. The current bar is an up bar (green or white bar) and closed above the lower Donchian channel
2. Previous bar or 2 bars back closed below the lower Donchian channel
3. Previous bar or 2 bars back closed below the Bollinger Band Basis (20 SMA )
Black Diamond Advanced Rule:
This is normally just a small pullback re-entry signal on a strong trending stock like TSLA ...trade with extreme caution!!! You have been warned but daredevils feel free to give it a shot. I sometimes do trade these entries if the market and sector of the stock I am trading are extremely bullish or if I am looking to add to a position but I use a conservative stop.
These are the specifics for the conditions that trigger a Black entry if you want to know what they are:
1. The current bar is an up bar (green or white bar) and closed above the lower Donchian channel
2. Previous bar or 2 bars back closed below the lower Donchian channel
3. Previous bar or 2 bars back closed above the Bollinger Band Basis (20 SMA )
Exit Criteria:
The goal of this strategy is to buy the dip and hold as long as possible...let's practice some Paytience and exercise those holding muscles! RLT!!!
So, we don't want to exit early but we also want to protect our profits somehow. We do this by using the built-in trailing stops that are defined by dots of three different shades of purple on the chart (feel free to change these in the settings). Simply move your trailing stop to the highest current dot price level. Do not move the trailing stop down ever even if a lower dot is printed later. These are simply the suggested trailing stops and definitely use your own judgment for exits but if you backtest this strategy enough you will most likely discover that in the long run, these trailing stops work really well.
I hope this strategy helps you to identify good "Buy the Dip" entries on stocks you love as well as trains you to hold your winners longer for bigger gains.
***HOW TO ADD TO YOUR CHARTS***
1) Click the "Add to Favorite Scripts" button
2) Go to a stock chart and click the "Indicators" icon at the top
3) Next, on the left, click the "Favorites" and then click the "Naked Put - Growth Indicator v2"
4) It should appear on your charts, and you can click the "gear" icon on the study to edit a few settings.
5) Read the release notes above so you understand how it works.

TradeChartist Donchian Channels Breakout Strategy™TradeChartist Donchian Channels Breakout Strategy is the strategy backtester version of ™TradeChartist Donchian Channels Breakout Filter .
===================================================================================================================
Features of ™TradeChartist Donchian Channels Breakout Strategy
========================================================
Option to plot Donchian Channels of user preferred length, based on the Source price in addition to High/Low Donchian Channels.
Generates trade entries based on user preferred Breakout Price. For example, if the user prefers HL2 as breakout price, irrespective of the Donchian Channels type, trade entries are generated only when hl2 price (average of high/low) breaks out of the upper or lower band.
Option to plot background colour based on Breakout trend. The bull zones are filled with green background, the Bear zones are filled with red background and the bar that broke out is filled with orange background.
Option to colour price bars using Donchian Channels price trend. The Donchian Channels basis line is plotted using the same colours as coloured bars as default.
Note: This script does not repaint. To use the script for trade entries, wait for the bar close without Backtester or Strategy entries (with Backtester) and use a second confirmator (includes fundamentals) based on asset type as some markets require users to have good pulse on the fundamentals as trading by Technicals/price action dynamic alone may not be safe.
Note: Trend Based Stochastic of the same DC Length can be used from ™TradeChartist Risk Meter for Trade Confirmations too.
===================================================================================================================
Best Practice: Test with different settings first using Paper Trades before trading with real money
===================================================================================================================
This is not a free to use strategy. Get in touch with me (PM me directly if you would like trial access to test the strategy)
Premium Scripts - Trial access and Information
Trial access offered on all Premium scripts.
PM me directly to request trial access to the scripts or for more information.
===================================================================================================================

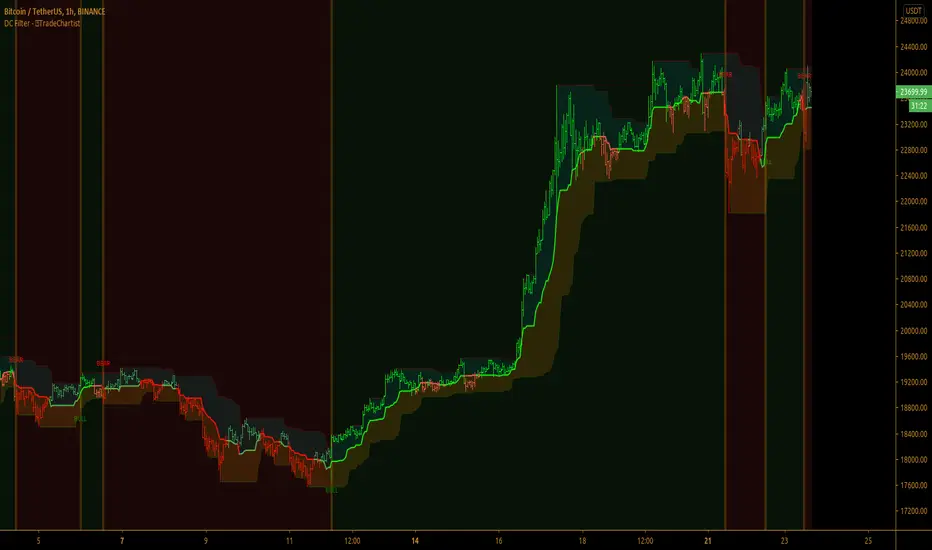
TradeChartist Donchian Channels Breakout Filter™TradeChartist Donchian Channels Breakout Filter is an elegant version of the classic Donchian Channels with few extra variations and option to filter breakouts based on user preferred Breakout price selection to generate Trade Entries.
===================================================================================================================
Features of ™TradeChartist Donchian Channels Breakout Filter
======================================================
Option to plot Donchian Channels of user preferred length, based on the Source price in addition to High/Low Donchian Channels.
Generates trade entries based on user preferred Breakout Price. For example, if the user prefers HL2 as breakout price, irrespective of the Donchian Channels type, trade entries are generated only when hl2 price (average of high/low) breaks out of the upper or lower band.
Option to plot background colour based on Breakout trend. The bull zones are filled with green background, the Bear zones are filled with red background and the bar that broke out is filled with orange background.
Option to colour price bars using Donchian Channels price trend. The Donchian Channels basis line is plotted using the same colours as coloured bars as default.
Alerts can be created for long and short entries using Once per Bar Close .
Note: This script does not repaint . To use the script for trade entries, wait for the bar close and use a second confirmator (includes fundamentals) based on asset type as some markets require users to have good pulse on the fundamentals as trading by Technicals/price action dynamic alone may not be safe.
===================================================================================================================
Best Practice: Test with different settings first using Paper Trades before trading with real money
===================================================================================================================
This is not a free to use indicator. Get in touch with me (PM me directly if you would like trial access to test the indicator)
Premium Scripts - Trial access and Information
Trial access offered on all Premium scripts.
PM me directly to request trial access to the scripts or for more information.
===================================================================================================================
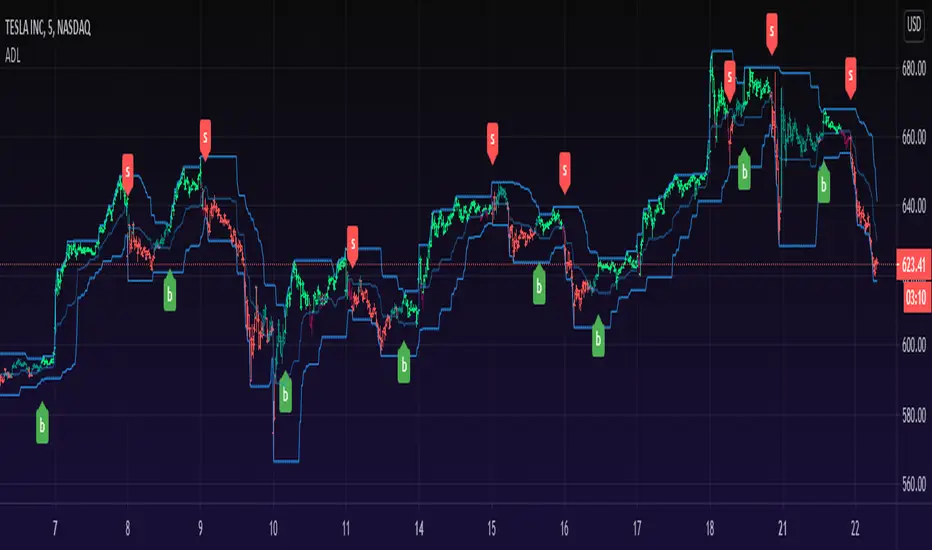
Adaptive Donchian LinesThe Adaptive Donchian plots a line based on the average of the lowest low and highest high. I call it 'ADL'.
Maximum/Minimum lookback period defines the range where the adaptive length can move.
When the asset velocity increases the indicator shortens its lookback period.
When the asset velocity decreases the indicator lengthens its lookback period.
The higher value 'Percent of change' is, the more adaptive it will be, hench, Adaptive Donchian sensitivity increases to velocity changes.
You can select from two different types of signals "Above or Below Middle Line" and "Touching Bands".
"Above or Below Middle Line" gives a Buy signal if LOW is crossing over the middle line and Sell signal if HIGH is crossing under the middle line.
"Touching Bands" gives Buy signal if HIGH touches the upper band and Sell signal if LOW touches the lower band.
== Color for "Touching Bands" ==
Green: Low is above center line - Up trending.
Lighter Green: Close is above center line but Low is still below H/L line - Weaker up trend.
Red: High is below center line - Down trending.
Lighter Red: Close is below the center line but High is still above H/L line - Weaker down trend.
== Color for "Above or Below Middle Line" ==
Green: Low is above center line - Up trending.
Red: High is below center line - Down trending.
== Notes ==
Bar coloring is disabled by default.
Middle line can also act as a stop loss.
Like if you like and Enjoy!
Code is currently closed as it needs more cleaning and updates.
Feel free to comment and Follow to stay updated with upcoming scripts: www.tradingview.com
TrendLine ChannelsAbstract
This script provides a set of Trendline Channels which can be tighter than Donchian Channels.
This script computes the most suitable active upper and lower trendlines and updates them as soon as possible.
We can use it for breakout signals earlier than Donchian Channels.
Introduction
Channels are tools which can mark area of values of ranging markets.
Once the price leaves the original region, range traders may start admitting they are wrong and trigger trend.
Donchian Channels (misheard as Dungeon Channels) use the highest and the lowest price to define area of values.
When the price breakouts, it just like it got released from a dungeon.
However, waiting for the price making even higher or lower may be too late and risk reward ratio may be lower.
Trendlines can make the channels tighter and we can find earlier breakout signals.
Computing Trendline Channels
(1) Find the most active trendlines
In this script, a valid trendline connects two high values or two low values.
A high value means the highest value in a trading day.
A low value means the lowest value in a trading day.
In this script, every trendline does not crossover any bar but can exactly touch them.
The most flat trendline is taken. (one for upper and one for lower)
(2) Continue to use or Change a trendline
If there is a tighter trendline available, this script changes to use it.
If the previous active trendline is broken, this script re-computes the trendline available.
When this case happens, this script display with an another color.
Otherwise, this script continues using the previous trendline.
(3) Middle line
The middle line indicates the middle value between the upper and the lower.
Parameters
Length : how many days are used for computation. The default value is 16 just because 16=4*4, using binary characteristic.
x_go_on : If the previous trendline is not breakout and there are no tighter trendlines available, we continue use it.
Color Options
(1) Upper trendline (no update or tighter)
(2) Upper trendline (changed due to breakout)
(3) Middle line
(4) Lower trendline (no update or tighter)
(5) Lower trendline (changed due to breakout)
Conclusion
Trendline Channels can be tighter than Donchian Channels and evaluate earlier breakout signals.
Comparing to known auto trendline scripts, Trendline Channels is continuous.
Once a trendline is broken, Trendline Channels can instantly point out the next available one.
If you think the price movement is boring or you cannot have good risk reward ratio, you can go to an another timeframe.
Reference
How to trade with Donchian Channels
How to trade with Trendlines

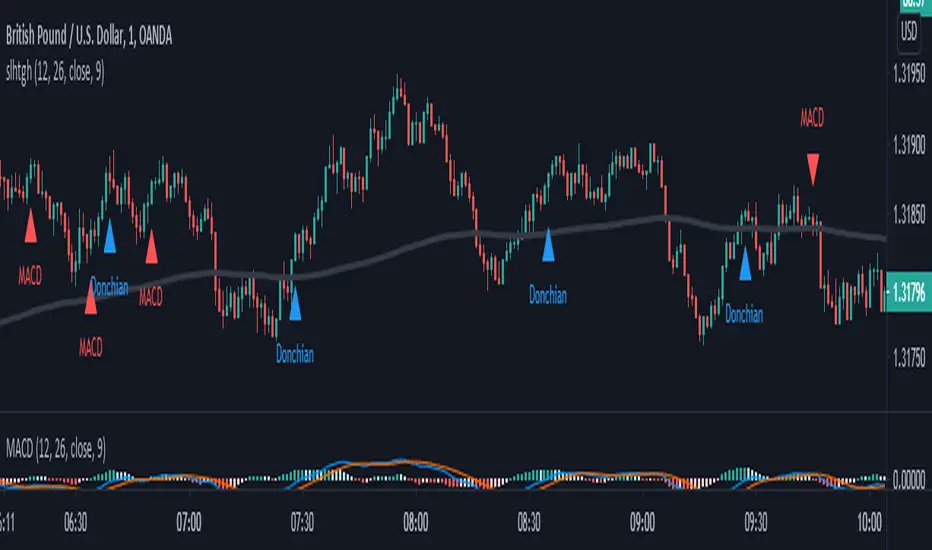
SALEH MACD Donchian + EMA & MACD + ADXI gathered all the signals coming from the MACD & Donchian channels indicators and filtered them with EMA 200 or ADX > 25 indicators (which both of them show the trend),
and put them on the chart to show me the buy and sell signals;
the signals rules are as following:
BUY:
when we have an uptrend ( the price is above the EMA 200 or ADX > 25 ) & the macd line cross up the signal line while they are both under the 0 level of histogram it generates buy signals.
SELL:
when we have a downtrend ( the price is below the EMA 200 or ADX > 25) & the macd line cross below the signal line while they are both above the 0 level of histogram it generates sell signals.
Donchian channel works as a confirmation for the macd signal.
this signals work best at London session, you can also filter them by chandelier exit indicator.

Donchian Ichimoku HybridWhat if we took the best elements from the Donchian Channel and the Ichimoku cloud and combined them into a complete system?
Strengths of the Donchian Channel:
-Dynamic support and resistance
-Measures volatility
Strengths of the Ichimoku Cloud:
-Can detect when price is trending vs ranging
-Retracement zones
-Trend identification
=== HOW TO USE THE INDICATOR ===
Green and Red bars are when price is trending. Green for trend up, Red for trend down.
Gray bars are when price is in a trading range. You can either play the edges or wait until price is trending again.
The clouds are retracement zones for pullbacks when price is trending.
Alerts are set up for when price starts to trend and starts a trading range.
=== MISC ===
Option for Dark Mode
Slow and Fast TurtleThis script is based on the famous turtle strategy with add on cha stop.
- Fast Buy triggered when price cross upper DC 20.
- Slow Buy triggered when price cross upper DC55.
- There is 2 lines (black line) which is Stop Line and Average Up line.
- Stop when price close below Stop Line and Average Up when price close above Average Up line.
- There is 2 Sell signal which is Fast Sell and Slow Sell. Fast Sell triggered when price close below than lower DC 10 and Slow Sell triggered when price close below than lower DC 20.
- Cha stop is also sell signal which is triggered when close price is lower than lowest 2 days before.

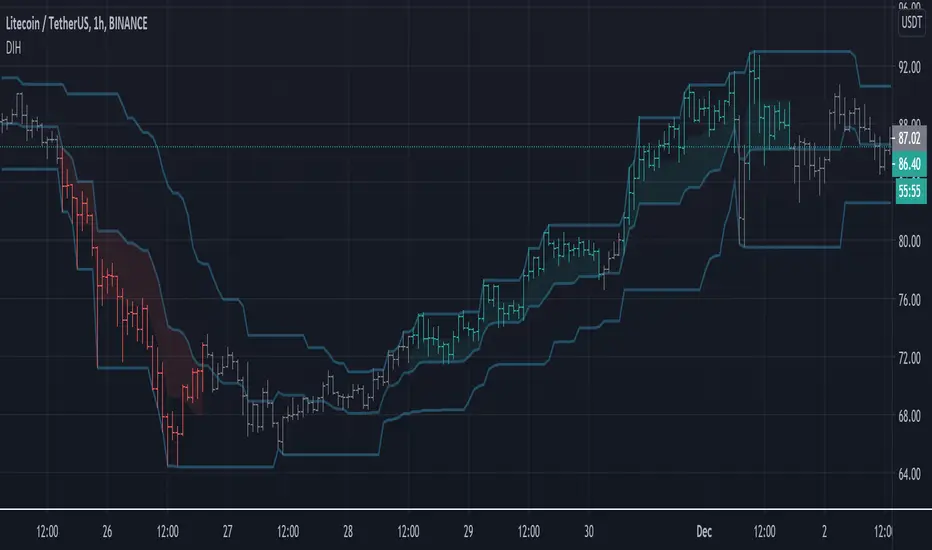
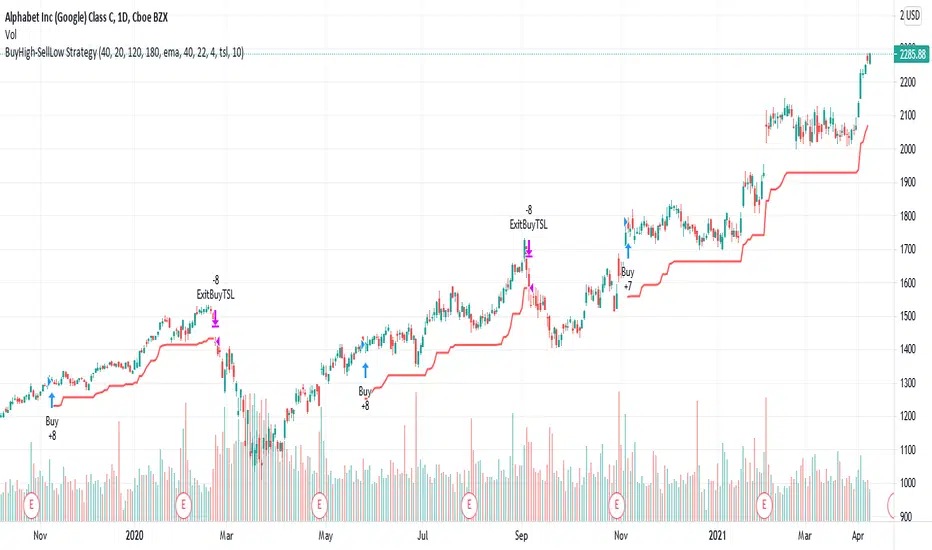
BuyHigh-SellLow StrategyYeah. You read it right. It's not a mistake. It is buy high and sell low strategy.
Main entry condition is to buy when price hits 40 day Donchian channel top. This is combined with my other regular filters which are aligned moving average and new high/low filter and yearly high/low filter.
Exit condition can be based on two things:
Donchian channel : Set appropriate DonchianExitLength. Lower line of donchian channel acts as trailing stop.
ATR Based trailing stop : Select appropriate ATR multiplier and length.
What a surprise!! You can buy high, sell low and still make money.
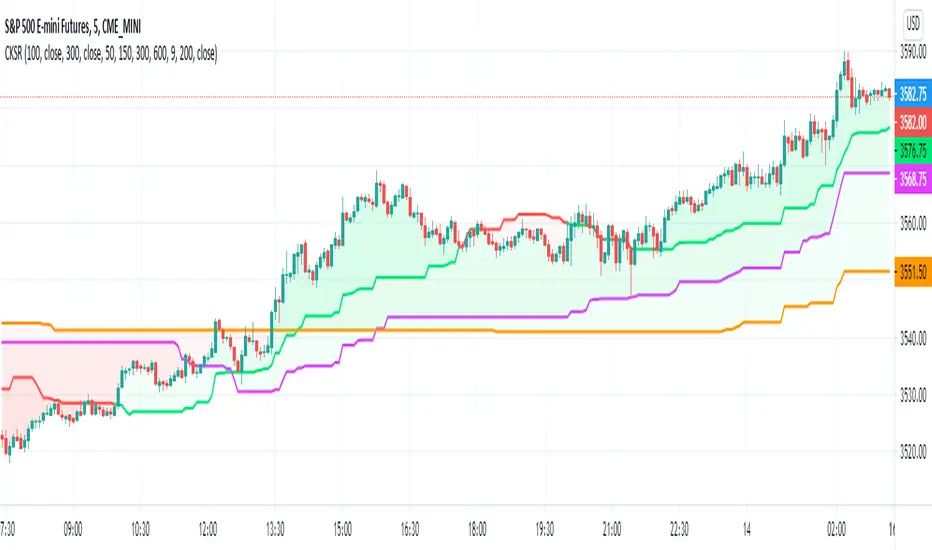
Step RiderRelease Note:
Idea of this script is to ride on the trend. Multiple dynamic support and resistance are identified and those levels are used
Step Lines:
There are 3 different periods by default are used to define 3 different step lines. On any trend, either of these 3 steps shall play major role
Color Strength:
Change in Red & Green color and its thickness changed based on how strong the up or down trend is.
Disclaimer:
//Disclaimer: Idea of publishing this script is to identify the strength of the instrument using multiple confirmation.
//Disclaimer: Using this indicator, changing inputs, and trading decisions are up to the users/traders.
//Courtesy: Thanks to Richard Donchian, Alan Hull as this indicator/script inspired by Donchian Channels, Hull Moving Average
SALEH All in One Strategythis script is based on MACD strategy
for MACD:
when we have an uptrend ( the price is above the EMA 200) & the macd line cross up the signal line while they are both under the 0 level of histogram it generates buy signals.
when we have a downtrend ( the price is below the EMA 200) & the macd line cross below the signal line while they are both above the 0 level of histogram it generates sell signals.
donchian channel works as a confirmation for the macd signal.
this strategy works best at London session.
feel free to comment
best regards Forexsquad2020
Donchian BlasterRelease Note:
Keeping in mind of getting full potential of Donchian Channels, As part of this script, Linear Regression is used as primary source to identify trend and execute the trades.
Hull Moving Average given as alternative option in place of Linear regression.
Linear Regression:
Linear regression used to identify trend, trade setup, and stop. Based on this, Color fillings on Donchian channels is updated. That will give clear idea of strength or weakness in any trading instruments.
HMA:
HMA used as alternative to identify trend, trade setup, and stop. Based on this, Color fillings on Donchian channels is updated. That will give clear idea of strength or weakness in any trading instruments.
Donchian Channels:
As it is one of the oldest trend riding system, combined here with differentiation in color will help to go with the trend.
Inputs:
Input periods can be changed by users/traders as per their understanding and observations.
//Disclaimer: Idea of publishing this script is to identify the strength of the instrument using multiple confirmation.
//Disclaimer: Using this indicator, changing inputs, and trading decisions are up to the users/traders.
//Courtesy: Thanks to Richard Donchian, Alan Hull, and author of LSMA as this indicator/script inspired by Donchian Channels, Hull Moving Average, and LSMA
2HLA very simple, almost naive strategy, in which you buy on the lowest of the two previous candles and sell at the highest of the two previous candles. You can configure these highest and lowest lenght, in some assets two is too small of a number to make profit. You can also configure to exit the position after X, and I found that 7 (which is a week of working days) is a good number for that.
This is strategy is intended to be used as a swing trade. Your capital needs to be high enough so that it can pay the operaitonal costs, and reach it's target with a reasonable profit.
Since this is a volatility based strategy, assets that are more liquid won't work properly.

[M2J] Indicator | Turtle Atom Duck Signal Turtle Atom Duck shows potential buy and sell
It consist of 3 indicators
Turtle - Donchian Channel
- bullish when price close above previous 1 bar high
- bearish when price close below previous 1 bar low
Atom - Bollinger Band
- bullish when price close above upper band
- bearish when price close below lower band
Duck - Moving Average (Default 50-period EMA)
- bullish when price close above moving average
- bearish when price close below moving average
When all 3 are bullish, buy signal appears
When all 3 are bearish, sell signal appears
Screener Turtle Atom Duck
Example:
FBMKLCI
Technology Sector
Health Sector
TOPGLOV
BINTAI
XOX
PRLEXUS
JCY
EURUSD
XAUUSD

Donchian Channels Strategy - Long Term TrendFor Educational Purposes. Results can differ on different markets and can fail at any time. Profit is not guaranteed.
This only works in a few markets and in certain situations. Changing the settings can give better or worse results for other markets. This is a longer term trend following strategy that uses Donchian Channels for trend following and uses the upper and lower bands to find price breakouts to enter the market and then uses the middle band as a trailing stop to exit. DCs are known as the original trend following strategy made by Richard Donchian.
Usually the middle band uses the same length of the upper and lower bands in its calculation but I included the default option of using a middle band that is double the length of the other bands, but also an option to use the regular input length that most Donchian strategies use if needed. If long term trends are somehow found, this longer middle band lets the profits run longer and lets you see where the long trends were at if the market had any. The double lengthed middle band looks surprisingly very similar to a 3x ATR trailing stop, which is the recommended setting Wilder suggested for trend following. If a good ATR stop or other trailing stop can't be found, this longer middle band can act as a substitute for it.
For some reason I can't seem to find anything related to Donchian strategies on here despite the popularity and simplicity of it, not even a single working one to my liking, so I made my own. It seems this strategy only works in trending markets. I intentionally handpicked a market that the backtest does well on to illustrate the potential it might have for other markets where trending following strategies might work on and what to expect the results in those might be. Trend following strategies are said to have high profits but at the same time lower accuracy due to the failure rate of being able to catch the right trend. If you all got any suggestions or feedback please let me.
