Lagged Donchian Channel + EMAThis strategy is based on a lagged 24 periods Donchian Channel and a 200 periods EMA .
The enter positions are calculated this way :
Bull entry
1. we wait for the close of a candle below the channel and it must be below the 200 EMA
2. the following candle must be a green one and close in the lagged channel
3. we put a long order at the close of the second candle, a stop loss at the low of last 3 candles and a x3 take profit
Bear entry
1. we wait for the close of a candle above the channel and it must be above the 200 EMA
2. the following candle must be a red one and close in the lagged channel
3. we put a short order at the close of the second candle, a stop loss at the high of last 3 candles and a x3 take profit
For both long or short positions :
If the order is not filled, it's cancelled if the price reach 50% of the TP or if the price reach the stop loss level
The position is closed if a new bear/bull condition appears in the other side of the position (if a bear appears when you're long and inversement)
Features :
Position calculator's included with leverage option
Labels of position can be plotted or not
Bull/Bear channels can be plotted with red and green filled
All parameters can be changed for backtesting
Better results have been got with defaults parameters on LTCUSDTPERP in H1 timeframe => profit factor of 2.84 with almost 100 positions.
Hope this strategy will be useful and it would be cool if I could get feedback, comments or better combinations of parameters !!
Don't hesitate to like and leave a comment ;)
@Mysteriown
Canali Donchian (DC)

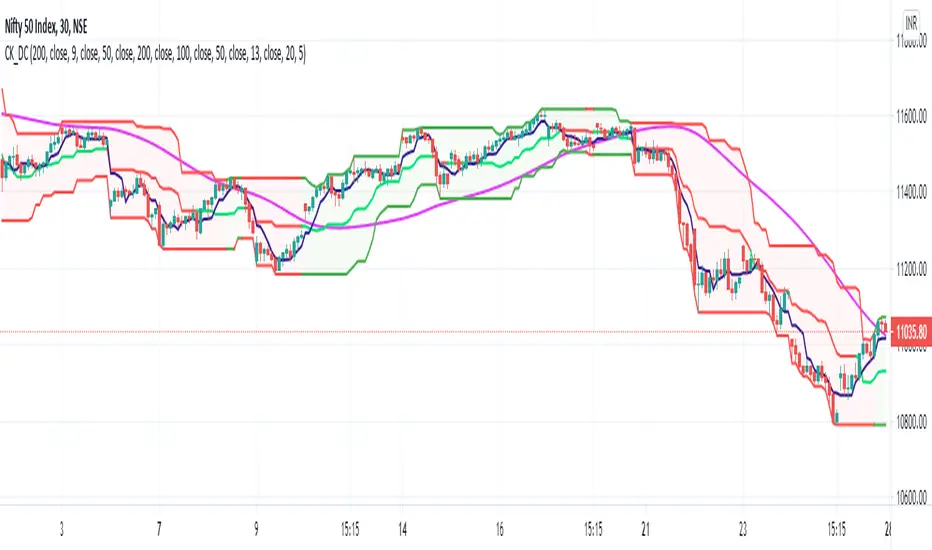
Modified Donchian ChannelRelease Note:
This indicator setup highly inspired by Donchian Channel and Hull Moving Average. Big thanks to both Richard Donchian and Alan Hull.
Back test and live test it and come to conclusion of how to use this indicator for live trading.
200 HMA:
200 Hull Moving Average plays major role in deciding the right trades using Donchian Channel. As part of this setup,
If price is below 200 HMA, then the Donchian Channel is highlighted in Red color
If price is above 200 HMA, then the Donchian Channel is highlighted in Green color
Donchian Channel:
Default 20 period is used for the Donchian channel. However, the color highlight as per 200 HMA position. Also, the middle basis color changes to Green and Red based on candle close of above or below.
Additionally, 5 period Donchian basis is used as tight stop loss. This can be used wisely or optionally based on trade decisions
Disclaimer:
//Idea of publishing this script is to identify the strength of the instrument using multiple confirmation.
//Using this indicator, changing inputs, and trading decisions are up to the users/traders.
//Courtesy: Thanks to Richard Donchian and Alan Hull as this indicator/script inspired by Donchian Channels and Hull Moving Average
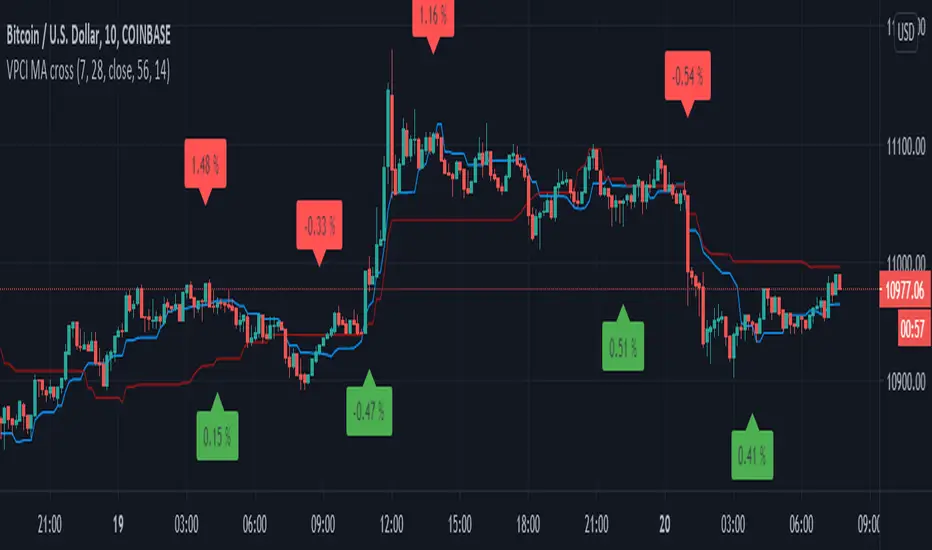
VPCI MA cross [LM]Hello guys,
I would like to introduce you a script that combines two indicators: VPCI( volume price confirmation indicator) and donchian MAs
VPCI:
Fundamentally, the VPCI reveals the proportional imbalances between price trends and volume-adjusted price
trends. An uptrend with increasing volume is a market characterized by greed supported by the fuel needed to
grow. An uptrend without volume is complacent and reveals greed deprived of the fuel needed to sustain itself.
Investors without the influx of other investors ( volume ) will eventually lose interest and the uptrend should
eventually breakdown.
A falling price trend reveals a market driven by fear. A falling price trend without volume reveals apathy, fear
without increasing energy. Unlike greed, fear is self-sustaining, and may endure for long time periods without
increasing fuel or energy. Adding energy to fear can be likened to adding fuel to a fire and is generally bearish
until the VPCI reverses. In such cases, weak-minded investor's, overcome by fear, are becoming irrationally
fearful until the selling climax reaches a state of maximum homogeneity. At this point, ownership held by weak
investor’s has been purged, producing a type of heat death capitulation. These occurrences may be visualized by
the VPCI falling below the lower standard deviation of a Bollinger Band of the VPCI, and then rising above the
lower band, and forming a 'V' bottom.
I have used MA's on top of VPCI and looking for crosses. Percatage that is shown in label is calculation of difference between previous cross and current close price. So you know if you would be flipping what % you would gain or loose, all is rounded with precission of two
DONCHIAN
I took donchain calculation from ichimoku to calculate conversion line and base line(both are giving me information about whether it's trending or not and distance from the mean)
There are various sections in setting:
VPCI - setting of MA lengths(for smaller timeframes I recommend using bigger MA length)
DONCHAIN - setting length for conversion and base line
Any suggestions are welcome
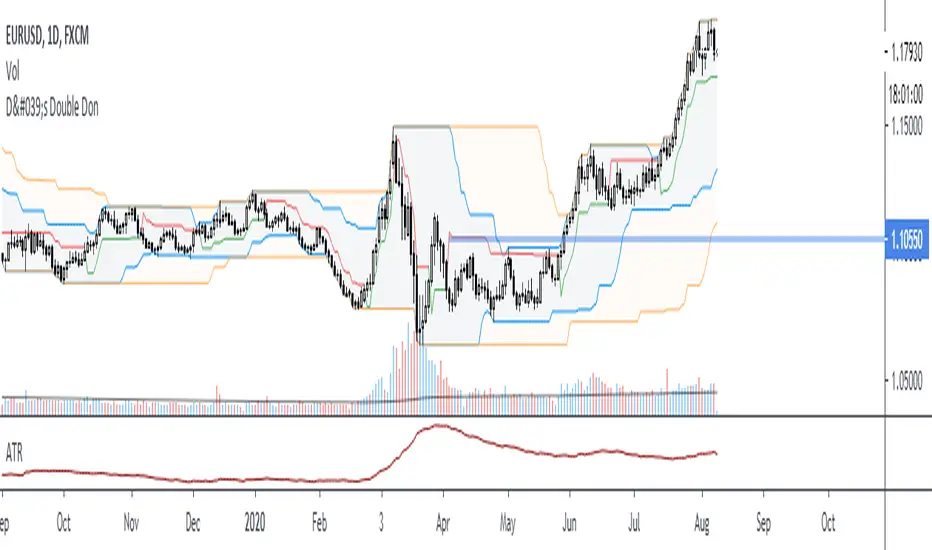
Double Donchian, Double Keltner, no-overlayThis is rather an educational script on how you can put multiple channels on the chart in a relatively non-confusing manner. Because it can be done doesn't mean you should do it (especially as a beginner). However, you might want to use maybe two.
Normally, TradingView would put them all over each other causing chart to lose readability. By a few clever conditions, higher timeframe KC does draw on the chart only if it is outside lower timeframe KC. Lower timeframe Donchian is 99,5% outside both Keltner Channels, and it will not show if it overlaps at any point. Higher TF Donchian ale two lines but no background.
Keltner channel 1 uses original settings
Keltner channel 2 uses TradingView default settings
Donchian 1 uses TradingView default
Donchian 2 uses 60 periods used by Turtles if I remember it correct
Have a great trade!

Different Donchian PeriodsHi!
This is a very simple script that I couldn't find on TradingView yet. Look at this indicator how you want (band, cloud, ma's) and create your own settings, I did not test it.
Normally, Donchian average calculates the average(middle) of the highest point of a given period and the lowest point of that same period.
Here I use two separate periods, one for highest, a different one for lowest. That's it :)
Let me know if it's useful to you, I appreciate your comments.
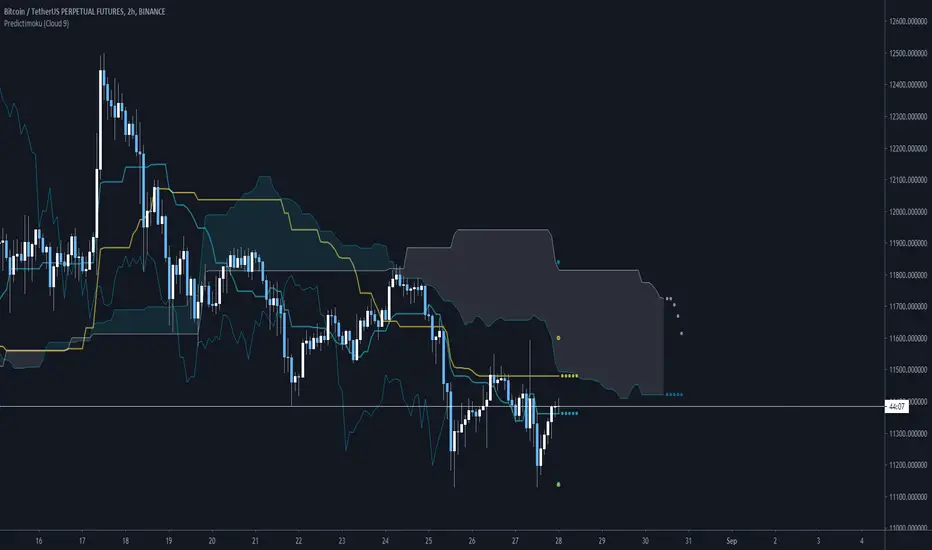
Predictimoku (Cloud 9) - Modified Ichimoku by Cryptorhythms [CR] Predictimoku (Cloud 9) - Modified Ichimoku by Cryptorhythms
📜Intro
New spin on the old standby ichimoku!
Predictimoku (Cloud 9): This indicator uses a proprietary algo to forecast the kijun tenkan & senkou spans accurately out into the future.
📋Background
Unfortunately you may have seen it around twitter as part of a paid for course with indicator set. These influencers claim its "their proprietary indicator". Well the truth is that the source code was stolen from me without payment by some folks who will remain nameless... Then they published the indicator as a private script to avoid moderation/ban (cowards!)
Lesson learned... this is why you never trust anyone until the money is in your hand. And if you see the indicator in the wild as part of some "guru's" overpriced course you will know who the thieves are!
But I wouldnt let that injustice or their shady behavior stand. So that now means you all will get access to it because I am providing it free for the public! :)
📋Features and How to Use
You use this indicator in all the same ways as you would use traditional ichimoku, the underlying structure is the same. Though the default settings are using doubled lookback lengths as per "crypto standard."
The extra functionality comes in the form of accurate and non repainting forecast of up to 17 bars for the kijun, tenkan and senkou spans! This can be useful in many ways for instance it can show you ahead of time when a kumo twist will happen, or a tenkan/kijun cross, etc!
💠Here is an example of the 17 bar forecast:
💠Here is an example of the Trading Range option to show you where price would need to go to force a recalculation of the forecasts. It also provides areas of interest for PA reactions.
💠Last an example of the fibonacci spread. By default the Auto Fib's lookback length is set to 60 to match the kijun lookback. This generally produces a nice framework for near future price action.
💠Look for some more new and unique ichimoku based indicators coming soon from us! :)
About Us
👍 We hope you enjoyed this indicator and find it useful! We post free crypto analysis, strategies and indicators regularly. This is our 84th script on Tradingview! Check signature for more information.
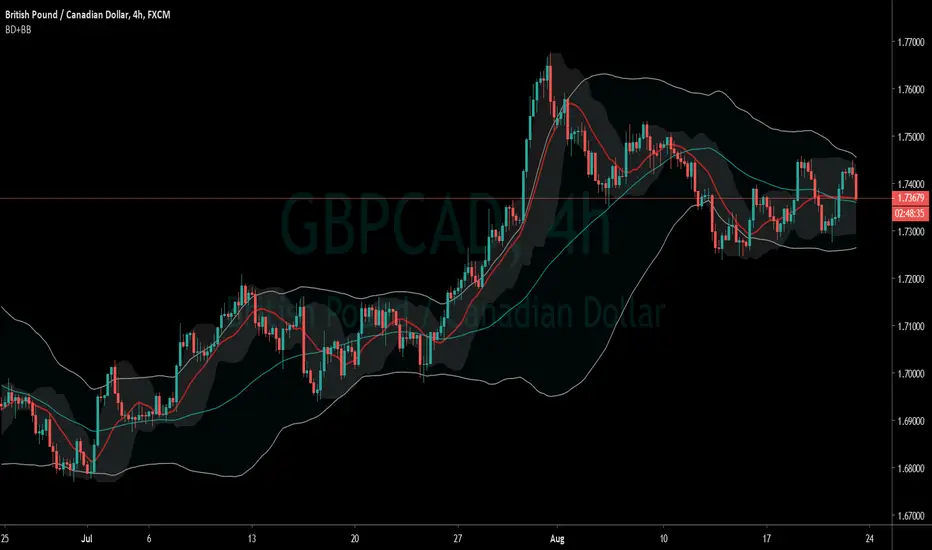
Bollinger/Donchian + BollingerA mixture of A Bollinger and fork from Ricardo Santos Donchian/Bollinger(DBH). Looks Nicer on a higher time frame, 4hr+. Default of DBH is 20, but 13/15 looks clearer to me.
GM All-purposeThis script plots multiple EMA's also it shows you when a particular EMA crosses up or below another EMA. You can customize the EMA's based on your setups or preferences.
This script basically will help you easily identify when a particular EMA has crossed over or crossed under another EMA at one glance.
Particularly useful when there is a lot of entanglement of the EMA's
There is also dual Bollinger Bands & Donchian Channels that are available to check the volatility of that particular scrip, which will help you stay in the trade or exit based on your criteria.

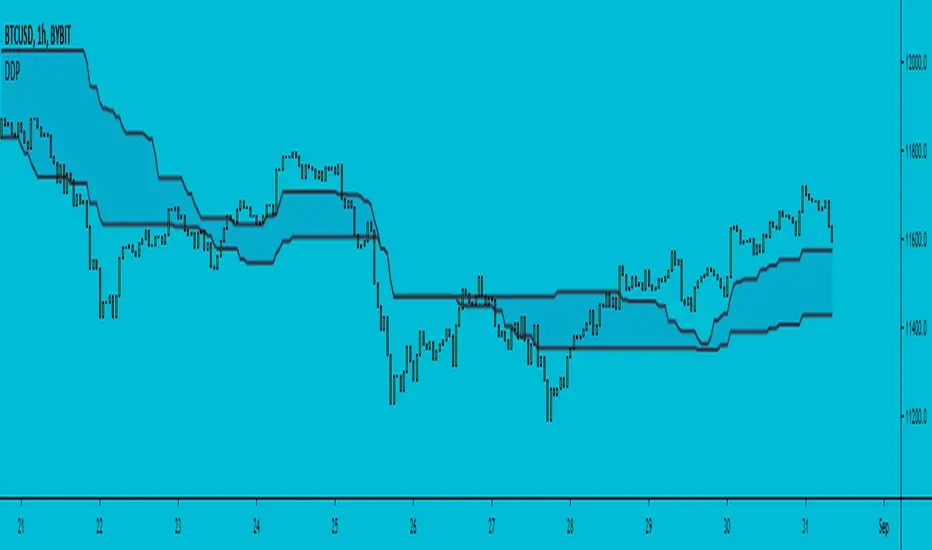
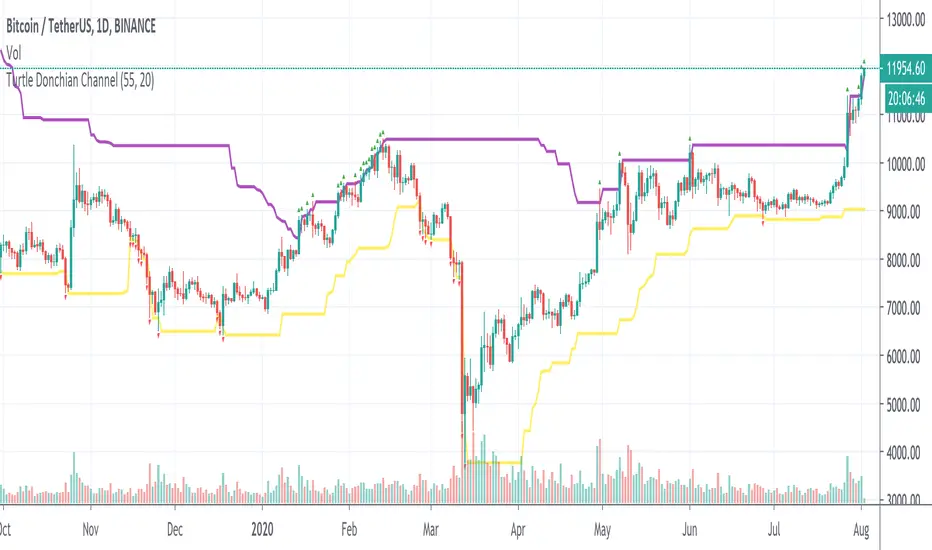
Weeknights Donchian CloudDonchian Channel Trading system visualised as a cloud.
Regular/Quick inputs;
Length: 20
Entry Length: 20
Stop Length: 10
Alternate/Slower Inputs;
Length: 55
Entry Length: 55
Stop Length: 20
For a more in-depth review, look up "Turtle Trading" rules
The simplest way to use the cloud;
-When the cloud flips from above to below (support), close any shorts and open a long
-When the cloud flips from below to above (resistance), close any longs and open a short
-Cloud is flipped based on a breakout on the high / low
-Most effectively used on the daily, but can be used on any time frame
-For traditional markets, an input of 20 is most commonly used
-For 24/7 markets, an input of 28 is most commonly used
-Find an input that makes the most sense to you!
I appreciate any feedback, feel free to message me on twitter / comment!
Twitter ; @ImWeeknight
Credit to user KivancOzbilgic for helping with the script
Double Donchian with ATR StopBrief:
Default Small Donchian period : 20 for D,W,M and 9 for smaller timeframe (1)
Default Big Donchian period : 50 for all timeframe
Default ATR Stop: 2ATR
Settings:
Donchian Settings : it does nothing but tell you that below is Donchian Settings
- Show Basis: show donchian basis line or not, default is no
- Background: show donchian's background or not, default is yes
...
- Show "xxx" : show donchian's "xxx" or not, default is yes
- Smalldon : Smaller Donchian's period : if it's "0" then it use (1) as default, if you want to change the period, change the "0" with the number you want, then (1) will no be applied.
- Bigdon: Bigger Donchian's period: change as you want
ATR Settings
ATR period & ATR multiplier too easy to have a manual.
Donchian Channels Modified This indicator gives a Donchain Channel with different upper and lower limits, Use wisely.

Channel Break [for free bot]I present to you a script for testing the channel breakout strategy for the Bitmex exchange.
Cryptocurrency itself is a trending tool, which is why breakout strategies generate the largest profits, and the channel breakout strategy is one of the most effective trend strategies.
The optimization result shows the result of trading on a volume of 20% of the deposit. But since Bitmex trades in futures contracts, you can use 50%, 100% and even much more, depending on your attitude to risk.
At the time of publication on the Bitmex exchange there are 12 different contracts, i.e. You can diversify your trading well (by pre-optimizing the settings for each contract).
In the script, you can set up many trading options - timeframe, periods for buying and selling, method of exiting a trade, stop loss, take profit, risk management, etc.
Thus, you create a strategy "for yourself".
Представляю Вам скрипт для тестирования стратегии пробоя канала для биржи Битмекс.
Криптовалюта, сама по себе является трендовым инструментом, именно поэтому, пробойные стратегии генерируют самую большую прибыль, а стратегия пробоя канала – является одной из самых эффективных трендовых стратегий.
На результате оптимизации показан результат торговли на объеме в 20% от депозита. Но так как на Битмекс торговля идет фьючерсными контрактами, Вы можете использовать 50%, 100% и даже намного больше, в зависимости от Вашего отношения к риску.
На момент публикации на бирже Битмекс есть 12 разных контрактов, т.е. Вы можете хороши диверсифицировать свою торговлю (предварительно оптимизируя настройки по каждый контракт).
В скрипте Вы можете настроить множество вариантов торговли - таймфрейм, периоды для покупки и продажи, метод выхода из сделки, стоп-лосс, тейк-профит, рискменеджмент и т.п.
Таким образом Вы создаете стратегию "под себя".

Turtle Donchian ChannelDonchian channel with Turtle trading style: buy long when price is higher than high 20 candles (green up arrow), and sell short when price is lower than low 10 candles (red down arrow).
[RS]Standardized Trend Mapnothing excessively new here..
a map of standardized trend over multiple lengths, extra parameter for smoothing the input source(close) will remove noise.

Donchian Strat EXMOThis is simple test of Turtle Trading strategy by Richard Dennis. The script meant to place orders on Donchian Channel borders. It's best to test and use on mid-term charts like 1H and more.
I've chosen Kraken XBT/USDT chart because this market opened in december 2019. The main problem of crypto trading strategy testing is the bullish market of 2017 year. That enormous growth gives unrealisting expectations to all trend-following strategies tested.

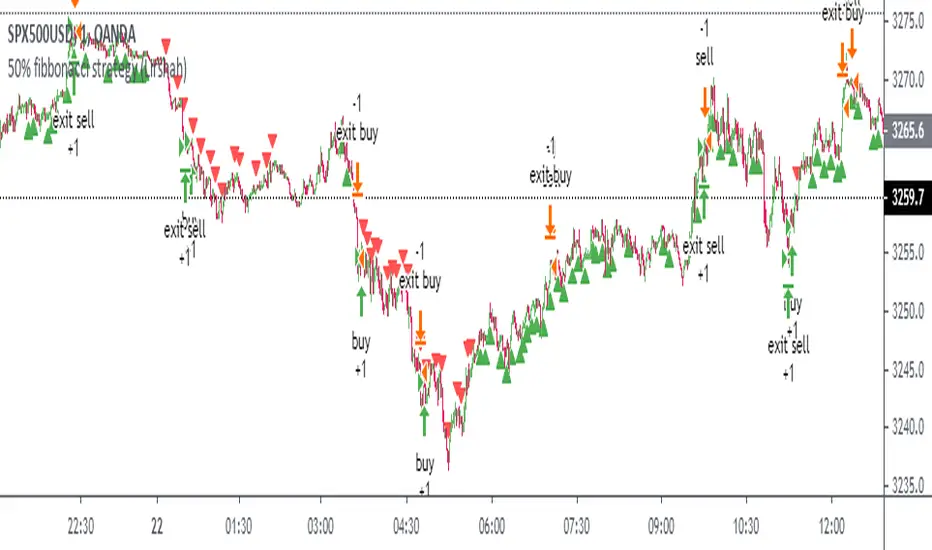
50% fibbonacci strategy (Lirshah)50% Fibonacci is driven from long term average price action in combined with pivot point.
the strategy trigger buy signal when its on uptrend long term and buy on pivots.
the similar scenario for sell signals.
the strategy has good results on indices and some forex pairs.
the parameter are as below:
1)last bar calculation
2)pivot point
3)take profit
4)stop-loss
the below is results of 1 contract wall street index on 5sec time frame without calculation of commission.
in order to access scripts contact me directly.
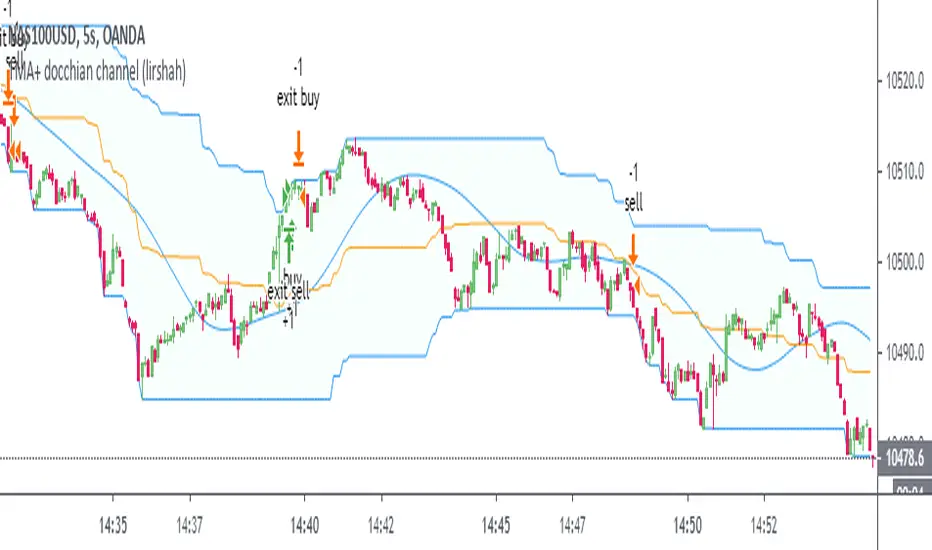
TMA+ docchian channel (lirshah)this strategy is based on combination of donchian channel and TMA moving average.
buy signals triggers when TMA crosses average line of donchian channel and similar for selling position.
the standard parameters are a below:
donchian channel length: 55
Tma length: 20
the results of overview on germany index (1 contract+ 2$ commissions per order) is as below.
in order to access scripts contact me directly
Donchian Trend RibbonHello Traders,
I think you all know Donchian Channels. so I am not going to write about it.
With this indicator I tried to create Donchian Trend Ribbon by using Donchian Channels.
How it works ?
- it calculates main trend direction by using the length that is user-defined. so you can change it as you wish
- then it calculates trend direction for each 9 lower lengths. if you set the length = 20 then the lengths are 19, 18,...11
- and it checks if the trend directions that came from lower lengths is same or not with main trend direction.
- it changes the trend color of the ribbon.
-
Warning: Entry points may also represents trend reversal. So you should use stoploss line if you decide to take buy/sell positions.
P.S. I didn't backtest it, it's non-repainting, it should be used educational purposes only.
Published by user request. You may want to see following one:
Enjoy!

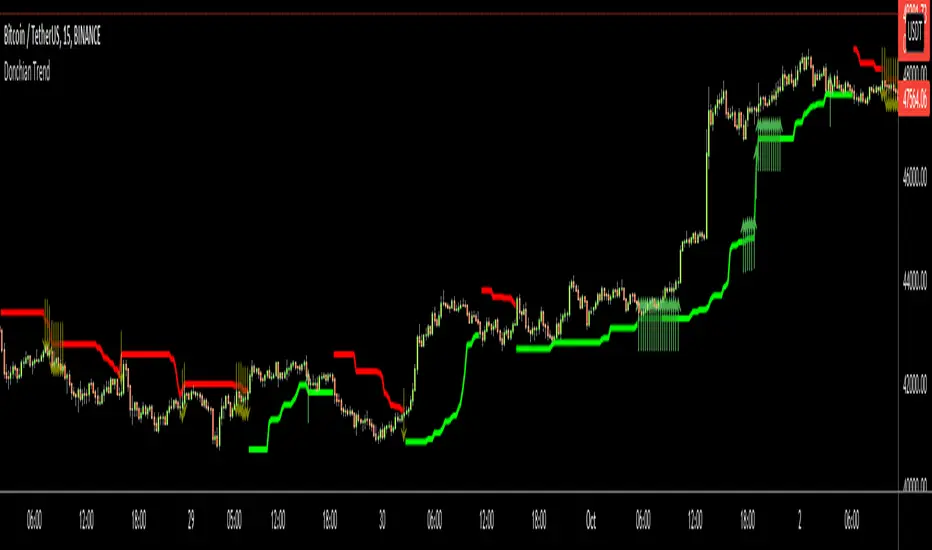
Donchian TrendHello All,
I think all of you knows Donchian Channels . so I am not going to write about it.
With this indicator I tried to create Trend Lines by using Donchian Channel upper/lower bands. I tried add possible entry levels as well.
How it works ?
- it calculates main trend direction by using the length that is user-defined. so you can change it as you wish
- then it calculates trend direction for 9 lower lengths. if you set the length = 20 then the lengths are 19, 18,...11
- and it checks if the trend directions that came from lower lengths is same or not with main trend direction.
- it changes the trendline color. lighter trend line means stonger trend, darker trend lines means entry points or possible trend reversal.
- it puts entry points by using trend directions that were created by using lower lengths. it gets entry points if high/low touches main trend line as well.
Warning: Arrows are entry points but it may also represents trend reversal. So you should use stoploss line if you decide to take buy/sell positions.
P.S. I didn't backtest it, it's non-repainting, it should be used educational purposes only . I believe it can be improved, so I am open for new ideas to improve it ;)
Enjoy!
VT SMA 50 DC with FractalsBuying or Selling levels are identified with SMA 50 along with Fractals for breakouts and reversals.
SMA will be green when the trend is Bullish
SMA will be red when the trend is Bearish
The color is set GREEN and RED for Bullish and Bearish trend
Donchian Channels with Auto Fibonacci RetracementRichard Donchian created Donchian Channels, which is a type of moving average indicator and a look-alike of other support and resistance trading indicators like Bollinger Bands.
Donchian Channels has a simple plotting of highest high and lowest low of the last “n” periods.
The “n” periods is based on the trader’s choice, who can select the period according to their requirements ranging from a day, hour and minutes etc.
Traders use Donchian Channels to understand the support and resistance levels.
Donchian Channels is a popular indicator for determining volatility in market prices.
The channels are wider when there are heavy price fluctuations and narrow when prices are relatively flat.
Generally, investors use 20-periods with the Donchian Channels as the default trading setting, but this value can be tweaked based on your trading style.
Donchian channels are mainly used to identify the breakout of a stock or any traded entity enabling traders to take either long or short positions.
Traders can take a long position, if the stock is trading higher than the Donchian channels “n” period and book their profits/short the stock if it is trading below the DC channels “n” period.
The middle band is the average of the upper and lower bands.
The middle band in Donchian channels could also be used as a breakout indicator.
If the stock rises above the middle band of the Donchian channels, then you can open a long position.
On the contrary, if the stock is trading below the middle band of the Donchian channel, then a trader can open a short position.
Combining Donchian Channel trading strategies with other trading strategies might decrease the false entry/exit signals and give a clearer picture of trading opportunities.
If you start to trade a choppy market on an intraday basis, you will be overloaded with false signals.
So, what I noticed is that in order for things to become clearer, we just need to increase the time frame.
Where Donchian Channels Can Fail You
It’s likely not the indicator but more likely our misinterpretation of the signals.
Few areas where the Donchian channel may be tough to read.
Low float stocks are not bound by any indicator, especially Donchian channels.
The challenge with the Donchian channels is that it does not factor in the most recent market volatility.
The indicators provide an equal weighting to all data points.
Therefore when a low float stock picks up and goes on a run, the lower bounds not capture the price movements quickly enough, thus risking giving back more profits than necessary.

Donchian Channel StrategyLong and Short entries based on the Donchian Channel indicator. The entry can be set to Higher High/Lower Low or the basis line.

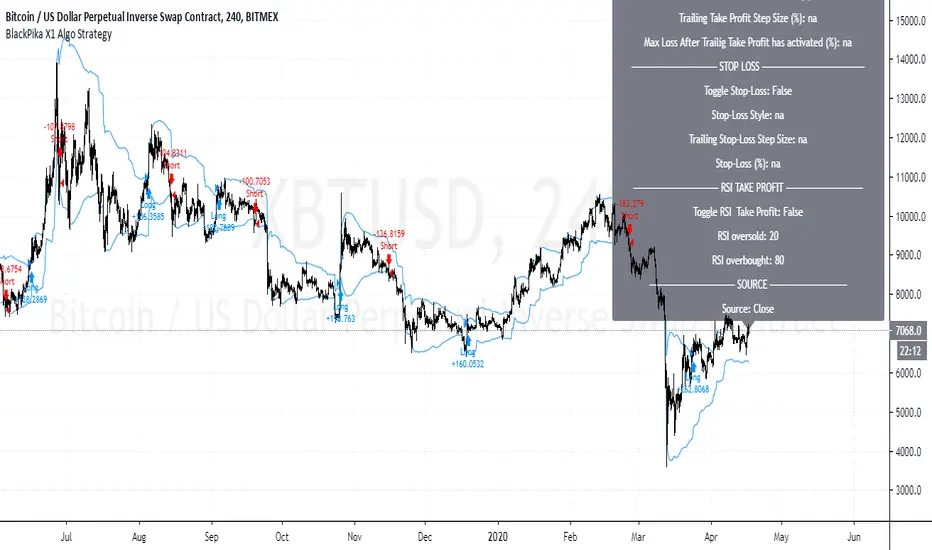
BlackPika X1 Algo StrategyBlackPika X1 Algo is a successor to the original BlackPika Algo.
It uses the following main elements:
RSI
ATR
ADX
Volume
Chopiness Filter
Trailing Profit
Fixed Profit
Trailing Stop loss
Fixed Stop Loss
Donchian channels and some more...
The backtest you see includes a commision of 1% and slippage of 1 tick. and the start date is from 2015
All the above mentioned settings are customisable, and can be adapted to your liking, timeframe and Asset.
Hit me up if you have any questions. This is only a backtest version.
All the best in your trading.