[iQ]PRO Volume Frequency Profile+++🌌 PRO Volume Frequency Profile+++: The Fusion of Precision and Market Flow
The PRO Volume Frequency Profile+++ ( PRO VFP+++) is a next-generation analytical instrument designed for the discerning professional trader. It masterfully synthesizes multiple advanced concepts—Dynamic Linear Regression, High-Fidelity Frequency Analysis, and a Volumetric Distribution Profile—into a single, unified view of market structure. This powerful fusion provides unparalleled context for identifying high-probability turning points and key areas of interest.
🔬 Core Innovation: The Symbiotic Market Model
At its heart, the PRO VFP+++ is built on a proprietary methodology that transcends traditional price action by analyzing the frequency and distribution of traded volume relative to the dominant price trend.
Adaptive Regression Channel: The indicator establishes a highly dynamic Linear Regression channel, which acts as the core gravity well of the current trend. This channel is then protected by multi-tier Standard Deviation (SD) Bands with highly optimized, non-standard multipliers, defining the boundaries of expected price movement.
High-Resolution Frequency Bands: An integrated, proprietary Frequency Analysis component detects the underlying rhythmic oscillation in the market. This mechanism generates Frequency Bands that fluctuate around the core regression line, providing an exceptionally sensitive, leading, and dynamic channel for short-term mean-reversion and continuation signals.
Volumetric Profile Insight: A sophisticated Volume Frequency Profile is meticulously constructed over the look back period defined by the Linear Regression. This profile maps the distribution of trading activity, with an advanced implementation that provides a directional bias (Buy/Sell color gradient) within the volume nodes themselves, offering a deeper understanding of market participation.
✨ The Edge: Strategic Node Detection
The indicator's most compelling feature is its Intelligent Node Detection System. This system is specifically engineered to filter out market noise and highlight critical confluence zones:
Confluence Nodes: Automatically identifies and marks prices where the statistically significant Volume Nodes from the profile interact with the calculated Linear Regression lines and Standard Deviation Bands. These intersection points are areas where technical structure and realized market flow align, signaling price magnets or potential reversal zones.
Customizable Sensitivity: The system is governed by a Node Sensitivity parameter, allowing the user to fine-tune the filter for market conditions, ensuring only the most robust interactions are flagged.
🚨 Real-Time Opportunity & Security
To ensure maximum efficiency, the PRO VFP+++ features comprehensive, real-time Alerts based on all three core components:
Significant Node Cross: Alerts when price intersects a high-confluence interaction node.
Regression Line Touch: Alerts when price tests the core regression line, indicating a re-test of the dominant trend.
SD Band Touch: Alerts upon contact with the statistical boundaries, signaling potential overextension or trend strength.
This is a professional-grade, proprietary instrument. The source code is intentionally closed and protected to preserve the unique advantage of its underlying algorithms, which are the result of extensive research and optimization. Access is restricted and may be limited to invited, paying members only.
Unlock the next level of market structure analysis with the PRO VFP+++.
Forecasting

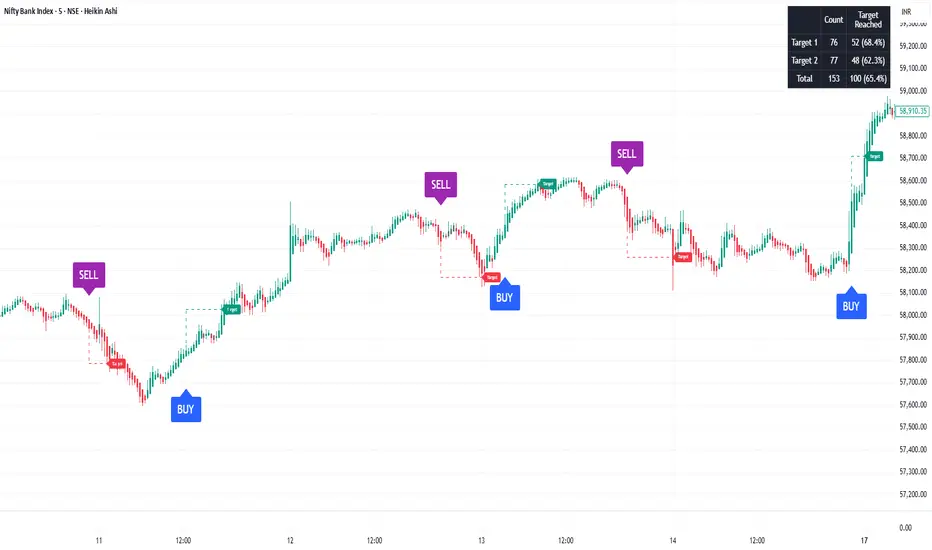
SoopAlgo — Premium Buy & Sell Targets (v6)SoopAlgo — Premium Targets (v6)
Description / Usage:
SoopAlgo — Premium Targets is a powerful trading tool designed to provide clear and actionable buy and sell signals directly on your chart. It highlights optimal entry points with distinct labels and automatically plots target levels, helping traders plan exits with precision.
Advantages:
Clear Visual Signals: Buy and sell opportunities are displayed prominently, reducing confusion and improving decision-making speed.
Integrated Target Levels: Automatic target lines allow traders to set realistic profit expectations without manual calculations.
Customizable Alerts: Receive alerts when signals occur, ensuring you never miss a trade opportunity.
Clean, Modern Display: Minimal clutter with intuitive color-coding (Buy in blue, Sell in purple) for easy chart readability.
Flexible Settings: Easily adjust target distances, label sizes, and indicator sensitivity to fit different trading styles.
Ideal For:
Traders who want a streamlined, easy-to-read tool for spotting market entries and exits with visual targets and alerts, while keeping the chart clean and focused.
Liquidity Sweep & FVG StrategyThis strategy combines higher-timeframe liquidity levels, stop-hunt (sweep) logic, Fair Value Gaps (FVGs) and structure-based take-profits into a single execution engine.
It is not a simple mash-up of indicators: every module (HTF levels, sweeps, FVGs, ZigZag, sessions) feeds the same entry/exit logic.
1. Core Idea
The script looks for situations where price:
Sweeps a higher-timeframe high/low (takes liquidity around obvious levels),
Then forms a displacement candle with a gap (FVG) in the opposite direction,
Then uses the edge of that FVG as a limit entry,
And manages exits using unswept structural levels (ZigZag swings or HTF levels) as targets.
The intent is to systematically trade failed breakouts / stop hunts with a defined structure and risk model.
It is a backtesting / study tool, not a signal service.
2. How the Logic Works (Conceptual)
a) Higher-Timeframe Liquidity Engine
Daily, Weekly and Monthly highs/lows are pulled via request.security() and stored as HTF liquidity levels.
Each level is drawn as a line with optional label (1D/1W/1M High/Low).
A level is marked as “swept” once price trades through it; swept levels may be removed or shortened depending on settings.
b) Sweep & Manipulation Filter
A low sweep occurs when the current low trades through a stored HTF low.
A high sweep occurs when the current high trades through a stored HTF high.
If both a high and a low are swept in the same bar, the script flags this as “manipulation” and blocks new entries around that noise.
The script also tracks the sweep wick, bar index and HTF timeframe for later use in SL placement and labels.
c) FVG Detection & Management
FVGs are defined using a 3-candle displacement model:
Bullish FVG: high < low
Bearish FVG: low > high
Only gaps larger than a minimum size (ATR-based if no manual value is set) are kept.
FVGs are stored in arrays as boxes with: top, bottom, mid (CE), direction, and state (filled / reclaimed).
Boxes are auto-extended and visually faded when price is far away, or deleted when filled.
d) Entry Conditions (Sweep + FVG)
For each recent sweep window:
After a low sweep, the script searches for the nearest bullish FVG below price and uses its top edge as a long limit entry.
After a high sweep, it searches for the nearest bearish FVG above price and uses its bottom edge as a short limit entry.
A “knife protection” check blocks trades where price is already trading through the proposed stop.
Only one entry per sweep is allowed; entries are only placed inside the configured NY trading sessions and only if no manipulation flag is active and EOD protection allows it.
e) Stop-Loss Placement (“Tick-Free” SL)
The stop is not placed directly on the HTF level; instead, the script scans a window around the sweep bar to find a local extreme:
Longs: lowest low in a configurable bar window around the sweep.
Shorts: highest high in that window.
This produces a structure-based SL that is generally outside the main sweep wick.
f) Take-Profit Logic (ZigZag + HTF Levels)
A lightweight ZigZag engine tracks swing highs/lows and removes levels that have already been broken.
For intraday timeframes (< 1h), TP candidates come from unswept ZigZag swings above/below the entry.
For higher timeframes (≥ 1h), TP candidates fall back to unswept HTF liquidity levels.
The script picks up to two targets:
TP1: nearest valid target in the trade direction (or a 2R fallback if none exists),
TP2: second target (or a 4R fallback if none exists).
A multi-TP model is used: typically 50% at TP1, remainder managed towards TP2 with breakeven plus offset once TP1 is hit.
g) Session & End-of-Day Filters
Three predefined NY sessions (Early, Open, Afternoon) are available; entries are only allowed inside active sessions.
An End-of-Day filter checks a user-defined NY close time and:
Blocks new entries close to the end of the day,
Optionally forces flat before the close.
3. Inputs Overview (Conceptual)
Liquidity settings: which HTF levels to track (1D/1W/1M), how many to show, and sweep priority (highest TF vs nearest vs any).
FVG settings: visibility radius, search window after a sweep, minimum FVG size.
ZigZag settings: swing length used for TP discovery.
Execution & protection: limit order timeout, breakeven offset, EOD protection.
Visuals: labels, sweep markers, manipulation warning, session highlighting, TP lines, etc.
For exact meaning of each input, please refer to the inline comments in the open-source code.
4. Strategy Properties & Backtesting Notes
Default strategy properties in this script:
Initial capital: 100,000
Order size: 10% of equity (strategy.percent_of_equity)
Commission: 0.01% per trade (adjust as needed for your broker/asset)
Slippage: must be set manually in the Strategy Tester (recommended: at least a few ticks on fast markets).
Even though the order size is 10% of equity, actual risk per trade depends on the SL distance and is typically much lower than 10% of the account. You should still adjust these values to keep risk within what you personally consider sustainable (e.g. somewhere in the 1–2% range per trade).
For more meaningful results:
Test on liquid instruments (e.g. major indices, FX, or liquid futures).
Use enough history to reach 100+ closed trades on your market/timeframe.
Always include realistic commission and slippage.
Do not assume that past performance will continue.
5. How to Use
Apply the strategy to your preferred symbol and timeframe.
Set broker-like commission and slippage in the Strategy Tester.
Adjust:
HTF levels (1D/1W/1M),
Sessions (NY windows),
FVG search window and minimum size,
ZigZag length and EOD filter.
Observe how entries only appear:
After a HTF sweep,
In the configured session,
At a FVG edge,
With TP lines anchored at unswept structure / liquidity.
Use this primarily as a research and backtesting tool to study how your own ICT / SMC ideas behave over a large sample of trades.
6. Disclaimer
This script is for educational and research purposes only.
It does not constitute financial advice, and it does not guarantee profitability. Always validate results with realistic assumptions and use your own judgment before trading live.

able zone# able zone
## 📋 Overview
**able zone** is an advanced Support & Resistance zone detection indicator optimized for **15-minute timeframe trading**. It combines Price Action, Volume Profile, and intelligent zone analysis to identify high-probability trading areas with precise entry and exit points.
## 🎯 Core Features
### 1. **Zone Detection Methods**
- **Auto Detect**: Automatically finds the best zones using combined analysis
- **Price Action**: Based on pivot points and price structure
- **Volume Profile**: Identifies High Volume Nodes (HVN) where most trading occurred
- **Combined**: Uses all methods together for comprehensive analysis
### 2. **Zone Types & Colors**
- 🟢 **Support Zones** (Green): Price tends to bounce up from these areas
- 🔴 **Resistance Zones** (Red): Price tends to reverse down from these areas
- 🟣 **HVN Zones** (Purple): High volume areas from Volume Profile
- **Strong Zones**: Darker colors indicate zones with more touches (higher reliability)
### 3. **Zone Strength Indicators**
- **Labels**: "S3" = Support with 3 touches, "R5" = Resistance with 5 touches
- **Touch Count**: More touches = stronger zone
- **Min Touch Count Setting**: Adjust to filter weak zones (default: 3)
## ⚙️ Settings Guide
### **Zone Detection Settings**
- **Detection Method**: Choose your preferred analysis method
- **Lookback Period** (50-500): How many bars to analyze (default: 200)
- For 15min: 200 bars = ~50 hours of data
- Shorter = Recent zones only
- Longer = Historical zones included
- **Min Touch Count** (2-10): Minimum touches to qualify as a zone (default: 3)
- **Zone Thickness %** (0.1-2.0): How thick the zones appear (default: 0.5)
- Based on ATR for dynamic sizing on 15min chart
### **Zone Colors**
Fully customizable colors for:
- Support Zone (default: Green)
- Resistance Zone (default: Red)
- Strong Support/Resistance (darker shades)
- Volume Profile Zone (default: Purple)
### **Zone Touch Detection**
- **Enable Touch Alerts**: Get notifications when price enters zones
- **Touch Distance %** (0.1-1.0): How close to zone counts as "touch" (default: 0.3%)
- On 15min chart, this gives early warning signals
- **Show Touch Markers**: Visual indicators when price touches zones
- 🔺 = Support touch (potential buy)
- 🔻 = Resistance touch (potential sell)
- 💎 = HVN touch (watch for breakout/rejection)
### **Volume Profile Integration**
- **Show VP Zones**: Display high volume node zones
- **VP Resolution** (20-50): Number of price levels analyzed (default: 30)
- **POC Line** (orange): Point of Control - highest volume price level
- **POC Width**: Line thickness (1-3)
- **Show HVN**: Display High Volume Node zones
- **HVN Threshold** (0.5-0.9): Volume % to qualify as HVN (default: 0.7)
### **Display Options**
- **Zone Labels**: Show S/R labels with touch count
- **Zone Border Lines**: Dotted lines at zone boundaries
- **Extend Zones Right**: Project zones into future
- **Max Visible Zones** (5-50): Maximum number of zones displayed (default: 20)
- Adjust based on chart clarity needs
- **Info Table**: Real-time information dashboard
## 📊 Info Table Explained
The info table (top-right corner) provides real-time zone analysis:
### **Row 1: ZONE Header**
- Shows current timeframe (15m)
- Total active zones
- "able" branding
### **Row 2: 🎯 TOUCH Status**
- **RES**: Currently touching resistance (⚠️ potential reversal down)
- **SUP**: Currently touching support (🚀 potential bounce up)
- **HVN**: Currently in high volume area (⚡ watch for direction)
- **FREE**: Not near any zone (⏳ wait for setup)
- Progress bar shows proximity strength
- Arrows indicate zone type
### **Row 3: 🟢 SUP - Support Zones**
- Number of active support zones below current price
- Progress bar shows relative quantity
- More support = stronger floor
### **Row 4: 🔴 RES - Resistance Zones**
- Number of active resistance zones above current price
- Progress bar shows relative quantity
- More resistance = stronger ceiling
### **Row 5: 🟣 HVN - High Volume Nodes**
- Number of HVN zones (from Volume Profile)
- These are areas where most trading activity occurred
- Often act as magnets for price
### **Row 6: 📍 NEAR - Nearest Zone**
- Shows closest zone type (SUP/RES/HVN)
- Distance in % to nearest zone
- Arrow shows if zone is above or below
### **Row 7: POSITION - Price Position**
- **HIGH**: Price near range top (70%+) - watch for resistance
- **MID**: Price in middle range (30-70%) - neutral zone
- **LOW**: Price near range bottom (<30%) - watch for support
- Shows exact position % in lookback range
### **Row 8: ═ SIGNAL ═**
- **🚀 BUY**: Touching support zone (entry opportunity)
- **⚠️ SELL**: Touching resistance zone (exit/short opportunity)
- **⚡ WATCH**: At HVN (prepare for breakout or rejection)
- **⏳ WAIT**: No clear setup (be patient)
## 🎓 Trading Strategy for 15-Minute Timeframe
### **Basic Setup**
1. Set timeframe to **15 minutes**
2. Use **Auto Detect** or **Combined** method
3. Set **Lookback Period**: 200 bars (~50 hours)
4. Set **Min Touch Count**: 3 (proven zones)
### **Entry Signals**
#### **Long Entry (Buy)**
- Price touches green support zone
- Table shows "🚀 BUY" signal
- Look for bullish candle pattern (hammer, engulfing)
- Volume increases on bounce
- **Best Entry**: Bottom of support zone
- **Stop Loss**: Below support zone (1-2 ATR)
- **Target**: Next resistance zone or 2:1 RR
#### **Short Entry (Sell)**
- Price touches red resistance zone
- Table shows "⚠️ SELL" signal
- Look for bearish candle pattern (shooting star, engulfing)
- Volume increases on rejection
- **Best Entry**: Top of resistance zone
- **Stop Loss**: Above resistance zone (1-2 ATR)
- **Target**: Next support zone or 2:1 RR
#### **HVN Breakout Strategy**
- Price approaches purple HVN zone
- Table shows "⚡ WATCH"
- Wait for breakout with strong volume
- **If breaks up**: Go long, target next resistance
- **If breaks down**: Go short, target next support
### **Zone Strength Rules**
- **S5+ or R5+**: Very strong zones (high probability)
- **S3-S4 or R3-R4**: Reliable zones (good setups)
- **S2 or R2**: Weak zones (use caution)
### **Best Trading Times (15min)**
- **London Open**: 08:00-12:00 GMT (high volume)
- **NY Open**: 13:00-17:00 GMT (high volatility)
- **Overlap**: 13:00-16:00 GMT (best setups)
- **Avoid**: Asian session low volatility periods
### **Risk Management**
- Never risk more than 1-2% per trade
- Use stop loss ALWAYS (place outside zones)
- Take partial profits at 1:1, let rest run to 2:1 or 3:1
- If price consolidates in zone > 3 candles, exit
## ⚠️ Important Notes
### **When Zones Work Best**
✅ Clear trending markets
✅ After significant price movements
✅ At session opens (London/NY)
✅ When multiple zones align
✅ Strong zone with 5+ touches
### **When to Be Cautious**
❌ During major news releases (use economic calendar)
❌ Very low volume periods
❌ Price consolidating inside zone
❌ Weak zones with only 2 touches
❌ Conflicting signals from multiple indicators
### **15-Minute Specific Tips**
- **Lookback 200**: Captures 2-3 trading days of zones
- **Touch Distance 0.3%**: Early signals on 15min moves
- **Max Zones 20**: Keeps chart clean but comprehensive
- **Watch POC**: Often acts as pivot on 15min
- **Volume spike + zone touch** = high probability setup
## 🔧 Recommended Settings for 15min
### **Conservative Trader**
- Detection Method: Combined
- Min Touch Count: 4
- Max Zones: 15
- Touch Distance: 0.2%
### **Aggressive Trader**
- Detection Method: Auto Detect
- Min Touch Count: 2
- Max Zones: 25
- Touch Distance: 0.5%
### **Volume Profile Focused**
- Detection Method: Volume Profile
- Show HVN: Yes
- HVN Threshold: 0.6
- Show POC: Yes
## 📈 Example Trade Scenario (15min)
**Setup**: BTC/USD on 15-minute chart
1. Price approaching green support zone at $42,000
2. Zone label shows "S4" (touched 4 times)
3. Table shows "🚀 BUY" signal
4. Volume increasing on approach
5. Bullish hammer candle forms
**Entry**: $42,050 (bottom of zone)
**Stop Loss**: $41,900 (below zone)
**Target 1**: $42,350 (2:1 RR)
**Target 2**: Next resistance at $42,650
**Result**: Price bounces, hits Target 1 in 3 candles (~45min)
## 💡 Pro Tips
1. **Combine with trend**: Trade in direction of higher timeframe trend
2. **Multiple touches**: Zones with 5+ touches are highest probability
3. **Volume confirmation**: Always check volume on zone touch
4. **POC magnet**: Price often returns to POC line
5. **False breakouts**: If price barely breaks zone and returns = strong signal
6. **Zone-to-zone**: Trade from support to resistance, resistance to support
7. **Time of day**: Best setups occur during peak volume hours
8. **Chart timeframe**: Use 1H to confirm trend, 15min for entry
9. **News avoidance**: Close trades before high-impact news
10. **Zone clusters**: Multiple zones together = strong area
---
**Created by able** | Optimized for 15-minute trading
**Version**: 1.0 | Compatible with TradingView Pine Script v5
For support and updates, enable alerts and monitor the info table in real-time!

Global Liquidity - Impulse (ROC & Z-score) [GMI-style]What it is:
Liquidity is a faucet. When central banks add money, the faucet opens (risk-on). When they pull money out, it closes (risk-off). This indicator builds a global net-liquidity proxy and shows its impulse :
- ROC (green/red histogram): % change vs N weeks ago.
- Z-score (cyan line): how unusually strong the latest weekly move is.
Why it matters:
Liquidity impulse often leads risk assets (equities/crypto) by weeks to a few months.
- Green bars > 0 + positive Z → friendlier risk-on backdrop.
- Red bars < 0 + negative Z → tightening conditions; caution.
Data used (TV Economics / FRED):
USA (FRED, millions USD):
- FRED:WALCL (Fed assets)
- FRED:RRPONTSYD (Reverse Repo – subtract)
- FRED:WTREGEN (Treasury General Account – subtract)
Other CBs (Economics, units vary):
- ECONOMICS:EUCBBS (ECB)
- ECONOMICS:JPCBBS (BoJ)
- ECONOMICS:CNCBBS (PBoC)
Optional:
- ECONOMICS:GBCBBS (BoE, UK)
- ECONOMICS:CACBBS (BoC, Canada)
- ECONOMICS:CHCBBS (SNB, Switzerland)
- ECONOMICS:AUCBBS (RBA, Australia)
Proxy (scaled to billions):
(Fed − RRP − TGA) + ECB + BoJ + PBoC +
How to read:
- Green bars above 0 = faucet opening → money in → risk-on.
- Red bars below 0 = faucet closing → money out → risk-off.
- Taller bar = stronger push.
- Cyan Z > +1 = unusually strong positive impulse; Z < −1 = unusually strong negative impulse.
- Background : green when ROC>0 & Z>0 , red when ROC<0 & Z<0 .
Quick reading guide (TL;DR):
- Early risk-on: ROC crosses > 0 and Z > 0 (ideally Z ≥ +1 ).
- Early risk-off: ROC crosses < 0 and Z < 0 (ideally Z ≤ −1 ).
- Use weekly timeframe; price often reacts with a 0–12 week lag.
- Combine with PMIs/New Orders, real yields (down), and credit spreads (narrowing).
Notes:
Symbols may differ by provider; leave optional banks OFF if missing. Currencies/units differ across CBs; this is a pragmatic proxy, not a perfect macro model. Educational use only; not financial advice.

Aizen 50 SMA Trend DashboardAizen 50 SMA Trend Dashboard V2
1. What this indicator is
Name: Aizen 50 SMA Trend Dashboard V2
This indicator helps you quickly understand three important things:
1. Whether price is above or below the 50 Simple Moving Average (50 SMA).
2. The trend direction across multiple timeframes using the MTF dashboard.
3. Clear Buy/Sell arrows whenever price crosses the 50 SMA.
It is a trend-following tool designed to make trend reading, timing, and bias much easier.
It does not replace your strategy but enhances your decision-making.
________________________________________
2. What you see on the chart
The indicator includes four main visual components:
1. 50 SMA line
2. Colored candles
3. MTF Trend Dashboard (top right)
4. Buy/Sell arrows
________________________________________
2.1. 50 SMA Line
• A 50-period SMA is plotted directly on your chart.
• Green SMA: price is above the 50 SMA.
• Red SMA: price is below the 50 SMA.
• You can toggle it on/off using:
Show 50 SMA on Chart
The SMA acts as your primary trend reference.
________________________________________
2.2. Candle Colors
Candles dynamically change color based on where they close relative to the SMA:
• Bullish color: close > 50 SMA
• Bearish color: close < 50 SMA
• Neutral color: price is sitting on the SMA
This makes trend clarity simple:
• Bullish runs → candles stacked above the SMA
• Bearish runs → candles stacked below the SMA
• Choppy zones → candles flip colors back and forth
________________________________________
2.3. MTF Trend Dashboard (Top Right)
The dashboard analyzes the trend vs 50 SMA on:
• 15m
• 30m
• 1h
• 4h
• 1D
Each timeframe displays:
• Green (Bullish): price above its timeframe's 50 SMA
• Red (Bearish): price below its timeframe's 50 SMA
• Gray (Neutral): price near its SMA
Toggle it on/off using:
Show MTF Trend Dashboard (Top Right)
How to use it:
• More green → prioritize Buy setups
• More red → prioritize Sell setups
• Mixed → market conditions unclear; trade cautiously
________________________________________
2.4. Buy/Sell Arrows
Arrows appear when price crosses the 50 SMA on your current timeframe:
• Buy Arrow: price crosses from below to above the SMA
• Sell Arrow: price crosses from above to below the SMA
Settings allow you to control visibility:
• Show Buy/Sell Signals – master switch
• Show Buy Signals Only
• Show Sell Signals Only
You can also activate alerts when signals appear.
________________________________________
3. How to use this indicator (Step-by-Step)
This workflow keeps trading simple and structured.
________________________________________
Step 1 – Choose Your Trading Timeframe
Examples:
• Intraday: 5m, 15m, 30m
• Swing: 1h, 4h, 1D
The dashboard always provides context with:
15m, 30m, 1h, 4h, 1D.
________________________________________
Step 2 – Set Your Bias Using the Dashboard
Before entering any trade:
• 1h & 4h Bullish (green) → focus on Buy setups
• 1h & 4h Bearish (red) → focus on Sell setups
• Mixed → reduced clarity; be patient
Simple rule:
• Buy when higher timeframes (especially 1h & 4h) are Bullish
• Sell when higher timeframes are Bearish
________________________________________
Step 3 – Check Price vs 50 SMA on Your Entry Timeframe
On your main chart:
• Above green SMA + bullish candles: uptrend → look for Buys
• Below red SMA + bearish candles: downtrend → look for Sells
• Crossing back and forth: ranging → expect fake signals
________________________________________
Step 4 – Use Arrows as Entry Timing (Not as a Standalone Signal)
Once bias is set:
For Buys
1. Dashboard: higher timeframes mostly Bullish
2. Price pulls back toward/under the 50 SMA
3. Price closes back above the SMA → Buy arrow
4. Entry ideas:
o Stop below recent swing low or below SMA
o Target minimum 1:1 reward
For Sells
1. Dashboard: higher timeframes mostly Bearish
2. Price pulls up toward/above the 50 SMA
3. Price closes back below SMA → Sell arrow
4. Entry ideas:
o Stop above recent swing high or above SMA
o Target minimum 1:1 reward
Important:
Arrows confirm timing; structure and risk/reward matter more.
________________________________________
Step 5 – Use Buy-Only or Sell-Only Modes
This helps keep your bias clean:
Uptrend
• Show Buy Signals Only = ON
• Show Sell Signals Only = OFF
Downtrend
• Show Buy Signals Only = OFF
• Show Sell Signals Only = ON
This reduces noise and avoids unnecessary counter-trend trades.
________________________________________
4. Best Type of Setup for This Indicator
The highest-quality setups come from:
Trend + Pullback + SMA Crossover
Example Buy:
• Dashboard: 1h & 4h Bullish
• Entry TF (e.g., 15m):
o Price above a green SMA
o Pullback into SMA area
o Candle closes back above → Buy arrow
• Confirmation:
o Support or higher low
o Logical stop & target
Example Sell:
• Dashboard: 1h & 4h Bearish
• Entry TF:
o Price below a red SMA
o Pullback to SMA area
o Candle closes back below → Sell arrow
These signals have the highest probability.
________________________________________
5. Fake Signals and Realistic Expectations
You must understand this clearly:
There WILL be fake Buy/Sell arrows.
Why:
• Crossovers happen often in sideways markets
• When price ranges around the SMA, arrows will fire repeatedly
• The indicator cannot block chop or news-driven volatility
Your job is to filter the setup.
________________________________________
How to Reduce Bad Trades
Before taking a signal, check:
1. Dashboard alignment
• Strong Buy: 1h & 4h clearly Bullish
• Strong Sell: 1h & 4h clearly Bearish
2. Trend vs Range
• Trend = candles stacked on one side of SMA
• Range = candles switching colors → dangerous
3. Structure
• Buy near support
• Sell near resistance
4. Risk/Reward
• Skip if stop is too large or target too small
The indicator shows opportunities, but you decide which ones are worth taking.

Liquidity LayoutLiquidity Layout
The Liquidity Layout is a comprehensive macroeconomic indicator that tracks global liquidity conditions by aggregating multiple financial data streams from major economies (US, EU, China, Japan, UK, Canada, Switzerland). It provides traders with a macro view of market liquidity to help identify favorable conditions for risk assets
⚠️ Important: Timeframe Settings
This indicator is designed for the 1W (weekly) timeframe. If you use other timeframes, you must adjust the offset parameter in the settings to properly align the data with price action. The default offset of 12 is calibrated for weekly charts.
What It Measures
This indicator combines seven key components of global liquidity:
1. Global M2 Money Supply - Tracks broad money supply (M2) plus 10% of narrow money supply (M1) across major economies, weighted by currency strength. This represents the total amount of money circulating in the private sector.
2. Central Bank Balance Sheets (CBBS) - Monitors the combined balance sheets of major central banks (Fed, ECB, BoJ, PBoC, etc.), reflecting quantitative easing and monetary expansion policies.
3. Foreign Exchange Reserves (FER) - Aggregates forex reserves held by central banks, indicating international liquidity buffers and capital flows.
4. Current Account + Capital Flows (CA) - Combines current account balances with capital flows to measure cross-border money movement and trade liquidity.
5. Government Spending (GSP) - Tracks government expenditure minus a portion of federal expenses, representing fiscal stimulus and public sector liquidity injection.
6. World Currency Unit (WCU) - A custom forex composite that weights major and emerging market currencies to capture global currency strength dynamics.
7. Bond Market Conditions - Analyzes yield curves, spreads, and bond indices to assess credit conditions and risk appetite in fixed income markets.
The Formula
The indicator uses two main calculation modes:
ADJ Global Liquidity (Default):
×
This multiplies liquidity components by currency and bond market factors to capture the interactive effects between monetary conditions and market sentiment.
TPI (Trend Power Index) Mode:
A normalized version that combines all components with optimized weights:
Global Liquidity Index: 10%
Bonds: 17.5%
Bond Yields: 25%
Currency Strength: 25%
Government Spending: 5%
Current Account: 5%
M2: 2.5%
Central Bank Balance Sheets: 2.5%
Forex Reserves: 5%
Oil (macro risk indicator): 2.5%
How to Use It
Visualization Modes:
Background Mode (default): Orange background appears when TPI is positive (favorable liquidity conditions)
Line Mode: Displays the indicator as an orange line with customizable offset
Interpreting the Signal:
Positive/Rising = Expanding liquidity, generally bullish for risk assets
Negative/Falling = Contracting liquidity, risk-off environment
TPI > 1 = Extremely favorable conditions (upper threshold)
TPI < -1 = Severe liquidity stress (lower threshold)
Best Practices:
Use on higher timeframes (daily, weekly) for macro trend analysis
Combine with price action - liquidity often leads market moves by weeks or months
Watch for divergences between liquidity and asset prices
Particularly relevant for Bitcoin, equities, and risk assets
Data Sources
The indicator pulls real-time economic data from TradingView's ECONOMICS database and major market indices, including central bank statistics, government reports, and forex rates across G7 and major emerging markets.
Settings
Data Plot: Choose which liquidity component to display
Plot Type: Switch between raw Index values or normalized TPI
Offset: Shift the plot forward/backward for alignment (default: 12 for weekly charts)
Style: Background shading or line plot
Notes
This is a macro-level indicator best suited for understanding the broader liquidity environment rather than short-term trading signals. It helps answer the question: "Is the global financial system expanding or contracting liquidity?"

Predictive Analysis Engine — Adaptive MACD Forecasting with R² SProfessional and Rule-Compliant Description (Ready for Publishing)
This description explains every component of the script in detail, highlights its originality, and provides traders with clear usage instructions — exactly what TradingView expects.
Predictive Analysis Engine (PAE)
This script is a predictive analysis model that combines trend filtering, linear forecasting, stability analysis (R²), and outlier filtering using ATR to produce an advanced, leading-style version of MACD rather than a traditional lagging one.
The indicator does not rely on random elements; it is built on four core components that work together:
1. Stability Measurement Using R²
The coefficient of determination (R²) is calculated based on the correlation between price and time, then normalized to a 0–1 scale.
A higher R² indicates more stable price movement, allowing the script to increase forecast accuracy.
Here, R² acts as a primary component of the Confidence Filter.
2. Forecasted Price Using Linear Regression
Instead of relying solely on the current price, the script uses:
Linear Regression
Weighted blending between the forecasted price and actual price
This enables the script to build a Leading MACD based on an “advanced” price that anticipates probable movement.
3. Advanced MACD With Adaptive Smoothing
MACD is applied to the blended (real + forecasted) price using:
Fast EMA
Slow EMA
MACD base
Optional TEMA for reducing signal lag
Adjustable histogram smoothing
This process makes MACD more responsive with significantly less lag, reacting faster to predicted movements.
4. Predictive MACD (Projected MACD)
Linear Regression is applied again — but this time to:
MACD
Signal
Histogram
to generate projected versions of each line (proj_macd, proj_signal), while proj_hist is used to produce early signals before the actual crossover occurs.
5. Volatility Filtering Using ATR & Volatility Ratio
ATR is used to evaluate:
Strength of movement
Overextension levels
Signal quality
ATR is combined with R² to compute:
Confidence = R² × Volatility Ratio
This suppresses weak signals and boosts high-quality, reliable ones.
6. Predictive Signals + Safety Filters
A signal is triggered when:
proj_hist crosses the 0 level
Confidence exceeds the required threshold
The real histogram is not excessively stretched (extra safety)
The script includes:
BUY / SELL
BUY_STRONG / SELL_STRONG
based on the smoothed histogram trend.
7. Coloring, Background & Visual Enhancements
The script colors:
The histogram
Chart background
Signal lines
to clearly highlight momentum direction and confidence conditions.
8. Built-In Alerts
The script provides ready-to-use alerts:
BUY Alert
SELL Alert
Both based on the predictive MACD model.
How to Use the Script
Add it to any timeframe and any market.
BUY/SELL signals are generated from the projected histogram crossover.
Higher Confidence = stronger signal.
Background colors help visualize trend transitions instantly.
Recommended to combine with support/resistance or price action.
Indicator Objective
This script is designed to deliver early insight into momentum shifts using a blend of:
Linear forecasting
Trend stability via R²
Signal quality filtering via ATR
A fast and adaptive advanced MACD

Nuh's Stochastic + Structure 1.0Nuh's Stochastic + Structure 1.0 is an advanced momentum–structure fusion indicator designed to identify high-probability reversal and continuation zones using a multi-layer confirmation engine. The script combines enhanced Stochastic analysis, market structure detection (HH/HL/LH/LL), divergence tracking, volume spikes, higher-timeframe trend alignment, and extreme-duration filters to deliver highly reliable buy/sell signals. Each signal is dynamically scored for strength, and a compact one-line trend panel provides real-time market state at a glance. Colors and visual elements follow a clear and intuitive hierarchy optimized for fast decision-making. Ideal for crypto, indices, and forex traders who want precision entries with minimal noise.

Macro Return ForecastWhen the macro environment was similar, what annualized return did the market usually deliver next?
Before using the indicator, make sure your chart is set to any US-market symbol (SPX, QQQ, DIA, etc.).
This requirement is simple: the indicator pulls macro series from US data (yields, TIPS, credit spreads, breadth of US indices).
Because these series are independent from the chart’s price series, the chart symbol itself does not affect the internal calculations.
Any US symbol works, and the output of the model will be identical as long as you are on a US asset with daily, weekly or monthly timeframe.
The plotted price does not matter: the macro engine is fully exogenous to the chart symbol.
1. What the indicator does relative to selected assets
In the settings you choose which market you want to analyze:
- S&P500
- Nasdaq or NQ100
- Dow Jones
- Russell 2000
- US-wide (VTI)
- S&P500 sectors (XLF, XLY, XLP, etc.)
For each one, the indicator loads:
- Its internal breadth series (percentage of constituents above MA200)
- Its price history to compute forward log-returns at multiple horizons
- Its regime position relative to its own MA200 (for bull/bear filtering)
This means the tool is not tied to the chart symbol you display.
If your chart is SPX but the indicator setting is “S&P500 Technology”, the expected return projection is computed for the Technology sector using its own data, not the chart’s data.
You can therefore:
- Visualize macro-driven expected returns for any major US index or sector.
- Compare how different parts of the market historically reacted to similar macro states.
- Switch assets instantly to see which segment historically behaved better in comparable macro conditions.
The indicator becomes an analyzer of macro sensitivity, not a chart-dependent indicator.
2. Method overview
The model answers a statistical question:
“When macro conditions looked like they do today, what forward annualized return did this asset usually deliver?”
To do this it combines four macro pillars:
- Market breadth of the selected asset
- Yield curve slope (US 10Y minus 2Y)
- US credit spread (high yield minus gov)
- US real rate (TIPS 10Y)
It normalizes each metric into a 0–100 score, groups similar historical states into bins, and examines what the asset did next across six horizons (from ~9 months to ~5 years).
This produces a historical map connecting macro states to realized forward returns.
It is not a forecast model.
It is a conditional-distribution estimator: it tells you what has historically happened from similar setups.
3. Why this produces useful insights on assets
For any chosen asset (SPX, Nasdaq, sectors…), the indicator computes:
- Its forward return distribution in similar macro states.
- How often these states occurred (n).
- Whether the macro environment that preceded positive returns in the past resembles today’s.
- Whether the asset tends to be more sensitive or more resilient than the broad index under given macro configurations.
- Whether a given sector historically benefited from specific yield-curve, credit or real-rate environments.
This lets you answer questions such as:
- Does this sector usually outperform in an inverted yield curve environment?
- Does the Nasdaq historically recover strongly after breadth collapses?
- How did the S&P500 behave historically when real rates were this high?
- Is today’s credit-spread environment typically associated with positive or negative forward returns for this index?
These insights are not predictions but statistical context backed by past market behavior.
4. Why the technique is robust (and why it matters)
The engine uses strict, non-optimistic data processing:
- Winsorization of returns to neutralize extreme outliers without deleting information.
- Shrinkage estimators to avoid overfitting when bins contain few occurrences.
- Adaptive or static bounds for scaling macro indicators, ensuring comparability across cycles.
- Inverse-variance weighting of horizons with penalties for horizon redundancy.
- HAC-style adjustments to reduce autocorrelation bias in return estimation.
Each method aims to prevent artificial inflation of expected-return values and to keep the estimator stable even in unusual macro states.
This produces a result that is not “optimistic”, not curve-fit, not dependent on chart tricks, and not sensitive to isolated historical anomalies.
5. What you get as a user
A single clean line:
Expected Annual Return (%)
This line reflects how the chosen asset historically performed after macro environments similar to today’s.
The color gradient and confidence indicator (n) show the density of comparable episodes in history.
This makes the output extremely simple to read:
- High, stable expectation: historically supportive macro environment.
- Low or negative expectation: historically weaker environments.
- Low confidence: the macro state is rare and historical comparisons are limited.
The tool therefore adds context, not signals.
It helps you understand the environment the asset is currently in, based on how markets behaved in similar conditions across US market history.

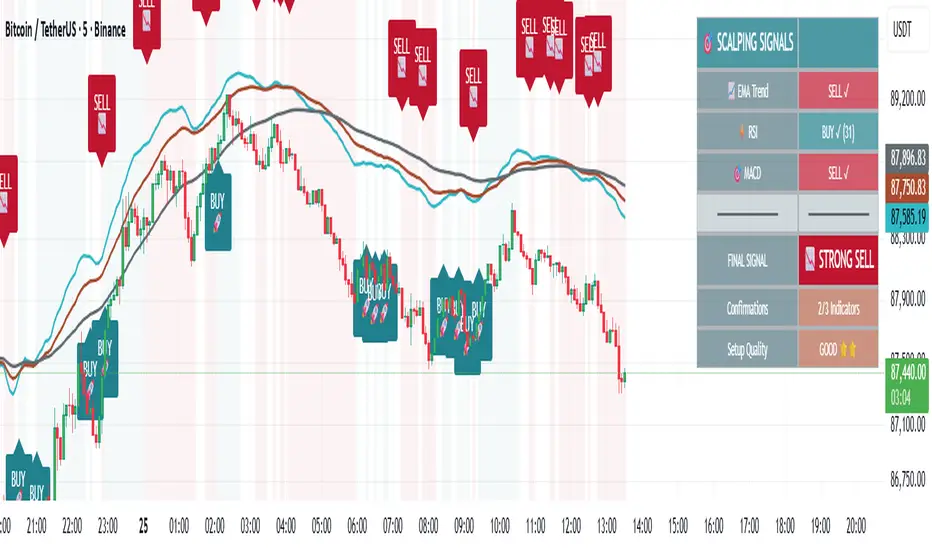
🎯 Advanced Scalping Indicator - Triple ConfirmationThis is the High Probability Scalping Indicator
Risk Reward: 1:2/3/4 or keep trailing SL
Indices ALN SessionsIndices ALN Sessions - Pattern Analysis with Historical Probabilities
Overview
This indicator analyzes overnight trading patterns across Asia, London, and New York sessions for major index futures (NQ, ES, YM), providing real-time probability analysis based on 15 years of historical data (2010-2025).
Pattern Detection Methodology
The indicator detects four distinct overnight patterns by comparing session high/low relationships:
1. London Engulfs Asia
Condition: London High > Asia High AND London Low < Asia Low
Interpretation: London session completely engulfed the Asia range
2. Asia Engulfs London
Condition: Asia High > London High AND Asia Low < London Low
Interpretation: London session remained within Asia's range
3. London Partial Up
Condition: London High > Asia High AND London Low ≥ Asia Low
Interpretation: London broke Asia high but not its low
4. London Partial Down
Condition: London Low < Asia Low AND London High ≤ Asia High
Interpretation: London broke Asia low but not the high
Probability Calculation
Probabilities are derived from historical analysis of 1-minute price data spanning 2010-2025 across all three indices. The system tracks:
Primary Targets: Most likely level to be taken during NY session based on pattern
Secondary Targets: Second most likely level
Asia Targets: Probability of reaching untouched Asia levels (for partial patterns)
Engulfment Probability: Likelihood of NY session taking all four levels
Day-of-Week Specificity
Each pattern has unique probability profiles for Monday through Friday, as market behavior varies significantly by day. The indicator automatically selects the appropriate probability set based on the current trading day.
Conditional Probability Logic
The indicator dynamically adjusts probabilities as levels are taken during the NY session:
When the Primary target is taken first → Shows conditional probability for Secondary target
When Secondary is taken before Primary → Adjusts Primary probability based on historical sequences
Real-time tracking shows which levels have been hit with checkmark confirmations
How Probabilities Were Derived
Data was collected from 15 years of 1-minute futures data for NQ, ES, and YM. For each trading day:
Asia session high/low recorded (8:00 PM - 2:00 AM EST)
London session high/low recorded (2:00 AM - 8:00 AM EST)
Pattern type classified
NY session behavior tracked (8:00 AM - 4:00 PM EST)
Level breaks recorded with sequence order
Statistical frequencies calculated by pattern, day, and instrument
Sample sizes vary but typically include 200-500+ occurrences per pattern/day combination over the 15-year period.
Visual Components
Session Boxes: Color-coded rectangles showing Asia (Yellow), London (Blue), and NY (Red) sessions with their high/low ranges.
Pivot Lines: Horizontal lines marking session highs and lows that extend until broken or until the drawing cutoff time.
Pattern Labels: Automatic labeling at NY open identifying which of the four patterns has formed.
Probability Table: Real-time table showing:
Current pattern type
Instrument type (NQ/ES/YM) and day of week
Sample size (when using dynamic stats)
Primary, Secondary, and Asia target probabilities
Engulfment probability
Live confirmations as levels are taken
Color Coding:
Green background: 70%+ probability
Lime: 50-70% probability
Orange: 30-50% probability
Red: Confirmed (level taken)
Settings & Inputs
Historical Stats
Instrument Type: Select NQ, ES, or YM (each has unique probability data)
Use Dynamic Stats: Toggle between historical probabilities and live collection mode
Sessions:
Customizable session times (default: Asia 8PM-2AM, London 2AM-8AM, NY 8AM-4PM EST)
Session box transparency and colors
Toggle session boxes and text on/off
Pivots:
Show/hide pivot lines and labels
Extend pivots until mitigated or past mitigation
Alert when pivots are broken
Midpoint display option
Probabilities:
Show/hide probability table
Table position and size customization
Pattern label display toggle
Opening Prices:
Optional horizontal lines at key times (midnight,18:00, 09:30, etc.)
How to Use:
Apply to 5-minute chart of NQ, ES, or YM futures
Select your instrument in settings to match the chart
Wait for NY session open - Pattern will be identified and probabilities displayed
Monitor the probability table - Primary targets show highest probability levels
Watch for confirmations - Checkmarks appear as levels are taken
Note conditional updates - Probabilities adjust based on which level breaks first
Trading Applications:
Directional bias: High probability targets suggest likely NY session movement
Level awareness: Know which session highs/lows are most likely to be tested
Risk management: Lower probability scenarios may warrant tighter stops
Sequence planning: Conditional probabilities help anticipate multi-level moves
What Makes This Different:
Unlike standard session indicators that only display ranges, this tool:
Classifies specific overnight pattern formations:
Provides quantified probabilities based on extensive historical analysis
Updates in real-time with conditional logic as the session develops
Distinguishes between different indices (NQ/ES/YM) and days of week
Tracks level-break sequences, not just final outcomes
Notes:
Probabilities are based on historical frequencies and do not guarantee future results
Best used on 1, 5, and 15-minute timeframes for optimal session visualization
Works on continuous futures contracts or /NQ, /ES, /YM symbols

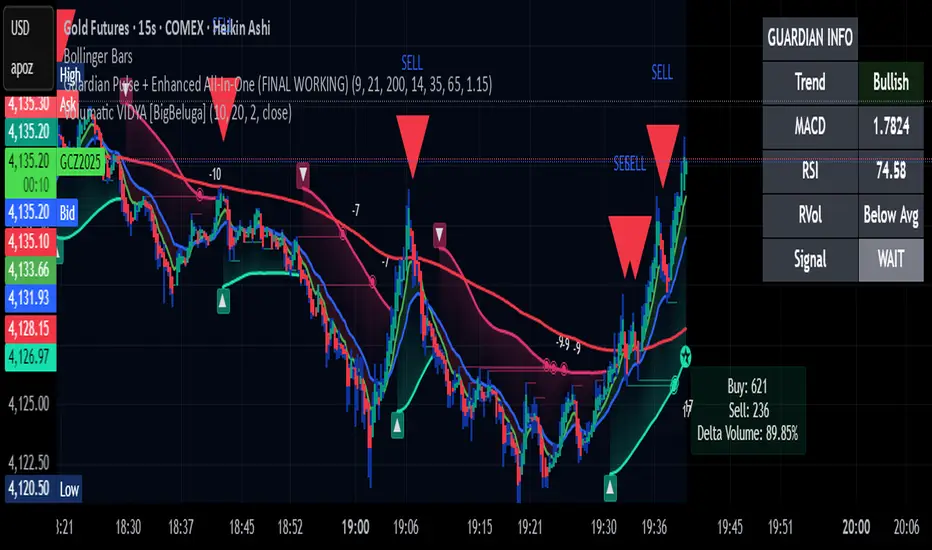
Guardian Pulse + Enhanced All-In-One (FINAL WORKING)Guardian Pulse + Enhanced All-In-OGUARDIAN PULSE – The indicator that prints bright lime candles + huge green arrows when it’s time to BUY.
Real rules (no repainting, no bullshit):
- RSI bounces off 35
- Price above the 21 EMA
- Green candle + volume spike
→ Lime candle + giant green “BUY” arrow appears
→ Red arrow = take profits / exit
What you get instantly after payment:
✅ Full Pine Script v6 code (copy-paste into TradingView)
✅ Lifetime updates (I’ll send new versions free)
✅ Works on stocks, crypto, futures, forex – any ticker, any timeframe
✅ Built-in phone alerts
Buy now → code delivered automatically in <60 seconds.ne (FINAL WORKING)

MAHI Indicator v9.5 - Smart Momentum HUD + IntradayMAHI Indicator v9.5 — Smart Momentum HUD (Multi-Framework + Intraday Engine)
A Complete Momentum, Trend, and Setup Framework for Swing, Position & Intraday Traders
MAHI v9.5 is the most advanced version yet — a highly optimized, visual, multi-framework trading system that blends momentum, trend alignment, adaptive setup detection, and now Auto-Intraday Mode for short-term traders.
This indicator acts like a Heads-Up Display (HUD) on your chart: it shows trend strength, squeeze zones, dynamic support/resistance, EMAs, setup validation, and early reversal signals in one clean interface — without clutter.
✔ Core Features
📌 1. Smart Momentum Ribbon
A dynamic EMA-based momentum band that visually shifts as trend strength changes.
Helps identify strong vs. weak momentum zones
Adapts to volatility & trend slope
Works on all timeframes (1m to 1M)
📌 2. EMA 9 → 21 Flip System
A precision trend-switching signal:
EMA 9 → 21 BULL = early bullish momentum
EMA 9 → 21 BEAR = early bearish momentum
More reliable than stand-alone MA crossovers
📌 3. Bullish Setup Engine (Standard + Weak)
Automatically identifies when price is entering a reversal-ready state based on:
Position relative to the ribbon
Candle structure
Momentum compression
Slope + exhaustion conditions
Includes:
Bull Setup (Standard) — Higher probability setup
Bull Setup (Weak) — Early or less developed setup
Setup Invalidated — Confirms that the pattern failed
This prevents false confidence & keeps traders disciplined.
📌 4. Strong Buy / Strong Sell Signals
Only appear when multiple confirmations align:
Ribbon bias
EMA slope
Momentum compression
Trend alignment
Filtered to remove noise — especially in lower timeframes.
📌 5. Multi-Timeframe Trend HUD
Top-right panel summarizing:
Overall Trend (Bullish, Bearish, Neutral)
RSI Condition
Daily vs Weekly Alignment
Trading Mode Suggestions (Buy / Sell / LEAPS / Neutral)
This gives instant context.
📌 6. Auto Intraday Engine (NEW in v9.5)
Automatically switches internal logic when you move into intraday timeframes (1m–30m):
Intraday Enhancements:
Adaptive setup detection
Faster momentum sensitivity
EMAs tuned for scalp/swing precision
Tighter invalidation logic
Reduced false positives
Optional strict filtering
Perfect for scalping, day trading & micro-trends
Works instantly — no settings needed.
Just change the chart timeframe and MAHI adjusts.
📌 7. Dynamic High-Timeframe Support (W & M)
Auto-layers weekly & monthly levels:
Helps identify strong bounce zones
Extremely useful for swing & LEAPS traders
📌 8. Weekly Volume Shelf Projection
Lightweight VWAP-style level based on weekly volume aggregation.
Shows probable bottoming areas during pullbacks.
✔ Who This Indicator Is For
Perfect for:
Day traders
Swing traders
Momentum riders
LEAPS & long-term investors
Beginner traders needing a structured system
MAHI adapts to your timeframe and trading style.
✔ Why MAHI Works
MAHI isn’t a single-signal indicator — it’s a framework.
It combines:
Trend
Momentum
Volatility
Setup pattern detection
Validation & invalidation
Multi-timeframe alignment
Dynamic zones
Intraday optimization
This eliminates guesswork and helps traders avoid the emotional traps that cause most losses.
You don’t just get a signal — you get context.
✔ How to Use It
Follow the ribbon bias
Use EMA 9→21 flips as trend confirmation
Look for Bull Setup tags during pullbacks
Avoid trades when you see Setup Invalidated
Respect weekly/monthly HTF support levels
On intraday charts — rely on auto-optimized mode
For swing entries, combine setups with HTF trend HUD
MAHI gives the map. You choose the path.
✔ Final Notes
This version is heavily optimized for performance, clarity, and high-probability signals.
MAHI does not repaint, and works on all assets including:
Stocks
Crypto
ETFs
Forex
Futures

NAS Oracle AlgoThe NAS Oracle Algo is a powerful and versatile daily trading indicator designed to provide clear, automated support and resistance levels for both long and short trading strategies. By calculating a dynamic range based on the previous day's price action, it projects key entry points, stop-losses, and up to six profit targets onto your chart, giving you a complete roadmap for the trading day.
Key Features:
Dual-Sided Strategy: Generates independent levels for BUY and SELL setups, making it effective for both directional and range-bound markets.
Customizable Reference Point: Choose between using the current day's "Open" or the previous day's "Pre Close" as the base for all calculations.
Comprehensive Levels:
Entry Level: The price level to execute a trade.
Stop Loss: A predefined level to limit potential losses.
Profit Targets (1-6): Six incremental take-profit levels, allowing for partial profit-taking strategies.
Multiple Display Options:
Visual Levels & Labels: Clean horizontal lines and text labels are drawn directly on the chart for easy price reference.
Information Table: A highly customizable data table that summarizes all key levels, which can be positioned at the Top or Bottom of the chart and resized.
Flexible Configuration: Toggle the visibility of levels and choose to show either 3 or 6 profit targets to suit your trading style and avoid chart clutter.
How to Use:
Add the Indicator: Apply the "NAS Oracle Algo" to your chart. It works best on daily and intraday timeframes.
Configure Settings: In the indicator's settings, choose your preferred Option (Open/Pre Close), toggle levels and the table on/off, and adjust their position and size.
Interpret the Signals:
BUY Setup: When the price moves above the green "Buy Above" level, consider a long entry.
Stop Loss: Place your stop loss at the BUY_SL level.
Take Profit: Scale out of your position at the six progressively higher target levels (T1 to T6).
SELL Setup: When the price moves below the red "Sell Below" level, consider a short entry.
Stop Loss: Place your stop loss at the SELL_SL level.

Guardian Pulse + Enhanced All-In-One (FINAL WORKING)GUARDIAN BUY SIGNAL (Lime Candle + Big Green Arrow)
All 4 must happen on the same candle:
RSI (14) crosses above 35 from below (bouncing out of oversold)
Price is above the blue 21 EMA (short-term trend filter)
Candle closes green (close > open)
Volume is at least 15% above its 20-period average (real buying pressure)
→ When all four line up = lime candle + huge green “BUY” arrow
→ That’s your master entry. Buy shares, calls, whatever.
GUARDIAN SELL / EXIT SIGNAL (Red Down Arrow)
RSI (14) crosses below 65 from above
→ That’s your “take profits or get out” signal (red down-triangle appears above the bar)
Optional Trend Filter (for safety)
Only take BUY signals when the overall trend is Bullish (9 EMA > 21 EMA > 200 EMA)
The info box in the top-right will say “Bullish” in green when it’s safe.
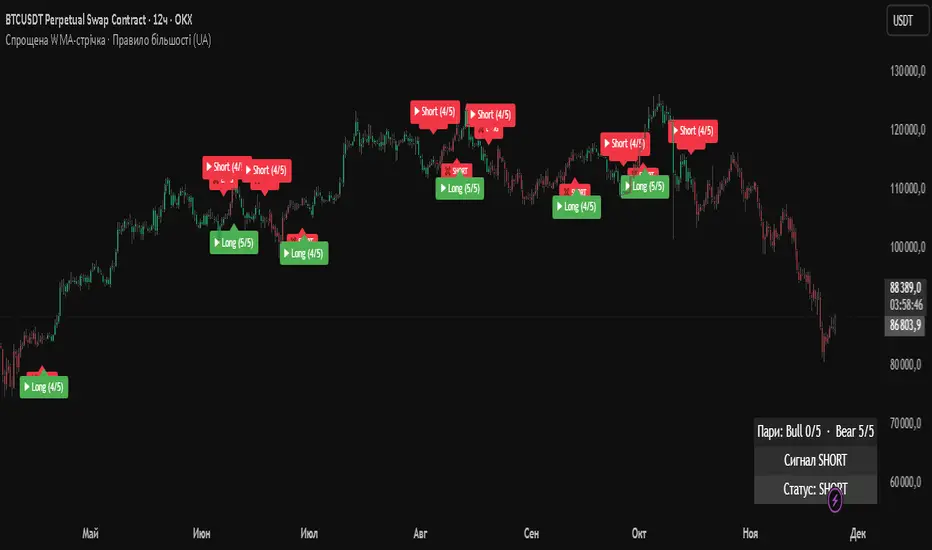
Simplified WMA Ribbon · Majority Rule StrategyThis strategy is a simplified WMA-ribbon “majority rule” system. It compares five fast WMAs (10–30) with five slow WMAs (70–90) and counts how many bullish or bearish pairs are strongly separated by a small ε-buffer. A long (short) position is opened only when a bullish (bearish) majority is reached and closed when that majority weakens or an opposite majority appears. Position size is calculated from a fixed USD amount and leverage, candles are colored by current position, and a mini dashboard shows the number of bullish/bearish pairs and the current status (LONG / SHORT / FLAT).

GraalSTRATEGY DESCRIPTION — “GRAAL”
GRAAL is an advanced algorithmic crypto-trading strategy designed for trend and semi-trend market conditions. It combines ATR-based trend/flat detection, dynamic Stop-Loss and multi-level Take-Profit, break-even (BE) logic, an optional trailing stop, and a “lock-on-trend” mechanism to hold positions until the market structure truly reverses.
The strategy is optimized for Binance, OKX and Bybit (USDT-M and USDC-M futures), but can also be used on spot as an indicator.
Core Logic
Trend Detection — dynamic trend zones built using ATR and local high/low structure.
Entry Logic — positions are opened only after trend confirmation and a momentum-based local trigger.
Exit Logic:
fixed TP levels (TP1/TP2/TP3),
dynamic ATR-based SL,
break-even move after TP1 or TP2,
optional trailing stop.
Lock-on-Trend — positions remain open until an opposite trend signal appears.
Noise Protection — flat filter disables entries during low-volatility conditions.
Key Advantages
Sophisticated and reliable risk-management system.
Minimal false entries due to robust trend filtering.
Optional trailing logic to maximize profit during strong directional moves.
Works well on BTC, ETH and major altcoins.
Easily adaptable for various timeframes (1m–4h).
Supports full automation via OKX / WunderTrading / 3Commas JSON alerts.
Recommended Use Cases
Crypto futures (USDT-M / USDC-M).
Intraday trading (5m–15m–1h).
Swing trading (4h–1D).
Fully automated signal-bot execution.
Important Notes
This is an algorithmic strategy, not financial advice.
Strategy Tester performance may differ from real execution due to liquidity, slippage and fees.
Always backtest and optimize parameters for your specific market and asset.
Recommended Settings: LONG only, no TP, no SL, Flat Policy: Hold, TP3 Mode: Trend, Trailing Stop 1.2%, Fixed size 100 USD, Leverage 10×, ATR=14, HH/LL=36.

ATR STRUCTURESTATIC LINES SET BY ATR VALUES AND MULTIPLED OBSE$RVED EPERCENTAGES more of a tool I use for me then it is for anyone else.
Index Weighted Trend Indicator s-a-t-i-s-hThis indicator gives you an idea about which side the market is trending based on the weightage of the underlying stock. Good for Nifty 50, Bank Nifty. It can be used for any market.
Would like to thanks Gemini 3, Claude , Chatgpt for helping me to get my idea live.
So here you need to update the underlying stock and the weightage daily or weekly and you will get the trend direction easily.
Avoid using in very choppy market, Use it the high volatile time and you will definitely good result.
Play around with the best setting you see for your index.

EMA Trend Pro [Hedging & Fixed Risk]
This strategy is a comprehensive trend-following system designed to capture significant market movements while strictly managing risk. It combines multiple Exponential Moving Averages (EMAs) for trend identification, ADX for trend strength filtering, and Volume confirmation to reduce false signals.
Key Features:
Hedging Mode Compatible: The script is designed to handle Long and Short positions independently. This is ideal for markets where trends can reverse quickly or for traders who prefer hedging logic (requires hedging=true in strategy settings).
Professional Risk Management: Unlike standard strategies that use fixed contract sizes, this script calculates Position Size based on Risk. You can define a fixed risk per trade (e.g., 1% of equity or $100 fixed risk). The script automatically adjusts the lot size based on the Stop Loss distance (ATR).
Multi-Stage Take Profit: The strategy scales out positions at 3 different levels (TP1, TP2, TP3) to lock in profits while letting the remaining position ride the trend.
Strategy Logic:
Trend Identification:
Long Entry: EMA 7 > EMA 14 > EMA 21 > EMA 144 (Bullish Alignment).
Short Entry: EMA 7 < EMA 14 < EMA 21 < EMA 144 (Bearish Alignment).
Filters:
ADX Filter: Entries are only taken if ADX (14) > Threshold (default 20) to ensure the market is trending, avoiding chopping ranging markets.
Volume Filter: Current volume must exceed the 20-period SMA volume by 10% to confirm momentum.
Exits & Trade Management:
Stop Loss: Dynamic SL based on ATR (e.g., 1.8x ATR).
Breakeven: Once TP1 is hit, the Stop Loss is automatically moved to Breakeven to protect capital.
Take Profits:
TP1: 1x Risk Distance (30% pos)
TP2: 2x Risk Distance (50% pos)
TP3: 3x Risk Distance (Remaining pos)
Settings Guide:
Risk Type: Choose between "Percent" (of equity) or "Fixed Amount" (USD).
Risk Value: Input your desired risk (e.g., 1.0 for 1% risk).
Fee %: Set your exchange's Taker fee (e.g., 0.05 or 0.06) for accurate backtesting.
ADX Threshold: Adjust to filter out noise (Higher = Stricter trend requirement).
Disclaimer: This script is for educational and backtesting purposes only. Past performance does not guarantee future results. Please use proper risk management.

Plot Multiple Stock Avg Buy , Stop Loss, Target(s-a-t-i-s-h)This indicator will be mostly helpful for individual, broker or consultant who deal with multiple stock purchase and would like to plot Buy Price, Stop Loss, Target, Just upload the stocks in the format given in the indicator and Voila we have all the plotting in the respective charts. Thanks to Claude for helping me to finalize my idea this indicator.
Now consultant / stock broker can give the list to there client with the respective levels and then can plot it easy with this one indicator.
Enjoy--
