Hierarchical Hidden Markov Model - Probability Cone
The Hierarchical Hidden Markov Model - Probability Cone Indicator employs Hierarchical Hidden Markov Models for forecasting future price movements in financial markets. HHMMs are statistical tools that predict transitions between hidden states, such as different market regimes, based on observed data. This makes them valuable for understanding market behaviours and projecting future price trajectories. As discussed in the Hierarchical Hidden Markov Model indicator, HHMMs predict future states and their associated outputs based on the current state and model parameters. This tool is fundamentally very similar to the traditional HMM . The application of the HHMM for generating a probability cone forecast is therefore also fundamentally the same between HMM and HHMM. Despite their significant similarity I will go through the same fundamental examples of how probability cone is generated for the HHMM as I did for the HMM probability cone .
As you might know by now the probability cone indicator uses the knowledge about the current identified "state" or "regime" and with the help of transition probabilities, emission probabilities and initial probabilities generate a probabilistic forecast of the expected future price movements. To better understand the behind the Probability Cone we encourage you to use and learn about our free version of the Probability Cone as well as for even deeper understanding the Probability Cone Pro.
WHAT ARE REGIME DEPENDENT FORECASTS
We established that the indicator creates probabilistic forecasts of future price movements dependent on the current identified "state" or market "regime" via the Hidden Markov Model. In the image below we can see an example.
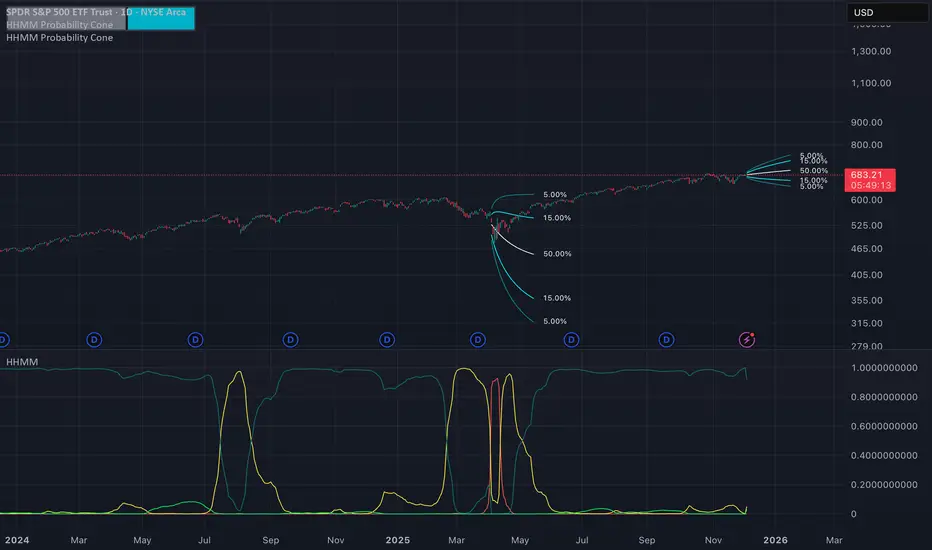
In this example we can see 4 different probability cones forecasting a 70% and 90% probability range (15% and 5% quantiles respectively). What you may notice is that the 4 probability cones look vastly different, despite using the same probability ranges as well as being generated from the same model trained on virtually the same data. What allows for this difference in the forecast, is conditioning the forecast on the current most likely identified state by the HHMM.
The first most cone is generating a forecast taking into account that the model identified the current market condition to be a extremely low in volatility this is a characteristic of the state identified by the light green coloured posterior probability. The second cone is significantly wider as well as has a negative drift, this is the case because that state identified by the red posterior probability is characterised by the most extreme volatility along with significant negative returns. The cone after that remains quite wide however is again associated with positive returns, this is characteristic of the state that the model identified via a high yelow coloured posterior probability. The last probability cone is again generated from a state that is characterised by quite low volatility albeit not the lowest. We can also see the state associated with that behaviour is identified by the high dark green posterior probability which is the highest at that time.
NOTE! Those are within sample forecasts, you can find more information on the difference between within sample model fit and out of sample prediction in the HHMM indicator description
This indicator also allows you to specify whether you wish to display probability based labels at the edges of the cone or whether you would prefer to display percent change based labels. With percent change labels you get the exact percentage value of the probabilistic increase or decrease of the price. See the example below
BARS BACK OFFSET vs DATE BASED OFFSET
The cones position can be offset by specifying the number of bars we wish to move it back similarly as with the rest of probability cone indicators. This indicator has however an additional, date based offset implemented. A user can therefore specify the position of the cone by specifying a date in the settings. The advantage of using the date based offset is that once it is turned on the user can also slide the cone up and down the chart with their mouse without having to manually adjust the date in the settings.
DIFFICULTIES WITH GENERATING FORECASTS (advanced):
The estimation of the probability cone, gets more difficult the more complex the model gets. A simple normal distribution probability cone can scale the distribution over time by simply multiplying the drift by the number of time steps and the volatility by the square root of time steps we wish to forecast for. More complex distributions often have to rely on mode advanced methods like convolutions, monte carlo or other kinds of approximations.
To estimate the probability cone forecast for the Hierarchial Hidden Markov Model, the indicator integrates two primary methodologies: Gaussian approximation and importance sampling. The Gaussian approximation is utilised for estimating the central 90% of future prices. This method provides a quick and efficient estimation within this central range, capturing the most likely price movements. The gaussian approximation will result in a forecast with an equal mean and variance as the true forecast, it will however not accurately reflect higher moments like skewness and kurtosis. For that reason the tail quantiles, which represent extreme price movements beyond the central range (90%), are estimated via importance sampling. This approach ensures a more accurate estimation of the skewness and kurtosis associated with extreme scenarios. While importance sampling leverages the flexibility of Monte Carlo as well as attempts to increase its efficiency by sampling from more precise areas of the distribution, the importance sampling may still underestimate most extreme quantiles associated with the lowest probabilities which is an inherent limitation of the indicator.
Example of gaussian approximation cone for probabilities above 5% (90% range):
Example of importance sampling cone for tail probabilities lower than 5% (beyond 90% range):
WARNING!
As per usual understand that the probabilities are estimations and best guesses based on the historical data and the patterns identified by the model and do not represent the true probability which is unknown in reality.
Settings:
- Source: Data source used for the model
- Forecast Period: Number of bars ahead for generating forecasts.
- Simulation Number: Number of Monte Carlo simulations to run in the case of importance sampling
-Body Probability: Specifies the inner range of the probability cone. The probability specifies the ammount of observations that are expected to fall outside of this range
- Tail Probability: Specifies the outter range of the probability cone. When this probability is under 5%, importance sampling will turn on
- Lock Cone: When ticked on, the cone will be locked at its current position.
- Offset Cone Based on Date: When ticked on, the position of the cone will be determined by the selected date.
- Offset: When "Offset Cone Based on Date" is turned off, you can use offset setting to specify the position of the cone projection.
- Date: When "Offset Cone Based on Date" is turned on, you can use the date setting to specify the date from which the forecast starts.
- Reestimate Model Every N Bars: This is especially useful if you wish to use the indicator on lower timeframes where model estimation might take longer than for the new datapoint to arrive. In that case you can specify after how many bars the model should be reestimated.
- Training Period: Length of historical data used to train the HMM.
- Expectation Maximization Iterations: Number of iterations for the EM algorithm.
- Cone Colors: Customizable colors for the probability cone, when approximation is on and when importance sampling is on
Forecasting
Hidden Markov Model - Probability Cone
The Hidden Markov Model - Probability Cone Indicator employs Hidden Markov Models (HMMs) for forecasting future price movements in financial markets. HMMs are statistical tools that predict transitions between hidden states, such as different market regimes, based on observed data. This makes them valuable for understanding market behaviours and projecting future price trajectories. As discussed in the Hidden Markov Model indicator, HMMs predict future states and their associated outputs based on the current state and model parameters.
The probability cone indicator therefore uses the knowledge about the current identified "state" or "regime" and with the help of transition probabilities, emission probabilities and initial probabilities generate a probabilistic forecast of the expected future price movements. To better understand the behind the Probability Cone we encourage you to use and learn about our free version of the Probability Cone as well as for even deeper understanding the Probability Cone Pro.
WHAT ARE REGIME DEPENDENT FORECASTS
As mentioned above the indicator creates probabilistic forecasts of future price movements dependent on the current identified "state" or market "regime" via the Hidden Markov Model. In the image below we can see an example.
In this example we can see 3 different probability cones forecasting a 70% and 90% probability range (15% and 5% quantiles respectively). What you may notice is that the 3 probability cones look vastly different, despite using the same probability ranges as well as being generated from the same model trained on virtually the same data. What allows for this difference in the forecast is conditioning the forecast on the current most likely identified state by the HMM.
The first most wide cone is generating a forecast taking into account that the model identified the current market condition to be a very volatile which is a characteristic of the state identified by the orange coloured posterior probability. The second cone is significantly more narrow as that state identified by the purple posterior probability is characterised by lower volatility. Nevertheless, the last probability cone is generated from the state that is characterised by the lowest volatility, we can also see the light blue posterior probability to be the highest at that time.
The indicator also allows you to specify whether you wish to display probability based labels at the edges of the cone or whether you would prefer to display percent change based labels. With percent change labels you get the exact percentage value of the probabilistic increase or decrease of the price. See the example below
BARS BACK OFFSET vs DATE BASED OFFSET
The cones position can be offset by specifying the number of bars we wish to move it back similarly as with the rest of probability cone indicators. This indicator has however an additional, date based offset implemented. A user can therefore specify the position of the cone by specifying a date in the settings. The advantage of using the date based offset is that once it is turned on the user can also slide the cone up and down the chart with their mouse without having to manually adjust the date in the settings.
DIFFICULTIES WITH GENERATING FORECASTS (advanced):
The estimation of the probability cone, gets more difficult the more complex the model gets. A simple normal distribution probability cone can scale the distribution over time by simply multiplying the drift by the number of time steps and the volatility by the square root of time steps we wish to forecast for. More complex distributions often have to rely on mode advanced methods like convolutions, monte carlo or other kinds of approximations.
To estimate the probability cone forecast for the Hidden Markov Model, the indicator integrates two primary methodologies: Gaussian approximation and importance sampling. The Gaussian approximation is utilized for estimating the central 90% of future prices. This method provides a quick and efficient estimation within this central range, capturing the most likely price movements. The gaussian approximation will result in a forecast with an equal mean and variance as the true forecast, it will however not accurately reflect higher moments like skewness and kurtosis. For that reason the tail quantiles, which represent extreme price movements beyond the central range (90%), are estimated via importance sampling. This approach ensures a more accurate estimation of the skewness and kurtosis associated with extreme scenarios. While impoortance sampling leverages the flexibility of monte carlo as well as attempts to increase its efficiency by sampling from more precise areas of the distribution, the importance sampling may still underestimate most extreme quantiles associated with the lowest probabilties which is an inherent limitation of the indicator.
Example of gaussian approximation cone for probabilities above 5% (90% range):
Example of importance sampling cone for tail probabilities lower than 5% (beyond 90% range):
WARNING!
As per usual understand that the probabilities are estimations and best guesses based on the historical data and the patterns identified by the model and do not represent the true probability which is unknown in reality.
Settings:
- Source: Data source used for the model
- Forecast Period: Number of bars ahead for generating forecasts.
- Simulation Number: Number of Monte Carlo simulations to run in the case of importance sampling
-Body Probability: Specifies the inner range of the probability cone. The probability specifies the ammount of observations that are expected to fall outside of this range
- Tail Probability: Specifies the outter range of the probability cone. When this probability is under 5%, importance sampling will turn on
- Lock Cone: When ticked on, the cone will be locked at its current position.
- Offset Cone Based on Date: When ticked on, the position of the cone will be determined by the selected date.
- Offset: When "Offset Cone Based on Date" is turned off, you can use offset setting to specify the position of the cone projection.
- Date: When "Offset Cone Based on Date" is turned on, you can use the date setting to specify the date from which the forecast starts.
- Reestimate Model Every N Bars: This is especially useful if you wish to use the indicator on lower timeframes where model estimation might take longer than for the new datapoint to arrive. In that case you can specify after how many bars the model should be reestimated.
- Training Period: Length of historical data used to train the HMM.
- Expectation Maximization Iterations: Number of iterations for the EM algorithm.
- Cone Colors: Customizable colors for the probability cone, when approximation is on and when importance sampling is on

Ultimate RSI [captainua]Ultimate RSI
Overview
This indicator combines multiple RSI calculations with volume analysis, divergence detection, and trend filtering to provide a comprehensive RSI-based trading system. The script calculates RSI using three different periods (6, 14, 24) and applies various smoothing methods to reduce noise while maintaining responsiveness. The combination of these features creates a multi-layered confirmation system that reduces false signals by requiring alignment across multiple indicators and timeframes.
The script includes optimized configuration presets for instant setup: Scalping, Day Trading, Swing Trading, and Position Trading. Simply select a preset to instantly configure all settings for your trading style, or use Custom mode for full manual control. All settings include automatic input validation to prevent configuration errors and ensure optimal performance.
Configuration Presets
The script includes preset configurations optimized for different trading styles, allowing you to instantly configure the indicator for your preferred trading approach. Simply select a preset from the "Configuration Preset" dropdown menu:
- Scalping: Optimized for fast-paced trading with shorter RSI periods (4, 7, 9) and minimal smoothing. Noise reduction is automatically disabled, and momentum confirmation is disabled to allow faster signal generation. Designed for quick entries and exits in volatile markets.
- Day Trading: Balanced configuration for intraday trading with moderate RSI periods (6, 9, 14) and light smoothing. Momentum confirmation is enabled for better signal quality. Ideal for day trading strategies requiring timely but accurate signals.
- Swing Trading: Configured for medium-term positions with standard RSI periods (14, 14, 21) and moderate smoothing. Provides smoother signals suitable for swing trading timeframes. All noise reduction features remain active.
- Position Trading: Optimized for longer-term trades with extended RSI periods (24, 21, 28) and heavier smoothing. Filters are configured for highest-quality signals. Best for position traders holding trades over multiple days or weeks.
- Custom: Full manual control over all settings. All input parameters are available for complete customization. This is the default mode and maintains full backward compatibility with previous versions.
When a preset is selected, it automatically adjusts RSI periods, smoothing lengths, and filter settings to match the trading style. The preset configurations ensure optimal settings are applied instantly, eliminating the need for manual configuration. All settings can still be manually overridden if needed, providing flexibility while maintaining ease of use.
Input Validation and Error Prevention
The script includes comprehensive input validation to prevent configuration errors:
- Cross-Input Validation: Smoothing lengths are automatically validated to ensure they are always less than their corresponding RSI period length. If you set a smoothing length greater than or equal to the RSI length, the script automatically adjusts it to (RSI Length - 1). This prevents logical errors and ensures valid configurations.
- Input Range Validation: All numeric inputs have minimum and maximum value constraints enforced by TradingView's input system, preventing invalid parameter values.
- Smart Defaults: Preset configurations use validated default values that are tested and optimized for each trading style. When switching between presets, all related settings are automatically updated to maintain consistency.
Core Calculations
Multi-Period RSI:
The script calculates RSI using the standard Wilder's RSI formula: RSI = 100 - (100 / (1 + RS)), where RS = Average Gain / Average Loss over the specified period. Three separate RSI calculations run simultaneously:
- RSI(6): Uses 6-period lookback for high sensitivity to recent price changes, useful for scalping and early signal detection
- RSI(14): Standard 14-period RSI for balanced analysis, the most commonly used RSI period
- RSI(24): Longer 24-period RSI for trend confirmation, provides smoother signals with less noise
Each RSI can be smoothed using EMA, SMA, RMA (Wilder's smoothing), WMA, or Zero-Lag smoothing. Zero-Lag smoothing uses the formula: ZL-RSI = RSI + (RSI - RSI ) to reduce lag while maintaining signal quality. You can apply individual smoothing lengths to each RSI period, or use global smoothing where all three RSIs share the same smoothing length.
Dynamic Overbought/Oversold Thresholds:
Static thresholds (default 70/30) are adjusted based on market volatility using ATR. The formula: Dynamic OB = Base OB + (ATR × Volatility Multiplier × Base Percentage / 100), Dynamic OS = Base OS - (ATR × Volatility Multiplier × Base Percentage / 100). This adapts to volatile markets where traditional 70/30 levels may be too restrictive. During high volatility, the dynamic thresholds widen, and during low volatility, they narrow. The thresholds are clamped between 0-100 to remain within RSI bounds. The ATR is cached for performance optimization, updating on confirmed bars and real-time bars.
Adaptive RSI Calculation:
An adaptive RSI adjusts the standard RSI(14) based on current volatility relative to average volatility. The calculation: Adaptive Factor = (Current ATR / SMA of ATR over 20 periods) × Volatility Multiplier. If SMA of ATR is zero (edge case), the adaptive factor defaults to 0. The adaptive RSI = Base RSI × (1 + Adaptive Factor), clamped to 0-100. This makes the indicator more responsive during high volatility periods when traditional RSI may lag. The adaptive RSI is used for signal generation (buy/sell signals) but is not plotted on the chart.
Overbought/Oversold Fill Zones:
The script provides visual fill zones between the RSI line and the threshold lines when RSI is in overbought or oversold territory. The fill logic uses inclusive conditions: fills are shown when RSI is currently in the zone OR was in the zone on the previous bar. This ensures complete coverage of entry and exit boundaries. A minimum gap of 0.1 RSI points is maintained between the RSI plot and threshold line to ensure reliable polygon rendering in TradingView. The fill uses invisible plots at the threshold levels and the RSI value, with the fill color applied between them. You can select which RSI (6, 14, or 24) to use for the fill zones.
Divergence Detection
Regular Divergence:
Bullish divergence: Price makes a lower low (current low < lowest low from previous lookback period) while RSI makes a higher low (current RSI > lowest RSI from previous lookback period). Bearish divergence: Price makes a higher high (current high > highest high from previous lookback period) while RSI makes a lower high (current RSI < highest RSI from previous lookback period). The script compares current price/RSI values to the lowest/highest values from the previous lookback period using ta.lowest() and ta.highest() functions with index to reference the previous period's extreme.
Pivot-Based Divergence:
An enhanced divergence detection method that uses actual pivot points instead of simple lowest/highest comparisons. This provides more accurate divergence detection by identifying significant pivot lows/highs in both price and RSI. The pivot-based method uses a tolerance-based approach with configurable constants: 1% tolerance for price comparisons (priceTolerancePercent = 0.01) and 1.0 RSI point absolute tolerance for RSI comparisons (pivotTolerance = 1.0). Minimum divergence threshold is 1.0 RSI point (minDivergenceThreshold = 1.0). It looks for two recent pivot points and compares them: for bullish divergence, price makes a lower low (at least 1% lower) while RSI makes a higher low (at least 1.0 point higher). This method reduces false divergences by requiring actual pivot points rather than just any low/high within a period. When enabled, pivot-based divergence replaces the traditional method for more accurate signal generation.
Strong Divergence:
Regular divergence is confirmed by an engulfing candle pattern. Bullish engulfing requires: (1) Previous candle is bearish (close < open ), (2) Current candle is bullish (close > open), (3) Current close > previous open, (4) Current open < previous close. Bearish engulfing is the inverse: previous bullish, current bearish, current close < previous open, current open > previous close. Strong divergence signals are marked with visual indicators (🐂 for bullish, 🐻 for bearish) and have separate alert conditions.
Hidden Divergence:
Continuation patterns that signal trend continuation rather than reversal. Bullish hidden divergence: Price makes a higher low (current low > lowest low from previous period) but RSI makes a lower low (current RSI < lowest RSI from previous period). Bearish hidden divergence: Price makes a lower high (current high < highest high from previous period) but RSI makes a higher high (current RSI > highest RSI from previous period). These patterns indicate the trend is likely to continue in the current direction.
Volume Confirmation System
Volume threshold filtering requires current volume to exceed the volume SMA multiplied by the threshold factor. The formula: Volume Confirmed = Volume > (Volume SMA × Threshold). If the threshold is set to 0.1 or lower, volume confirmation is effectively disabled (always returns true). This allows you to use the indicator without volume filtering if desired.
Volume Climax is detected when volume exceeds: Volume SMA + (Volume StdDev × Multiplier). This indicates potential capitulation moments where extreme volume accompanies price movements. Volume Dry-Up is detected when volume falls below: Volume SMA - (Volume StdDev × Multiplier), indicating low participation periods that may produce unreliable signals. The volume SMA is cached for performance, updating on confirmed and real-time bars.
Multi-RSI Synergy
The script generates signals when multiple RSI periods align in overbought or oversold zones. This creates a confirmation system that reduces false signals. In "ALL" mode, all three RSIs (6, 14, 24) must be simultaneously above the overbought threshold OR all three must be below the oversold threshold. In "2-of-3" mode, any two of the three RSIs must align in the same direction. The script counts how many RSIs are in each zone: twoOfThreeOB = ((rsi6OB ? 1 : 0) + (rsi14OB ? 1 : 0) + (rsi24OB ? 1 : 0)) >= 2.
Synergy signals require: (1) Multi-RSI alignment (ALL or 2-of-3), (2) Volume confirmation, (3) Reset condition satisfied (enough bars since last synergy signal), (4) Additional filters passed (RSI50, Trend, ADX, Volume Dry-Up avoidance). Separate reset conditions track buy and sell signals independently. The reset condition uses ta.barssince() to count bars since the last trigger, returning true if the condition never occurred (allowing first signal) or if enough bars have passed.
Regression Forecasting
The script uses historical RSI values to forecast future RSI direction using four methods. The forecast horizon is configurable (1-50 bars ahead). Historical data is collected into an array, and regression coefficients are calculated based on the selected method.
Linear Regression: Calculates the least-squares fit line (y = mx + b) through the last N RSI values. The calculation: meanX = sumX / horizon, meanY = sumY / horizon, denominator = sumX² - horizon × meanX², m = (sumXY - horizon × meanX × meanY) / denominator, b = meanY - m × meanX. The forecast projects this line forward: forecast = b + m × i for i = 1 to horizon.
Polynomial Regression: Fits a quadratic curve (y = ax² + bx + c) to capture non-linear trends. The system of equations is solved using Cramer's rule with a 3×3 determinant. If the determinant is too small (< 0.0001), the system falls back to linear regression. Coefficients are calculated by solving: n×c + sumX×b + sumX²×a = sumY, sumX×c + sumX²×b + sumX³×a = sumXY, sumX²×c + sumX³×b + sumX⁴×a = sumX²Y. Note: Due to the O(n³) computational complexity of polynomial regression, the forecast horizon is automatically limited to a maximum of 20 bars when using polynomial regression to maintain optimal performance. If you set a horizon greater than 20 bars with polynomial regression, it will be automatically capped at 20 bars.
Exponential Smoothing: Applies exponential smoothing with adaptive alpha = 2/(horizon+1). The smoothing iterates from oldest to newest value: smoothed = alpha × series + (1 - alpha) × smoothed. Trend is calculated by comparing current smoothed value to an earlier smoothed value (at 60% of horizon): trend = (smoothed - earlierSmoothed) / (horizon - earlierIdx). Forecast: forecast = base + trend × i.
Moving Average: Uses the difference between short MA (horizon/2) and long MA (horizon) to estimate trend direction. Trend = (maShort - maLong) / (longLen - shortLen). Forecast: forecast = maShort + trend × i.
Confidence bands are calculated using RMSE (Root Mean Squared Error) of historical forecast accuracy. The error calculation compares historical values with forecast values: RMSE = sqrt(sumSquaredError / count). If insufficient data exists, it falls back to calculating standard deviation of recent RSI values. Confidence bands = forecast ± (RMSE × confidenceLevel). All forecast values and confidence bands are clamped to 0-100 to remain within RSI bounds. The regression functions include comprehensive safety checks: horizon validation (must not exceed array size), empty array handling, edge case handling for horizon=1 scenarios, division-by-zero protection, and bounds checking for all array access operations to prevent runtime errors.
Strong Top/Bottom Detection
Strong buy signals require three conditions: (1) RSI is at its lowest point within the bottom period: rsiVal <= ta.lowest(rsiVal, bottomPeriod), (2) RSI is below the oversold threshold minus a buffer: rsiVal < (oversoldThreshold - rsiTopBottomBuffer), where rsiTopBottomBuffer = 2.0 RSI points, (3) The absolute difference between current RSI and the lowest RSI exceeds the threshold value: abs(rsiVal - ta.lowest(rsiVal, bottomPeriod)) > threshold. This indicates a bounce from extreme levels with sufficient distance from the absolute low.
Strong sell signals use the inverse logic: RSI at highest point, above overbought threshold + rsiTopBottomBuffer (2.0 RSI points), and difference from highest exceeds threshold. Both signals also require: volume confirmation, reset condition satisfied (separate reset for buy vs sell), and all additional filters passed (RSI50, Trend, ADX, Volume Dry-Up avoidance).
The reset condition uses separate logic for buy and sell: resetCondBuy checks bars since isRSIAtBottom, resetCondSell checks bars since isRSIAtTop. This ensures buy signals reset based on bottom conditions and sell signals reset based on top conditions, preventing incorrect signal blocking.
Filtering System
RSI(50) Filter: Only allows buy signals when RSI(14) > 50 (bullish momentum) and sell signals when RSI(14) < 50 (bearish momentum). This filter ensures you're buying in uptrends and selling in downtrends from a momentum perspective. The filter is optional and can be disabled. Recommended to enable for noise reduction.
Trend Filter: Uses a long-term EMA (default 200) to determine trend direction. Buy signals require price above EMA, sell signals require price below EMA. The EMA slope is calculated as: emaSlope = ema - ema . Optional EMA slope filter additionally requires the EMA to be rising (slope > 0) for buy signals or falling (slope < 0) for sell signals. This provides stronger trend confirmation by requiring both price position and EMA direction.
ADX Filter: Uses the Directional Movement Index (calculated via ta.dmi()) to measure trend strength. Signals only fire when ADX exceeds the threshold (default 20), indicating a strong trend rather than choppy markets. The ADX calculation uses separate length and smoothing parameters. This filter helps avoid signals during sideways/consolidation periods.
Volume Dry-Up Avoidance: Prevents signals during periods of extremely low volume relative to average. If volume dry-up is detected and the filter is enabled, signals are blocked. This helps avoid unreliable signals that occur during low participation periods.
RSI Momentum Confirmation: Requires RSI to be accelerating in the signal direction before confirming signals. For buy signals, RSI must be consistently rising (recovering from oversold) over the lookback period. For sell signals, RSI must be consistently falling (declining from overbought) over the lookback period. The momentum check verifies that all consecutive changes are in the correct direction AND the cumulative change is significant. This filter ensures signals only fire when RSI momentum aligns with the signal direction, reducing false signals from weak momentum.
Multi-Timeframe Confirmation: Requires higher timeframe RSI to align with the signal direction. For buy signals, current RSI must be below the higher timeframe RSI by at least the confirmation threshold. For sell signals, current RSI must be above the higher timeframe RSI by at least the confirmation threshold. This ensures signals align with the larger trend context, reducing counter-trend trades. The higher timeframe RSI is fetched using request.security() from the selected timeframe.
All filters use the pattern: filterResult = not filterEnabled OR conditionMet. This means if a filter is disabled, it always passes (returns true). Filters can be combined, and all must pass for a signal to fire.
RSI Centerline and Period Crossovers
RSI(50) Centerline Crossovers: Detects when the selected RSI source crosses above or below the 50 centerline. Bullish crossover: ta.crossover(rsiSource, 50), bearish crossover: ta.crossunder(rsiSource, 50). You can select which RSI (6, 14, or 24) to use for these crossovers. These signals indicate momentum shifts from bearish to bullish (above 50) or bullish to bearish (below 50).
RSI Period Crossovers: Detects when different RSI periods cross each other. Available pairs: RSI(6) × RSI(14), RSI(14) × RSI(24), or RSI(6) × RSI(24). Bullish crossover: fast RSI crosses above slow RSI (ta.crossover(rsiFast, rsiSlow)), indicating momentum acceleration. Bearish crossover: fast RSI crosses below slow RSI (ta.crossunder(rsiFast, rsiSlow)), indicating momentum deceleration. These crossovers can signal shifts in momentum before price moves.
StochRSI Calculation
Stochastic RSI applies the Stochastic oscillator formula to RSI values instead of price. The calculation: %K = ((RSI - Lowest RSI) / (Highest RSI - Lowest RSI)) × 100, where the lookback is the StochRSI length. If the range is zero, %K defaults to 50.0. %K is then smoothed using SMA with the %K smoothing length. %D is calculated as SMA of smoothed %K with the %D smoothing length. All values are clamped to 0-100. You can select which RSI (6, 14, or 24) to use as the source for StochRSI calculation.
RSI Bollinger Bands
Bollinger Bands are applied to RSI(14) instead of price. The calculation: Basis = SMA(RSI(14), BB Period), StdDev = stdev(RSI(14), BB Period), Upper = Basis + (StdDev × Deviation Multiplier), Lower = Basis - (StdDev × Deviation Multiplier). This creates dynamic zones around RSI that adapt to RSI volatility. When RSI touches or exceeds the bands, it indicates extreme conditions relative to recent RSI behavior.
Noise Reduction System
The script includes a comprehensive noise reduction system to filter false signals and improve accuracy. When enabled, signals must pass multiple quality checks:
Signal Strength Requirement: RSI must be at least X points away from the centerline (50). For buy signals, RSI must be at least X points below 50. For sell signals, RSI must be at least X points above 50. This ensures signals only trigger when RSI is significantly in oversold/overbought territory, not just near neutral.
Extreme Zone Requirement: RSI must be deep in the OB/OS zone. For buy signals, RSI must be at least X points below the oversold threshold. For sell signals, RSI must be at least X points above the overbought threshold. This ensures signals only fire in extreme conditions where reversals are more likely.
Consecutive Bar Confirmation: The signal condition must persist for N consecutive bars before triggering. This reduces false signals from single-bar spikes or noise. The confirmation checks that the signal condition was true for all bars in the lookback period.
Zone Persistence (Optional): Requires RSI to remain in the OB/OS zone for N consecutive bars, not just touch it. This ensures RSI is truly in an extreme state rather than just briefly touching the threshold. When enabled, this provides stricter filtering for higher-quality signals.
RSI Slope Confirmation (Optional): Requires RSI to be moving in the expected signal direction. For buy signals, RSI should be rising (recovering from oversold). For sell signals, RSI should be falling (declining from overbought). This ensures momentum is aligned with the signal direction. The slope is calculated by comparing current RSI to RSI N bars ago.
All noise reduction filters can be enabled/disabled independently, allowing you to customize the balance between signal frequency and accuracy. The default settings provide a good balance, but you can adjust them based on your trading style and market conditions.
Alert System
The script includes separate alert conditions for each signal type: buy/sell (adaptive RSI crossovers), divergence (regular, strong, hidden), crossovers (RSI50 centerline, RSI period crossovers), synergy signals, and trend breaks. Each alert type has its own alertcondition() declaration with a unique title and message.
An optional cooldown system prevents alert spam by requiring a minimum number of bars between alerts of the same type. The cooldown check: canAlert = na(lastAlertBar) OR (bar_index - lastAlertBar >= cooldownBars). If the last alert bar is na (first alert), it always allows the alert. Each alert type maintains its own lastAlertBar variable, so cooldowns are independent per signal type. The default cooldown is 10 bars, which is recommended for noise reduction.
Higher Timeframe RSI
The script can display RSI from a higher timeframe using request.security(). This allows you to see the RSI context from a larger timeframe (e.g., daily RSI on an hourly chart). The higher timeframe RSI uses RSI(14) calculation from the selected timeframe. This provides context for the current timeframe's RSI position relative to the larger trend.
RSI Pivot Trendlines
The script can draw trendlines connecting pivot highs and lows on RSI(6). This feature helps visualize RSI trends and identify potential trend breaks.
Pivot Detection: Pivots are detected using a configurable period. The script can require pivots to have minimum strength (RSI points difference from surrounding bars) to filter out weak pivots. Lower minPivotStrength values detect more pivots (more trendlines), while higher values detect only stronger pivots (fewer but more significant trendlines). Pivot confirmation is optional: when enabled, the script waits N bars to confirm the pivot remains the extreme, reducing repainting. Pivot confirmation functions (f_confirmPivotLow and f_confirmPivotHigh) are always called on every bar for consistency, as recommended by TradingView. When pivot bars are not available (na), safe default values are used, and the results are then used conditionally based on confirmation settings. This ensures consistent calculations and prevents calculation inconsistencies.
Trendline Drawing: Uptrend lines connect confirmed pivot lows (green), and downtrend lines connect confirmed pivot highs (red). By default, only the most recent trendline is shown (old trendlines are deleted when new pivots are confirmed). This keeps the chart clean and uncluttered. If "Keep Historical Trendlines" is enabled, the script preserves up to N historical trendlines (configurable via "Max Trendlines to Keep", default 5). When historical trendlines are enabled, old trendlines are saved to arrays instead of being deleted, allowing you to see multiple trendlines simultaneously for better trend analysis. The arrays are automatically limited to prevent memory accumulation.
Trend Break Detection: Signals are generated when RSI breaks above or below trendlines. Uptrend breaks (RSI crosses below uptrend line) generate buy signals. Downtrend breaks (RSI crosses above downtrend line) generate sell signals. Optional trend break confirmation requires the break to persist for N bars and optionally include volume confirmation. Trendline angle filtering can exclude flat/weak trendlines from generating signals (minTrendlineAngle > 0 filters out weak/flat trendlines).
How Components Work Together
The combination of multiple RSI periods provides confirmation across different timeframes, reducing false signals. RSI(6) catches early moves, RSI(14) provides balanced signals, and RSI(24) confirms longer-term trends. When all three align (synergy), it indicates strong consensus across timeframes.
Volume confirmation ensures signals occur with sufficient market participation, filtering out low-volume false breakouts. Volume climax detection identifies potential reversal points, while volume dry-up avoidance prevents signals during unreliable low-volume periods.
Trend filters align signals with the overall market direction. The EMA filter ensures you're trading with the trend, and the EMA slope filter adds an additional layer by requiring the trend to be strengthening (rising EMA for buys, falling EMA for sells).
ADX filter ensures signals only fire during strong trends, avoiding choppy/consolidation periods. RSI(50) filter ensures momentum alignment with the trade direction.
Momentum confirmation requires RSI to be accelerating in the signal direction, ensuring signals only fire when momentum is aligned. Multi-timeframe confirmation ensures signals align with higher timeframe trends, reducing counter-trend trades.
Divergence detection identifies potential reversals before they occur, providing early warning signals. Pivot-based divergence provides more accurate detection by using actual pivot points. Hidden divergence identifies continuation patterns, useful for trend-following strategies.
The noise reduction system combines multiple filters (signal strength, extreme zone, consecutive bars, zone persistence, RSI slope) to significantly reduce false signals. These filters work together to ensure only high-quality signals are generated.
The synergy system requires alignment across all RSI periods for highest-quality signals, significantly reducing false positives. Regression forecasting provides forward-looking context, helping anticipate potential RSI direction changes.
Pivot trendlines provide visual trend analysis and can generate signals when RSI breaks trendlines, indicating potential reversals or continuations.
Reset conditions prevent signal spam by requiring a minimum number of bars between signals. Separate reset conditions for buy and sell signals ensure proper signal management.
Usage Instructions
Configuration Presets (Recommended): The script includes optimized preset configurations for instant setup. Simply select your trading style from the "Configuration Preset" dropdown:
- Scalping Preset: RSI(4, 7, 9) with minimal smoothing. Noise reduction disabled, momentum confirmation disabled for fastest signals.
- Day Trading Preset: RSI(6, 9, 14) with light smoothing. Momentum confirmation enabled for better signal quality.
- Swing Trading Preset: RSI(14, 14, 21) with moderate smoothing. Balanced configuration for medium-term trades.
- Position Trading Preset: RSI(24, 21, 28) with heavier smoothing. Optimized for longer-term positions with all filters active.
- Custom Mode: Full manual control over all settings. Default behavior matches previous script versions.
Presets automatically configure RSI periods, smoothing lengths, and filter settings. You can still manually adjust any setting after selecting a preset if needed.
Getting Started: The easiest way to get started is to select a configuration preset matching your trading style (Scalping, Day Trading, Swing Trading, or Position Trading) from the "Configuration Preset" dropdown. This instantly configures all settings for optimal performance. Alternatively, use "Custom" mode for full manual control. The default configuration (Custom mode) shows RSI(6), RSI(14), and RSI(24) with their default smoothing. Overbought/oversold fill zones are enabled by default.
Customizing RSI Periods: Adjust the RSI lengths (6, 14, 24) based on your trading timeframe. Shorter periods (6) for scalping, standard (14) for day trading, longer (24) for swing trading. You can disable any RSI period you don't need.
Smoothing Selection: Choose smoothing method based on your needs. EMA provides balanced smoothing, RMA (Wilder's) is traditional, Zero-Lag reduces lag but may increase noise. Adjust smoothing lengths individually or use global smoothing for consistency. Note: Smoothing lengths are automatically validated to ensure they are always less than the corresponding RSI period length. If you set smoothing >= RSI length, it will be auto-adjusted to prevent invalid configurations.
Dynamic OB/OS: The dynamic thresholds automatically adapt to volatility. Adjust the volatility multiplier and base percentage to fine-tune sensitivity. Higher values create wider thresholds in volatile markets.
Volume Confirmation: Set volume threshold to 1.2 (default) for standard confirmation, higher for stricter filtering, or 0.1 to disable volume filtering entirely.
Multi-RSI Synergy: Use "ALL" mode for highest-quality signals (all 3 RSIs must align), or "2-of-3" mode for more frequent signals. Adjust the reset period to control signal frequency.
Filters: Enable filters gradually to find your preferred balance. Start with volume confirmation, then add trend filter, then ADX for strongest confirmation. RSI(50) filter is useful for momentum-based strategies and is recommended for noise reduction. Momentum confirmation and multi-timeframe confirmation add additional layers of accuracy but may reduce signal frequency.
Noise Reduction: The noise reduction system is enabled by default with balanced settings. Adjust minSignalStrength (default 3.0) to control how far RSI must be from centerline. Increase requireConsecutiveBars (default 1) to require signals to persist longer. Enable requireZonePersistence and requireRsiSlope for stricter filtering (higher quality but fewer signals). Start with defaults and adjust based on your needs.
Divergence: Enable divergence detection and adjust lookback periods. Strong divergence (with engulfing confirmation) provides higher-quality signals. Hidden divergence is useful for trend-following strategies. Enable pivot-based divergence for more accurate detection using actual pivot points instead of simple lowest/highest comparisons. Pivot-based divergence uses tolerance-based matching (1% for price, 1.0 RSI point for RSI) for better accuracy.
Forecasting: Enable regression forecasting to see potential RSI direction. Linear regression is simplest, polynomial captures curves, exponential smoothing adapts to trends. Adjust horizon based on your trading timeframe. Confidence bands show forecast uncertainty - wider bands indicate less reliable forecasts.
Pivot Trendlines: Enable pivot trendlines to visualize RSI trends and identify trend breaks. Adjust pivot detection period (default 5) - higher values detect fewer but stronger pivots. Enable pivot confirmation (default ON) to reduce repainting. Set minPivotStrength (default 1.0) to filter weak pivots - lower values detect more pivots (more trendlines), higher values detect only stronger pivots (fewer trendlines). Enable "Keep Historical Trendlines" to preserve multiple trendlines instead of just the most recent one. Set "Max Trendlines to Keep" (default 5) to control how many historical trendlines are preserved. Enable trend break confirmation for more reliable break signals. Adjust minTrendlineAngle (default 0.0) to filter flat trendlines - set to 0.1-0.5 to exclude weak trendlines.
Alerts: Set up alerts for your preferred signal types. Enable cooldown to prevent alert spam. Each signal type has its own alert condition, so you can be selective about which signals trigger alerts.
Visual Elements and Signal Markers
The script uses various visual markers to indicate signals and conditions:
- "sBottom" label (green): Strong bottom signal - RSI at extreme low with strong buy conditions
- "sTop" label (red): Strong top signal - RSI at extreme high with strong sell conditions
- "SyBuy" label (lime): Multi-RSI synergy buy signal - all RSIs aligned oversold
- "SySell" label (red): Multi-RSI synergy sell signal - all RSIs aligned overbought
- 🐂 emoji (green): Strong bullish divergence detected
- 🐻 emoji (red): Strong bearish divergence detected
- 🔆 emoji: Weak divergence signals (if enabled)
- "H-Bull" label: Hidden bullish divergence
- "H-Bear" label: Hidden bearish divergence
- ⚡ marker (top of pane): Volume climax detected (extreme volume) - positioned at top for visibility
- 💧 marker (top of pane): Volume dry-up detected (very low volume) - positioned at top for visibility
- ↑ triangle (lime): Uptrend break signal - RSI breaks below uptrend line
- ↓ triangle (red): Downtrend break signal - RSI breaks above downtrend line
- Triangle up (lime): RSI(50) bullish crossover
- Triangle down (red): RSI(50) bearish crossover
- Circle markers: RSI period crossovers
All markers are positioned at the RSI value where the signal occurs, using location.absolute for precise placement.
Signal Priority and Interpretation
Signals are generated independently and can occur simultaneously. Higher-priority signals generally indicate stronger setups:
1. Multi-RSI Synergy signals (SyBuy/SySell) - Highest priority: Requires alignment across all RSI periods plus volume and filter confirmation. These are the most reliable signals.
2. Strong Top/Bottom signals (sTop/sBottom) - High priority: Indicates extreme RSI levels with strong bounce conditions. Requires volume confirmation and all filters.
3. Divergence signals - Medium-High priority: Strong divergence (with engulfing) is more reliable than regular divergence. Hidden divergence indicates continuation rather than reversal.
4. Adaptive RSI crossovers - Medium priority: Buy when adaptive RSI crosses below dynamic oversold, sell when it crosses above dynamic overbought. These use volatility-adjusted RSI for more accurate signals.
5. RSI(50) centerline crossovers - Medium priority: Momentum shift signals. Less reliable alone but useful when combined with other confirmations.
6. RSI period crossovers - Lower priority: Early momentum shift indicators. Can provide early warning but may produce false signals in choppy markets.
Best practice: Wait for multiple confirmations. For example, a synergy signal combined with divergence and volume climax provides the strongest setup.
Chart Requirements
For proper script functionality and compliance with TradingView requirements, ensure your chart displays:
- Symbol name: The trading pair or instrument name should be visible
- Timeframe: The chart timeframe should be clearly displayed
- Script name: "Ultimate RSI " should be visible in the indicator title
These elements help traders understand what they're viewing and ensure proper script identification. The script automatically includes this information in the indicator title and chart labels.
Performance Considerations
The script is optimized for performance:
- ATR and Volume SMA are cached using var variables, updating only on confirmed and real-time bars to reduce redundant calculations
- Forecast line arrays are dynamically managed: lines are reused when possible, and unused lines are deleted to prevent memory accumulation
- Calculations use efficient Pine Script functions (ta.rsi, ta.ema, etc.) which are optimized by TradingView
- Array operations are minimized where possible, with direct calculations preferred
- Polynomial regression automatically caps the forecast horizon at 20 bars (POLYNOMIAL_MAX_HORIZON constant) to prevent performance degradation, as polynomial regression has O(n³) complexity. This safeguard ensures optimal performance even with large horizon settings
- Pivot detection includes edge case handling to ensure reliable calculations even on early bars with limited historical data. Regression forecasting functions include comprehensive safety checks: horizon validation (must not exceed array size), empty array handling, edge case handling for horizon=1 scenarios, and division-by-zero protection in all mathematical operations
The script should perform well on all timeframes. On very long historical data, forecast lines may accumulate if the horizon is large; consider reducing the forecast horizon if you experience performance issues. The polynomial regression performance safeguard automatically prevents performance issues for that specific regression type.
Known Limitations and Considerations
- Forecast lines are forward-looking projections and should not be used as definitive predictions. They provide context but are not guaranteed to be accurate.
- Dynamic OB/OS thresholds can exceed 100 or go below 0 in extreme volatility scenarios, but are clamped to 0-100 range. This means in very volatile markets, the dynamic thresholds may not widen as much as the raw calculation suggests.
- Volume confirmation requires sufficient historical volume data. On new instruments or very short timeframes, volume calculations may be less reliable.
- Higher timeframe RSI uses request.security() which may have slight delays on some data feeds.
- Regression forecasting requires at least N bars of history (where N = forecast horizon) before it can generate forecasts. Early bars will not show forecast lines.
- StochRSI calculation requires the selected RSI source to have sufficient history. Very short RSI periods on new charts may produce less reliable StochRSI values initially.
Practical Use Cases
The indicator can be configured for different trading styles and timeframes:
Swing Trading: Select the "Swing Trading" preset for instant optimal configuration. This preset uses RSI periods (14, 14, 21) with moderate smoothing. Alternatively, manually configure: Use RSI(24) with Multi-RSI Synergy in "ALL" mode, combined with trend filter (EMA 200) and ADX filter. This configuration provides high-probability setups with strong confirmation across multiple RSI periods.
Day Trading: Select the "Day Trading" preset for instant optimal configuration. This preset uses RSI periods (6, 9, 14) with light smoothing and momentum confirmation enabled. Alternatively, manually configure: Use RSI(6) with Zero-Lag smoothing for fast signal detection. Enable volume confirmation with threshold 1.2-1.5 for reliable entries. Combine with RSI(50) filter to ensure momentum alignment. Strong top/bottom signals work well for day trading reversals.
Trend Following: Enable trend filter (EMA) and EMA slope filter for strong trend confirmation. Use RSI(14) or RSI(24) with ADX filter to avoid choppy markets. Hidden divergence signals are useful for trend continuation entries.
Reversal Trading: Focus on divergence detection (regular and strong) combined with strong top/bottom signals. Enable volume climax detection to identify capitulation moments. Use RSI(6) for early reversal signals, confirmed by RSI(14) and RSI(24).
Forecasting and Planning: Enable regression forecasting with polynomial or exponential smoothing methods. Use forecast horizon of 10-20 bars for swing trading, 5-10 bars for day trading. Confidence bands help assess forecast reliability.
Multi-Timeframe Analysis: Enable higher timeframe RSI to see context from larger timeframes. For example, use daily RSI on hourly charts to understand the larger trend context. This helps avoid counter-trend trades.
Scalping: Select the "Scalping" preset for instant optimal configuration. This preset uses RSI periods (4, 7, 9) with minimal smoothing, disables noise reduction, and disables momentum confirmation for faster signals. Alternatively, manually configure: Use RSI(6) with minimal smoothing (or Zero-Lag) for ultra-fast signals. Disable most filters except volume confirmation. Use RSI period crossovers (RSI(6) × RSI(14)) for early momentum shifts. Set volume threshold to 1.0-1.2 for less restrictive filtering.
Position Trading: Select the "Position Trading" preset for instant optimal configuration. This preset uses extended RSI periods (24, 21, 28) with heavier smoothing, optimized for longer-term trades. Alternatively, manually configure: Use RSI(24) with all filters enabled (Trend, ADX, RSI(50), Volume Dry-Up avoidance). Multi-RSI Synergy in "ALL" mode provides highest-quality signals.
Practical Tips and Best Practices
Getting Started: The fastest way to get started is to select a configuration preset that matches your trading style. Simply choose "Scalping", "Day Trading", "Swing Trading", or "Position Trading" from the "Configuration Preset" dropdown to instantly configure all settings optimally. For advanced users, use "Custom" mode for full manual control. The default configuration (Custom mode) is balanced and works well across different markets. After observing behavior, customize settings to match your trading style.
Reducing Repainting: All signals are based on confirmed bars, minimizing repainting. The script uses confirmed bar data for all calculations to ensure backtesting accuracy.
Signal Quality: Multi-RSI Synergy signals in "ALL" mode provide the highest-quality signals because they require alignment across all three RSI periods. These signals have lower frequency but higher reliability. For more frequent signals, use "2-of-3" mode. The noise reduction system further improves signal quality by requiring multiple confirmations (signal strength, extreme zone, consecutive bars, optional zone persistence and RSI slope). Adjust noise reduction settings to balance signal frequency vs. accuracy.
Filter Combinations: Start with volume confirmation, then add trend filter for trend alignment, then ADX filter for trend strength. Combining all three filters significantly reduces false signals but also reduces signal frequency. Find your balance based on your risk tolerance.
Volume Filtering: Set volume threshold to 0.1 or lower to effectively disable volume filtering if you trade instruments with unreliable volume data or want to test without volume confirmation. Standard confirmation uses 1.2-1.5 threshold.
RSI Period Selection: RSI(6) is most sensitive and best for scalping or early signal detection. RSI(14) provides balanced signals suitable for day trading. RSI(24) is smoother and better for swing trading and trend confirmation. You can disable any RSI period you don't need to reduce visual clutter.
Smoothing Methods: EMA provides balanced smoothing with moderate lag. RMA (Wilder's smoothing) is traditional and works well for RSI. Zero-Lag reduces lag but may increase noise. WMA gives more weight to recent values. Choose based on your preference for responsiveness vs. smoothness.
Forecasting: Linear regression is simplest and works well for trending markets. Polynomial regression captures curves and works better in ranging markets. Exponential smoothing adapts to trends. Moving average method is most conservative. Use confidence bands to assess forecast reliability.
Divergence: Strong divergence (with engulfing confirmation) is more reliable than regular divergence. Hidden divergence indicates continuation rather than reversal, useful for trend-following strategies. Pivot-based divergence provides more accurate detection by using actual pivot points instead of simple lowest/highest comparisons. Adjust lookback periods based on your timeframe: shorter for day trading, longer for swing trading. Pivot divergence period (default 5) controls the sensitivity of pivot detection.
Dynamic Thresholds: Dynamic OB/OS thresholds automatically adapt to volatility. In volatile markets, thresholds widen; in calm markets, they narrow. Adjust the volatility multiplier and base percentage to fine-tune sensitivity. Higher values create wider thresholds in volatile markets.
Alert Management: Enable alert cooldown (default 10 bars, recommended) to prevent alert spam. Each alert type has its own cooldown, so you can set different cooldowns for different signal types. For example, use shorter cooldown for synergy signals (high quality) and longer cooldown for crossovers (more frequent). The cooldown system works independently for each signal type, preventing spam while allowing different signal types to fire when appropriate.
Technical Specifications
- Pine Script Version: v6
- Indicator Type: Non-overlay (displays in separate panel below price chart)
- Repainting Behavior: Minimal - all signals are based on confirmed bars, ensuring accurate backtesting results
- Performance: Optimized with caching for ATR and volume calculations. Forecast arrays are dynamically managed to prevent memory accumulation.
- Compatibility: Works on all timeframes (1 minute to 1 month) and all instruments (stocks, forex, crypto, futures, etc.)
- Edge Case Handling: All calculations include safety checks for division by zero, NA values, and boundary conditions. Reset conditions and alert cooldowns handle edge cases where conditions never occurred or values are NA.
- Reset Logic: Separate reset conditions for buy signals (based on bottom conditions) and sell signals (based on top conditions) ensure logical correctness.
- Input Parameters: 60+ customizable parameters organized into logical groups for easy configuration. Configuration presets available for instant setup (Scalping, Day Trading, Swing Trading, Position Trading, Custom).
- Noise Reduction: Comprehensive noise reduction system with multiple filters (signal strength, extreme zone, consecutive bars, zone persistence, RSI slope) to reduce false signals.
- Pivot-Based Divergence: Enhanced divergence detection using actual pivot points for improved accuracy.
- Momentum Confirmation: RSI momentum filter ensures signals only fire when RSI is accelerating in the signal direction.
- Multi-Timeframe Confirmation: Optional higher timeframe RSI alignment for trend confirmation.
- Enhanced Pivot Trendlines: Trendline drawing with strength requirements, confirmation, and trend break detection.
Technical Notes
- All RSI values are clamped to 0-100 range to ensure valid oscillator values
- ATR and Volume SMA are cached for performance, updating on confirmed and real-time bars
- Reset conditions handle edge cases: if a condition never occurred, reset returns true (allows first signal)
- Alert cooldown handles na values: if no previous alert, cooldown allows the alert
- Forecast arrays are dynamically sized based on horizon, with unused lines cleaned up
- Fill logic uses a minimum gap (0.1) to ensure reliable polygon rendering in TradingView
- All calculations include safety checks for division by zero and boundary conditions. Regression functions validate that horizon doesn't exceed array size, and all array access operations include bounds checking to prevent out-of-bounds errors
- The script uses separate reset conditions for buy signals (based on bottom conditions) and sell signals (based on top conditions) for logical correctness
- Background coloring uses a fallback system: dynamic color takes priority, then RSI(6) heatmap, then monotone if both are disabled
- Noise reduction filters are applied after accuracy filters, providing multiple layers of signal quality control
- Pivot trendlines use strength requirements to filter weak pivots, reducing noise in trendline drawing. Historical trendlines are stored in arrays and automatically limited to prevent memory accumulation when "Keep Historical Trendlines" is enabled
- Volume climax and dry-up markers are positioned at the top of the pane for better visibility
- All calculations are optimized with conditional execution - features only calculate when enabled (performance optimization)
- Input Validation: Automatic cross-input validation ensures smoothing lengths are always less than RSI period lengths, preventing configuration errors
- Configuration Presets: Four optimized preset configurations (Scalping, Day Trading, Swing Trading, Position Trading) for instant setup, plus Custom mode for full manual control
- Constants Management: Magic numbers extracted to documented constants for improved maintainability and easier tuning (pivot tolerance, divergence thresholds, fill gap, etc.)
- TradingView Function Consistency: All TradingView functions (ta.crossover, ta.crossunder, ta.atr, ta.lowest, ta.highest, ta.lowestbars, ta.highestbars, etc.) and custom functions that depend on historical results (f_consecutiveBarConfirmation, f_rsiSlopeConfirmation, f_rsiZonePersistence, f_applyAllFilters, f_rsiMomentum, f_forecast, f_confirmPivotLow, f_confirmPivotHigh) are called on every bar for consistency, as recommended by TradingView. Results are then used conditionally when needed. This ensures consistent calculations and prevents calculation inconsistencies.

Probability Cone ProProbability Cone Pro is based on the Expected Move Pro . While Expected Move only shows the historical value band on every bar, probability cone extend the period in the future and plot a cone or curve shape of the probable range. It plots the range from bar 1 all the way to any specified number of bars up to 1000.
Probability Cone Pro is an upgraded version of the Probability Cone indicator that uses a Normal Distribution to model the returns. This newer version uses a maximum likelihood estimation for Asymmetric Laplace distribution parameters. Asymmetric Laplace distribution takes into account fatter tails and volatility clustering during low volatility. So it will be thinner in the body (eg: <70% range) and fatter in the tails (>95% range) which fits the stock return better. Despite a better fit users should not blindly follow the probabilities derived from the indicator and should understand that these are very precise estimations of probability based on historical data, not the true probability which is in reality unknown.
When we compare the more peaked asymmetric laplace to the bell curve shaped normal distribution we can see that the asymmetric laplace fits the empirical data (blue histogram) significantly better. The fit is improved in both the body (middle peaked part) as well as in the fatter tails (more of extreme occurrences far from the center)
The area of probability range is based on an inverse cumulative distribution function. The inverse cumulative distribution gives the range of price for given input probability. People can adjust the range by adjusting the input probability in the settings. The entered probability will be shown at the edges of the cone when the “show probability” setting is on.
The indicator allows for specifying the probability for 2 quantiles on each side of the distribution , therefore 4 distinct probability values. The exact probability input is another distinction compared to the Normal Distribution based Probability Cone, in which the probability range is determined by the input of a standard deviation. Additionally now the displayed labels at the edges of the probability cone no longer correspond to the total number of outcomes that are expected to occur within the specific range, instead we chose to display the inverse which is the probability of outcomes outside of the specified range. See comparison below:
Probability cone pro with 68% and 95% ranges also defined by 16% and 2.5% probabilities at the tails on both sides:
Normal Probability cone with 68% and 95% ranges defined by 1st and 2nd standard deviation
SETTINGS:
Bars Back : Number of bars the cone is offset by.
Forecast Bar: Number of bars we forecast the cone for in the future.
Lock Cone : Specify whether we wish t lock the cone to the current bar, so it does not move when new bars arrive.
Show Probability : Specify whether you wish to show the probability labels at the edges of the cone.
Source : Source for computation of log returns whose distribution we forecast
Drift : Whether to take into account the drift in returns or assume 0 mean for the distribution.
Period: The sampling period or lookback for both the drift and the volatility estimation (full distribution estimation).
Up/Down Probabilities: 4 distinct probabilities are specified, 2 for the upper and 2 for the lower side of the distribution.

Expected Move ProExpected Move is the amount that an asset is predicted to increase or decrease from its current price, based on the current levels of volatility.
This Expected Move Pro indicator uses a maximum likelihood estimation for Asymmetric Laplace distribution parameters, and is an upgrade from the regular Expected Move indicator that uses a Normal Distribution. The use of the Asymmetric Laplace distribution ensures a probability range more accurate than the more common expected moves based on a normal distribution assumption for returns. Asymmetric Laplace distribution takes in account fatter tails and volatility clustering during low volatility. So it will be thinner in the body (eg: <70% range) and fatter in the tails (>95% range) which fits the stock return better.
When we compare the more peaked asymmetric laplace to the bell curve shaped normal distribution we can see that the asymmetric laplace fits the empirical data (blue histogram) significantly better. The fit is improved in both the body (middle peaked part) as well as in the fatter tails (more of extreme occurrences far from the center)
EXPECTED MOVE PROBABILITY:
In the expected move settings, the user can specify the range probability they wish to display. In a normal distribution a 1 standard deviation range corresponds to a range within which just under 70% of observations fall. So to specify a 70% probability range one would set 15% probability for both the upper and lower range.
For the more extreme ranges a two tail function is used so the user can only specify one probability. When 5% probability is specified the range will cover 95% and on each side of the range the probability of an occurence that extreme will be 2.5%. In the above Image we can see two tail probabilities specified at 5% and 1%, covering the 95% and 99% ranges respectively.
The indicator also allows for multi timeframe usecases. One can request a daily or perhaps even weekly expected move on an hourly chart, like we see below.
SETTINGS:
Resolution: Specify the timeframe and if you want to use the multi timeframe functionality.
Real Time : Do you wish the expected move to adjust with the current open price or do you wish it to be a forecast based on the yesterdays close. If latter, keep it OFF.
Sample Size : Lookback or the number of bars we sample in the calculation.
Optimization : Keep it on for speed purposes, only slightly higher precision will be achieved without optimization.
Probabilities: One tail - left and right, specify probability for each side of the range, two tail - single probability split in half for each side of the range
Center : Displays the central line which is the central tendency of a distribution / the median
Hide History : Hides expected moves and only the expected move for the current bar remains.
Plot Style Settings : One can adjust the line styles, box styles as well as width and transparency.

Probability Cone█ Overview:
Probability Cone is based on the Expected Move . While Expected Move only shows the historical value band on every bar, probability panel extend the period in the future and plot a cone or curve shape of the probable range. It plots the range from bar 1 all the way to bar 31.
In this model, we assume asset price follows a log-normal distribution and the log return follows a normal distribution.
Note: Normal distribution is just an assumption; it's not the real distribution of return.
The area of probability range is based on an inverse normal cumulative distribution function. The inverse cumulative distribution gives the range of price for given input probability. People can adjust the range by adjusting the standard deviation in the settings. The probability of the entered standard deviation will be shown at the edges of the probability cone.
The shown 68% and 95% probabilities correspond to the full range between the two blue lines of the cone (68%) and the two purple lines of the cone (95%). The probabilities suggest the % of outcomes or data that are expected to lie within this range. It does not suggest the probability of reaching those price levels.
Note: All these probabilities are based on the normal distribution assumption for returns. It's the estimated probability, not the actual probability.
█ Volatility Models :
Sample SD : traditional sample standard deviation, most commonly used, use (n-1) period to adjust the bias
Parkinson : Uses High/ Low to estimate volatility, assumes continuous no gap, zero mean no drift, 5 times more efficient than Close to Close
Garman Klass : Uses OHLC volatility, zero drift, no jumps, about 7 times more efficient
Yangzhang Garman Klass Extension : Added jump calculation in Garman Klass, has the same value as Garman Klass on markets with no gaps.
about 8 x efficient
Rogers : Uses OHLC, Assume non-zero mean volatility, handles drift, does not handle jump 8 x efficient.
EWMA : Exponentially Weighted Volatility. Weight recently volatility more, more reactive volatility better in taking account of volatility autocorrelation and cluster.
YangZhang : Uses OHLC, combines Rogers and Garmand Klass, handles both drift and jump, 14 times efficient, alpha is the constant to weight rogers volatility to minimize variance.
Median absolute deviation : It's a more direct way of measuring volatility. It measures volatility without using Standard deviation. The MAD used here is adjusted to be an unbiased estimator.
You can learn more about each of the volatility models in out Historical Volatility Estimators indicator.
█ How to use
Volatility Period is the sample size for variance estimation. A longer period makes the estimation range more stable less reactive to recent price. Distribution is more significant on larger sample size. A short period makes the range more responsive to recent price. Might be better for high volatility clusters.
People usually assume the mean of returns to be zero. To be more accurate, we can consider the drift in price from calculating the geometric mean of returns. Drift happens in the long run, so short lookback periods are not recommended.
The shape of the cone will be skewed and have a directional bias when the length of mean is short. It might be more adaptive to the current price or trend, but more accurate estimation should use a longer period for the mean.
Using a short look back for mean will make the cone having a directional bias.
When we are estimating the future range for time > 1, we typically assume constant volatility and the returns to be independent and identically distributed. We scale the volatility in term of time to get future range. However, when there's autocorrelation in returns( when returns are not independent), the assumption fails to take account of this effect. Volatility scaled with autocorrelation is required when returns are not iid. We use an AR(1) model to scale the first-order autocorrelation to adjust the effect. Returns typically don't have significant autocorrelation. Adjustment for autocorrelation is not usually needed. A long length is recommended in Autocorrelation calculation.
Note: The significance of autocorrelation can be checked on an ACF indicator.
ACF
Time back settings shift the estimation period back by the input number. It's the origin of when the probability cone start to estimation it's range.
E.g., When time back = 5, the probability cone start its prediction interval estimation from 5 bars ago. So for time back = 5 , it estimates the probability range from 5 bars ago to X number of bars in the future, specified by the Forecast Period (max 1000).
█ Warnings:
People should not blindly trust the probability. They should be aware of the risk evolves by using the normal distribution assumption. The real return has skewness and high kurtosis. While skewness is not very significant, the high kurtosis should be noticed. The Real returns have much fatter tails than the normal distribution, which also makes the peak higher. This property makes the tail ranges such as range more than 2SD highly underestimate the actual range and the body such as 1 SD slightly overestimate the actual range. For ranges more than 2SD, people shouldn't trust them. They should beware of extreme events in the tails.
The uncertainty in future bars makes the range wider. The overestimate effect of the body is partly neutralized when it's extended to future bars. We encourage people who use this indicator to further investigate the Historical Volatility Estimators , Fast Autocorrelation Estimator , Expected Move and especially the Linear Moments Indicator .
The probability is only for the closing price, not wicks. It only estimates the probability of the price closing at this level, not in between.

Position Size Calculator + Live R/R Panel — SMC/ICT (@PueblaATH)Position Size + Live R/R Panel — SMC/ICT (@PueblaATH)
Position Size + Live R/R Panel — SMC/ICT (@PueblaATH) is a professional-grade risk management and execution module built for Smart Money Concepts (SMC) and ICT Traders who require accurate, repeatable, institution-style trade planning.
This tool delivers precise position sizing, R:R modeling, leverage and margin projections, fee-adjusted PnL outcomes, and real-time execution metrics—all directly on the chart. Optimized for crypto, forex, and futures, it provides scalpers, day traders, and swing traders with the clarity needed to execute high-quality trades with confidence and consistency.
What the Indicator Does
Institutional Position Sizing Engine
Calculates position size based on account balance, % risk, and SL distance.
Supports custom minimum lot size rounding across crypto, FX, indices, and derivatives.
Intelligent direction logic (Auto / Long / Short) based on SMC/ICT structure.
Advanced Risk/Reward & Profit Modeling
Real-time R:R ratio using actual rounded position size.
Live PnL readout that updates with price movements.
Gross & net profit projections with full fee deduction.
Execution Planning with Draggable Levels
Entry, SL, and TP levels fully draggable for fast scenario modeling.
Automatic projected lines backward/forward with clean label alignment.
TP and SL tags include % movement from Entry, ideal for SMC/ICT journaling.
Precise modeling of real exchange fee structures
Maker fee per side
Taker fee per side
Mixed fee modes (Maker entry, Taker exit, Average, etc.)
Leverage & Margin Forecasting
Margin requirements displayed for 3 customizable leverage settings.
Helps traders understand capital commitment before executing the trade.
Useful for futures, crypto perps, and CFD setups.
Clean HUD Panel for Rapid Decision-Making
A full professional trading panel displays:
Target & actual risk
Position size
Entry / SL / TP
TP/SL percentage distance
Gross profit
Net profit (after fees)
Fees @ TP and @ SL
Live PnL
Margin requirements
Optimized for SMC & ICT Workflows
Perfect for traders using:
Breakers, FVGs, OBs
Liquidity sweeps
Session models
Precision entries (OTE, Displacement, Rebalancing)
Leverage-based execution (crypto perps, futures)
How to Use It
Attach the indicator to your chart.
Set account balance, risk %, fee model, and leverage presets.
Drag Entry, SL, and TP to shape the setup.
View instant calculations of: Position size; R:R; Net PnL after fees; Margin required
Use it as your pre-trade checklist & execution model.
Originality & Credits
This script is an original creation by @PueblaATH, released under the MPL 2.0 license.
It does not copy, modify, or repackage any existing TradingView code.
All logic—including the fee engine, margin calculator, responsive HUD, dynamic risk model, and visual execution system—is authored specifically for this indicator.

CG.8 - LONG & SHORTAccurately detects Pivot High / Pivot Low from a higher timeframe (HTF) and displays them directly on your current chart.
Key Highlights:
Draws clean horizontal lines + “LONG” / “SHORT” labels, extendable to the right
Two completely independent alerts: simply select “LONG SIGNAL” or “SHORT SIGNAL” when creating an alert (never mixed)
Full alert message: symbol + timeframe + exact price level
No repaint, no bugs, runs smoothly on all markets (crypto, forex, stocks, futures…)
Easy customization: choose HTF, Left/Right strength, toggle labels and line extension
How to use (super simple):
Paste → Add to Chart → Add Alert → choose “LONG SIGNAL” or “SHORT SIGNAL” → done!
From now on, every “beep” means a fresh higher-timeframe structure is confirmed – perfect entry timing.
Ideal for Price Action, Smart Money Concept (SMC), and ICT traders – catches tops and bottoms like textbook examples!
Author: Chinh CG
2025 Perfect Edition – zero errors, zero repaint, zero missed signals.
Wishing you all green candles and heavy profits! 🍜🚀

Quarter + 50 BandsThe indicator does two main things:
Draws a red quarter-point grid (every 25 points by default).
Draws green and blue “bands” that sit 50 points below and above each big 100-point figure.
Think of it like:
Red = your normal 25-point quarters
Green = “sweet spot” 50 points below each 100-pt handle
Blue = “sweet spot” 50 points above each 100-pt handle
It fully customizable.

Yesterday Low LineTraces a red dotted line on the low of yesterdays session for the present graph - and extends into the future

BTC Mon 8am Buy / Wed 2pm Sell (NY Time, Daily + Intraday)This strategy implements a fixed weekly time-based trading schedule for Bitcoin, using New York market hours as the reference clock. It is designed to test whether a consistent pattern exists between early-week accumulation and mid-week distribution in BTC price behavior.
Entry Rule — Monday 8:00 AM (NY Time)
The strategy enters a long position every Monday at exactly 08:00 AM Eastern Time, one hour after the U.S. equities market pre-open activity begins influencing global liquidity.
This timing attempts to capture early-week directional moves in Bitcoin, which sometimes occur as traditional markets come online.
Exit Rule — Wednesday 2:00 PM (NY Time)
The strategy closes the position every Wednesday at 2:00 PM Eastern Time, a point in the week where:
U.S. equity markets are still open
BTC often experiences mid-week volatility rotations
Liquidity is generally high
This exit removes exposure before later-week uncertainty and gives a consistent, measurable time window for each trade.
Timeframe Compatibility
Works on intraday charts (recommended 1h or lower) using precise time-based triggers.
Also runs on daily charts, where entries and exits occur on the Monday and Wednesday bars respectively (daily charts cannot show intraday timestamps).
All timestamps are synced to America/New_York regardless of the exchange’s native timezone.
Trading Frequency
Exactly one trade per week, preventing overtrading and allowing comparison of weekly performance across years of historical BTC price data.
Purpose of the Strategy
This is not a value-based or trend-following system, but a behavioral/time-cycle analysis tool.
It helps evaluate whether a repeating short-term edge exists based solely on:
Weekday timing
Liquidity cycles
Institutional market influence
BTC’s habitual early-week momentum patterns
It is ideal for:
Backtesting weekly BTC behavior
Studying time-based edges
Comparing alternative weekday/time combinations
Visualizing weekly P&L structure
Risk Notes
This strategy does not attempt to predict price direction and should not be assumed profitable without robust backtesting.
Time-based edges can appear, disappear, or invert depending on macro conditions.
There is no stop loss or risk management included by default, so the strategy reflects raw timing-based performance.

Macro Monte Carlo 10000 Prob with BootstrapMacro Monte Carlo 10000 Prob with Bootstrap — by Wongsakon Khaisaeng
1) Core Concept: Monte Carlo as a Macro-Probabilistic Lens on Future Price Paths
The Macro Monte Carlo 10000 Prob with Bootstrap indicator is designed to view future price evolution through a probabilistic and statistically grounded lens. Instead of predicting a single deterministic outcome, it generates thousands of simulated future price paths (Monte Carlo Paths) to estimate the range of possible outcomes. By analyzing the lowest and highest values reached within each simulated path, the indicator provides a macro-level understanding of how far price could realistically decline or rally within a specified forecast horizon. This approach shifts the focus from price forecasting to probability distribution estimation, enabling more robust decision-making for systematic traders, risk managers, and options strategists.
2) Historical Data Foundation: Extracting Log Returns as the Statistical Engine
Before any simulation takes place, the indicator constructs a historical library of logarithmic returns (log returns) derived from the asset’s recent price history. The user defines the lookback window (e.g., 1000 bars), allowing the system to characterize how returns behaved across various market regimes. Log returns are used because they preserve mathematical properties essential for multiplicative price processes, making them highly suitable for probabilistic modeling. This historical dataset forms the core statistical engine from which blocks of returns will later be sampled and recombined to create forward-looking scenarios.
3) Simulation Methodology: Block Bootstrap to Preserve Market Structure
Unlike traditional Monte Carlo methods that randomize every return independently, this indicator employs Block Bootstrap—a technique that samples consecutive clusters of returns rather than isolated points. By using these blocks (e.g., 24 bars per block), the simulation preserves vital market characteristics such as volatility clustering, trending behavior, and short-term autocorrelation. Each simulated path is built by sequentially appending multiple randomly selected return blocks until the forecast horizon is reached. This method produces realistic price trajectories that reflect the inherent temporal structure of financial markets rather than artificially smoothed or over-randomized paths.
4) Macro Perspective: Tracking Path-Level Minimums and Maximums
For each simulated price path, the indicator tracks two critical values:
(1) the lowest price reached within the entire future path, and
(2) the highest price reached within the same horizon.
This macro approach focuses on the extremes—how deep a drawdown could extend, or how high a rally could potentially reach—rather than the shape of the trajectory itself. The method reflects practical concerns in risk management and trading:
How low could price fall before my stop is hit?
How high could price rise before a take-profit trigger?
By generating thousands of such paths, the indicator builds a statistical distribution of future minimums and maximums across all simulations.
5) Percentile Bands: Converting Thousands of Paths into Statistical Insight
Once all minimum and maximum values are collected, the indicator calculates key percentiles of these distributions (e.g., 10th, 50th, 90th). These percentiles represent probabilistic thresholds:
The 10th percentile of minimums suggests a price level below which only 10% of simulated future paths ever fell.
The 90th percentile of maximums indicates a level reached by only the strongest 10% of simulated rallies.
User-defined percentile settings are then applied to generate Band Low and Band High, which are plotted on the chart at the final bar. These levels form a probabilistic corridor showing where future price movements are statistically likely—or unlikely—to reach within the chosen horizon. This creates a forward-looking “probability envelope” that adapts to volatility, market structure, and historical dynamics.
6) Touch Probabilities: Estimating the Likelihood of Hitting Key Price Levels
A defining feature of the indicator is the calculation of Touch Probabilities—the probability that price will hit a certain lower or upper level at least once within the simulation window.
The lower touch level defaults to 90% of the current spot price (unless overridden).
The upper touch level defaults to 110% of spot.
The indicator then measures the percentage of paths in which:
the path’s minimum falls below or equal to the lower level → P(Touch ≤ X)
the path’s maximum rises above or equal to the upper level → P(Touch ≥ Y)
This mirrors advanced risk-management methods in trading, especially in options pricing, where the central question is often: Will price breach a barrier within a given timeframe?
These probabilities can guide decisions related to hedging, position sizing, stop-loss design, or probability-based expectations for take-profit scenarios.
7) Visual Output: Probability Bands and a Structured Summary Table
To help traders interpret results visually, the indicator plots Band Low and Band High as horizontal forward-looking reference levels at the most recent bar. This provides a quick visual sense of the statistical “territory” price is expected to explore under randomized future paths.
Additionally, a structured summary table is displayed on-chart, presenting:
symbol
number of paths, horizon, block length
spot price
percentile metrics for min/max distributions
Band Low / Band High
touch probabilities
sample counts and lookback window
This table transforms the complex underlying simulation into a clear, interpretable snapshot ideal for systematic analysis and trading decisions.
8) Practical Interpretation: A Probability-Driven Tool for Systematic Decision-Making
The purpose of this indicator is not to generate trading signals but to provide a statistical foundation for evaluating risk and opportunity. Systematic traders can use the information to answer practical questions such as:
“Is the expected downside risk greater than the upside opportunity?”
“What is the probability that price reaches my take-profit before my stop?”
“How wide should my volatility-adjusted stop-loss realistically be?”
“Does the market currently favor expansion or contraction in price range?”
The tool can also assist in options strategies (e.g., barrier options, credit spreads), portfolio risk assessment, or position sizing in trend-following and mean-reversion systems. In short, it provides a macro-probability framework that enhances decision quality by grounding expectations in simulated statistical reality rather than subjective bias.

Bifurcation Early WarningBifurcation Early Warning (BEW) — Chaos Theory Regime Detection
OVERVIEW
The Bifurcation Early Warning indicator applies principles from chaos theory and complex systems research to detect when markets are approaching critical transition points — moments where the current regime is likely to break down and shift to a new state.
Unlike momentum or trend indicators that tell you what is happening, BEW tells you when something is about to change. It provides early warning of regime shifts before they occur, giving traders time to prepare for increased volatility or trend reversals.
THE SCIENCE BEHIND IT
In complex systems (weather, ecosystems, financial markets), major transitions don't happen randomly. Research has identified three universal warning signals that precede critical transitions:
1. Critical Slowing Down
As a system approaches a tipping point, it becomes "sluggish" — small perturbations take longer to decay. In markets, this manifests as rising autocorrelation in returns.
2. Variance Amplification
Short-term volatility begins expanding relative to longer-term baselines as the system destabilizes.
3. Flickering
The system oscillates between two potential states before committing to one — visible as increased crossing of mean levels.
BEW combines all three signals into a single composite score.
COMPONENTS
AR(1) Coefficient — Critical Slowing Down (Blue)
Measures lag-1 autocorrelation of returns over a rolling window.
• Rising toward 1.0: Market becoming "sticky," slow to mean-revert — transition approaching
• Low values (<0.3): Normal mean-reverting behavior, stable regime
Variance Ratio (Purple)
Compares short-term variance to long-term variance.
• Above 1.5: Short-term volatility expanding — energy building before a move
• Near 1.0: Volatility stable, no unusual pressure
Flicker Count (Yellow/Teal)
Counts state changes (crossings of the dynamic mean) within the lookback period.
• High count: Market oscillating between states — indecision before commitment
• Low count: Price firmly in one regime
INTERPRETING THE BEW SCORE
0–50 (STABLE): Normal market conditions. Existing strategies should perform as expected.
50–70 (WARNING): Elevated instability detected. Consider reducing exposure or tightening risk parameters.
70–85 (DANGER): High probability of regime change. Avoid initiating new positions; widen stops on existing ones.
85+ (CRITICAL): Bifurcation likely imminent or in progress. Expect large, potentially unpredictable moves.
HOW TO USE
As a Regime Filter
• BEW < 50: Normal trading conditions — apply your standard strategies
• BEW > 60: Elevated caution — reduce position sizes, avoid mean-reversion plays
• BEW > 80: High alert — consider staying flat or hedging existing positions
As a Preparation Signal
BEW tells you when to pay attention, not which direction. When readings elevate:
• Watch for confirmation from volume, order flow, or other directional indicators
• Prepare for breakout scenarios in either direction
• Adjust take-profit and stop-loss distances for larger moves
For Volatility Adjustment
High BEW periods correlate with larger candles. Use this to:
• Widen stops during elevated readings
• Adjust position sizing inversely to BEW score
• Set more ambitious profit targets when entering during high-BEW breakouts
Divergence Analysis
• Price making new highs/lows while BEW stays low: Trend likely to continue smoothly
• Price consolidating while BEW rises: Breakout incoming — direction uncertain but move will be significant
SETTINGS GUIDE
Core Settings
• Lookback Period: General reference period (default: 50)
• Source: Price source for calculations (default: close)
Critical Slowing Down (AR1)
• AR(1) Calculation Period: Bars used for autocorrelation (default: 100). Higher = smoother, slower.
• AR(1) Warning Threshold: Level at which AR(1) is considered elevated (default: 0.85)
Variance Growth
• Variance Short Period: Fast variance window (default: 20)
• Variance Long Period: Slow variance window (default: 100)
• Variance Ratio Threshold: Level for maximum score contribution (default: 1.5)
Regime Flickering
• Flicker Detection Period: Window for counting state changes (default: 20)
• Flicker Bandwidth: ATR multiplier for state detection — lower = more sensitive (default: 0.5)
• Flicker Count Threshold: Number of crossings for maximum score (default: 4)
TIMEFRAME RECOMMENDATIONS
• 5m–15m: Use shorter periods (AR: 30–50, Var: 10/50). Expect more noise.
• 1H: Balanced performance with default or slightly extended settings (AR: 100, Var: 20/100).
• 4H–Daily: Extend periods further (AR: 100–150, Var: 30/150). Cleaner signals, less frequent.
ALERTS
Three alert conditions are included:
• BEW Warning: Score crosses above 50
• BEW Danger: Score crosses above 70
• BEW Critical: Score crosses above 85
LIMITATIONS
• No directional bias: BEW detects instability, not direction. Combine with trend or momentum indicators.
• Not a timing tool: Elevated readings may persist for several bars before the actual move.
• Parameter sensitive: Optimal settings vary by asset and timeframe. Backtest before live use.
• Leading indicator trade-off: Early warning means some false positives are inevitable.
CREDITS
Inspired by research on early warning signals in complex systems:
• Dakos et al. (2012) — "Methods for detecting early warnings of critical transitions"
DISCLAIMER
This indicator is for educational and informational purposes only. It does not constitute financial advice. Past performance is not indicative of future results. Always conduct your own analysis and risk management. Use at your own risk.

Per Bak Self-Organized CriticalityTL;DR: This indicator measures market fragility. It measures the system's vulnerability to cascade failures and phase transitions. I've added four independent stress vectors: tail risk, volatility regime, credit stress, and positioning extremes. This allows us to quantify how susceptible markets are to disproportionate moves from small shocks, similar to how a steep sandpile is primed for avalanches.
Avalanches, forest fires, earthquakes, pandemic outbreaks, and market crashes. What do they all have in common? They are not random.
These events follow power laws - stable systems that naturally evolve toward critical states where small triggers can unleash catastrophic cascades.
For example, if you are building a sandpile, there will be a point with a little bit additional sand will cause a landslide.
Markets build fragility grain by grain, like a sandpile approaching avalanche.
The Per Bak Self-Organized Criticality (SOC) indicator detects when the markets are a few grains away from collapse.
This indicator is highly inspired by the work of Per Bak related to the science of self-organized criticality .
As Bak said:
"The earthquake does not 'know how large it will become'. Thus, any precursor state of a large event is essentially identical to a precursor state of a small event."
For markets, this means:
We cannot predict individual crash size from initial conditions
We can predict statistical distribution of crashes
We can identify periods of increased systemic risk (proximity to critical state)
BTW, this is a forwarding looking indicator and doesn't reprint. :)
The Story of Per Bak
In 1987, Danish physicist Per Bak and his colleagues discovered an important pattern in nature: self-organized criticality.
Their sandpile experiment revealed something: drop grains of sand one by one onto a pile, and the system naturally evolves toward a critical state. Most grains cause nothing. Some trigger small slides. But occasionally a single grain triggers a massive avalanche.
The key insight is that we cannot predict which grain will trigger the avalanche, but you can measure when the pile has reached a critical state.
Why Markets Are the Ultimate SOC System?
Financial markets exhibit all the hallmarks of self-organized criticality:
Interconnected agents (traders, institutions, algorithms) with feedback loops
Non-linear interactions where small events can cascade through the system
Power-law distributions of returns (fat tails, not normal distributions)
Natural evolution toward fragility as leverage builds, correlations tighten, and positioning crowds
Phase transitions where calm markets suddenly shift to crisis regimes
Mathematical Foundation
Power Law Distributions
Traditional finance assumes returns follow a normal distribution. "Markets return 10% on average." But I disagree. Markets follow power laws:
P(x) ∝ x^(-α)
Where P(x) is the probability of an event of size x, and α is the power law exponent (typically 3-4 for financial markets).
What this means: Small moves happen constantly. Medium moves are less frequent. Catastrophic moves are rare but follow predictable probability distributions. The "fat tails" are features of critical systems.
Critical Slowing Down
As systems approach phase transitions, they exhibit critical slowing down—reduced ability to absorb shocks. Mathematically, this appears as:
τ ∝ |T - T_c|^(-ν)
Where τ is the relaxation time, T is the current state, T_c is the critical threshold, and ν is the critical exponent.
Translation: Near criticality, markets take longer to recover from perturbations. Fragility compounds.
Component Aggregation & Non-Linear Emergence
The Per Bak SOC our index aggregates four normalized components (each scaled 0-100) with tunable weights:
SOC = w₁·C_tail + w₂·C_vol + w₃·C_credit + w₄·C_position
Default weights (you can change this):
w₁ = 0.34 (Tail Risk via SKEW)
w₂ = 0.26 (Volatility Regime via VIX term structure)
w₃ = 0.18 (Credit Stress via HYG/LQD + TED spread)
w₄ = 0.22 (Positioning Extremes via Put/Call ratio)
Each component uses percentile ranking over a 252-day lookback combined with absolute thresholds to capture both relative regime shifts and extreme absolute levels.
The Four Pillars Explained
1. Tail Risk (SKEW Index)
Measures options market pricing of fat-tail events. High SKEW indicates elevated outlier probability.
C_tail = 0.7·percentrank(SKEW, 252) + 0.3·((SKEW - 115)/0.5)
2. Volatility Regime (VIX Term Structure)
Combines VIX level with term structure slope. Backwardation signals acute stress.
C_vol = 0.4·VIX_level + 0.35·VIX_slope + 0.25·VIX_ratio
3. Credit Stress (HYG/LQD + TED Spread)
Tracks high-yield deterioration versus investment-grade and interbank lending stress.
C_credit = 0.65·percentrank(LQD/HYG, 252) + 0.35·(TED/0.75)·100
4. Positioning Extremes (Put/Call Ratio)
Detects extreme hedging demand through percentile ranking and z-score analysis.
C_position = 0.6·percentrank(P/C, 252) + 0.4·zscore_normalized
What the Indicator Really Measures?
Not Volatility but Fragility
Markets Going Down ≠ Fragility Building (actually when markets go down, risk and fragility are released)
The 0-100 Scale & Regime Thresholds
The indicator outputs a 0-100 fragility score with four regimes:
🟢 Safe (0-39): System resilient, can absorb normal shocks
🟡 Building (40-54): Early fragility signs, watch for deterioration
🟠 Elevated (55-69): System vulnerable
🔴 Critical (70-100): Highly susceptible to cascade failures
Further Reading for Nerds
Bak, P., Tang, C., & Wiesenfeld, K. (1987). "Self-organized criticality: An explanation of 1/f noise." Physical Review Letters.
Bak, P. & Chen, K. (1991). "Self-organized criticality." Scientific American.
Bak, P. (1996). How Nature Works: The Science of Self-Organized Criticality. Copernicus.
Feedback is appreciated :)

Echo Chamber [theUltimator5]The Echo Chamber - When history repeats, maybe you should listen.
Ever had that eerie feeling you've seen this exact price action before? The Echo Chamber doesn't just give you déjà vu—it mathematically proves it, scales it, and projects what happened next.
📖 WHAT IT DOES
The Echo Chamber is an advanced pattern recognition tool that scans your chart's history to find segments that closely match your current price action. But here's where it gets interesting: it doesn't just find similar patterns - It expands and contracts the time window to create a uniquely scaled fractal. Patterns don't always follow the same timeframe, but they do follow similar patterns.
Using a custom correlation analysis algorithm combined with flexible time-scaling, this indicator:
Finds historical price segments that mirror your current market structure
Scales and overlays them perfectly onto your current chart
Projects forward what happened AFTER that historical match
Gives you a visual "echo" from the past with a glimpse into potential futures
══════════════════════════════
HOW TO USE IT
This indicator starts off in manual mode, which means that YOU, the user, can select the point in time that you want to project from. Simply click on a point in time to set the starting value.
Once you select your point in time, the indicator will automatically plot the chosen historical chart pattern and correlation over the current chart and project the price forwards based on how the chart looked in the past. If you want to change the point in time, you can update it from the settings, or drag the point on the chart over to a new position.
You can manually select any point in time, and the chart will quickly update with the new pattern. A correlation will be shown in a table alongside the date/timestamp of the selected point in time.
You can switch to auto mode, which will automatically search out the best-fit pattern over a defined lookback range and plot the past/future projection for you without having to manually select a point in time at all. It simply finds the best fit for you.
You can change the scale factor by adjusting multiplication and division variables to find time-scaled fractal patterns.
══════════════════════════════
🎯 KEY FEATURES
Two Operating Modes:
🔧 MANUAL MODE - Select any historical point and see how it correlates with current price action in real-time. Perfect for:
• Analyzing specific past events (crashes, rallies, consolidations)
• Testing historical patterns against current conditions
• Educational analysis of market structure repetition
🤖 AUTO MODE - It automatically scans through your lookback period to find the single best-correlated historical match. Ideal for:
• Quick pattern discovery
• Systematic trading approach
• Unbiased pattern recognition
Time Warp Technology:
The time warp feature expands and compresses the correlation window to provide a custom fractal so you can analyze windows of time that don't necessarily match the current chart.
💡 *Example: Multiplier=3, Divisor=2 gives you a 1.5x time stretch—perfect for finding patterns that played out 50% slower than current price action.*
Drawing Modes:
Scale Only : Pure vertical scaling—matches price range while maintaining temporal alignment at bar 0
Rotate & Scale : Advanced geometric transformation that anchors both the start AND end points, creating a rotated fit that matches your current segment's slope and range
Visual Components:
🟠 Orange Overlay : The historical match, perfectly scaled to your current price action
🟣 Purple Projection : What happened NEXT after that historical pattern (dotted line into the future)
📦 Highlight Boxes : Shows you exactly where in history these patterns came from
📊 Live Correlation Table : Real-time correlation coefficient with color-coded strength indicator
══════════════════════════════
⚙️ PARAMETERS EXPLAINED
Correlation Window Length (20) : How many bars to match. Smaller = more precise matches but noisier. Larger = broader patterns but fewer matches.
Note: if this value is too high in auto mode, the script may time out from computational overload.
Multiplication Factor : Historical time multiplier. 2 = sample every 2nd bar from history. Higher values find slower historical patterns.
Division Factor : Historical time divisor applied after multiplication. Final sample rate = (Length × Factor) ÷ Divisor, rounded down.
Lookback Range : How far back to search for patterns. More history = better chance of finding matches but slower performance.
Note: if this value is too high in auto mode, the script may time out from computational overload.
Future Projection Length : How many bars forward to project from the historical match. Your crystal ball's focal length.
══════════════════════════════
💼 TRADING APPLICATIONS
Trend Continuation/Reversal :
If the purple projection continues the current trend, that's your historical confirmation. If it reverses, you've found a potential turning point that's happened before under similar conditions.
Support/Resistance Validation :
Does the projection respect your S/R levels? History suggests those levels matter. Does it break through? You've found historical precedent for a breakout.
Time-Based Exits :
The projection shows not just WHERE price might go, but WHEN. Use it to anticipate timing of moves.
Multi-Timeframe Analysis :
Use time compression to overlay higher timeframe patterns onto lower timeframes. See daily patterns on hourly charts, weekly on daily, etc.
Pattern Education :
In Manual Mode, study how specific historical events correlate with current conditions. Build your pattern recognition library.
══════════════════════════════
📊 CORRELATION TABLE
The table shows your correlation coefficient as a percentage:
80-100%: Extremely strong correlation—history is practically repeating
60-80%: Strong correlation—significant similarity
40-60%: Moderate correlation—some structural similarity
20-40%: Weak correlation—limited similarity
0-20%: Very weak correlation—essentially random match
-20-40%: Weak inverse correlation
-40-60%: Moderate inverse correlation
-60-80%: Strong inverse correlation
-80-100%: Extremely strong inverse correlation—history is practically inverting
**Important**: The correlation measures SHAPE similarity, not price level. An 85% correlation means the price movements follow a very similar pattern, regardless of whether prices are higher or lower.
══════════════════════════════
⚠️ IMPORTANT DISCLAIMERS
- Past performance does NOT guarantee future results (but it sure is interesting to study)
- High correlation doesn't mean causation—markets are complex adaptive systems
- Use this as ONE tool in your analytical toolkit, not a standalone trading system
- The projection is what HAPPENED after a similar pattern in the past, not a prediction
- Always use proper risk management regardless of what the Echo Chamber suggests
══════════════════════════════
🎓 PRO TIPS
1. Start with Auto Mode to find high-correlation matches, then switch to Manual Mode to study why that period was similar
2. Experiment with time warping on different timeframes—a 2x factor on a daily chart lets you see weekly patterns
3. Watch for correlation decay —if correlation drops sharply after the match, current conditions are diverging from history
4. Combine with volume —check if volume patterns also match
5. Use "Rotate & Scale" mode when the current trend angle differs from the historical match
6. Increase lookback range to 500-1000+ on daily/weekly charts for finding rare historical parallels
══════════════════════════════
🔧 TECHNICAL NOTES
- Uses Pearson correlation coefficient for pattern matching
- Implements range-based scaling to normalize different price levels
- Rotation mode uses linear interpolation for geometric transformation
- All calculations are performed on close prices
- Boxes highlight actual historical bar ranges (high/low)
- Maximum of 500 lines and 500 boxes for performance optimization

FUSED 9.5 INSTITUTIONAL [FINAL] - AgTradezInstitutional style Indicator that gives you trend direction, MSS, with Tp levels and much more.

BTC Price Prediction Model [Global PMI]V2🇺🇸 English Guide
1. Introduction
This indicator was created by GW Capital using Gemini Vibe Coding technology. It leverages advanced AI coding capabilities to reconstruct complex macroeconomic models into actionable trading tools.
2. Credits
Special thanks to the original model author, Marty Kendall. His research into the correlation between Bitcoin's price and macroeconomic factors lays the foundation for this algorithm.
3. Model Principles & Formula
This model calculates the "Fair Value" of Bitcoin based on four key macroeconomic pillars. It assumes that Bitcoin's price is a function of Global Liquidity, Network Security, Risk Appetite, and the Economic Cycle.
💡 Unique Insight: PMI & The 4-Year Cycle
A key distinguishing feature of this model is the hypothesis that Bitcoin's famous "4-Year Halving Cycle" may be intrinsically linked to the Global Business Cycle (PMI), rather than just supply shocks.
Therefore, the model incorporates PMI as a valuation "Amplifier".
Note: Due to TradingView data limitations, US PMI is currently used as the proxy for the global cycle.
The Formula
$$\ln(BTC) = \alpha + (1 + \beta \cdot PMI_{z}) \times $$
Global Liquidity (M2): Sum of M2 supply from US, China, Eurozone, and Japan (converted to USD). Represents the pool of fiat money available to flow into assets.
Network Security (Hashrate): Bitcoin's hashrate, representing the physical security and utility of the network.
Risk Appetite (S&P 500): Used as a proxy for global risk sentiment.
Economic Cycle (PMI Z-Score): US Manufacturing PMI is used to amplify or dampen the valuation based on where we are in the business cycle (Expansion vs. Contraction).
4. How to Use
The indicator plots the Fair Value (White Line) and four sentiment bands based on statistical deviation (Z-Score).
Sentiment Zones
🚨 Extreme Greed (Red Zone): Price > +0.3 StdDev. Historically indicates a market top or overheated sentiment.
⚠️ Greed (Orange Zone): Price > +0.15 StdDev. Bullish momentum is strong but caution is advised.
⚖️ Fair Value (White Line): The theoretical "correct" price based on macro data.
😨 Fear (Teal Zone): Price < -0.15 StdDev. Undervalued territory.
💎 Extreme Fear (Green Zone): Price < -0.3 StdDev. Historically a generational buying opportunity.
Sentiment Score (0-100)
100: Maximum Greed (Top)
50: Fair Value
0: Maximum Fear (Bottom)
5. Usage Recommendations
Timeframe: Daily (1D) or Weekly (1W) ONLY.
Reason: The underlying data sources (M2, PMI) are updated monthly. The S&P 500 and Hashrate are daily. Using this indicator on intraday charts (e.g., 15m, 1h, 4h) adds no value because the fundamental data does not change that fast.
Long-Term View: This is a macro-cycle indicator designed for identifying cycle tops and bottoms over months and years, not for day trading.
6. Disclaimer
This indicator is for educational and informational purposes only. It does not constitute financial advice. The model relies on historical correlations which may not hold true in the future. All trading involves risk. GW Capital and the creators assume no responsibility for any trading losses.
7. Support Us ❤️
If you find this indicator useful, please Boost 👍, Comment, and add it to your Favorites! Your support keeps us going.
🇨🇳 中文说明 (Chinese Version)
1. 简介
本指标由 GW Capital 使用 Gemini Vibe Coding 技术制作。利用先进的 AI 编程能力,将复杂的宏观经济模型重构为可执行的交易工具。
2. 致谢
特别感谢模型原作者 Marty Kendall。他对这一算法的研究奠定了基础,揭示了比特币价格与宏观经济因素之间的深层联系。
3. 模型原理与公式
该模型基于四大宏观经济支柱计算比特币的“公允价值”。它假设比特币的价格是全球流动性、网络安全性、风险偏好和经济周期的函数。
💡 独家洞察:PMI 与 4年周期
本模型的一个核心独特之处在于:我们认为比特币著名的“4年减半周期”背后的真正驱动力,可能与全球商业周期 (PMI) 高度同步,而不仅仅是供应减半。
因此,模型特别引入 PMI 作为估值的“放大器” (Amplifier)。
注:由于 TradingView 数据源限制,目前采用历史数据最详尽的美国 PMI 作为全球周期的代理指标。
模型公式
$$\ln(BTC) = \alpha + (1 + \beta \cdot PMI_{z}) \times $$
全球流动性 (M2): 美、中、欧、日四大经济体的 M2 总量(折算为美元)。代表可流入资产的法币资金池。
网络安全性 (Hashrate): 比特币全网算力,代表网络的物理安全性和实用价值。
风险偏好 (S&P 500): 作为全球风险情绪的代理指标。
经济周期 (PMI Z-Score): 美国制造业 PMI 用于根据商业周期(扩张 vs 收缩)来放大或抑制估值。
4. 指标用法
指标会在图表上绘制 公允价值 (白线) 以及基于统计偏差 (Z-Score) 的四条情绪带。
情绪区间
🚨 极度贪婪 (红色区域): 价格 > +0.3 标准差。历史上通常预示市场顶部或情绪过热。
⚠️ 一般贪婪 (橙色区域): 价格 > +0.15 标准差。多头动能强劲,但需谨慎。
⚖️ 公允价值 (白线): 基于宏观数据的理论“正确”价格。
😨 一般恐惧 (青色区域): 价格 < -0.15 标准差。进入低估区域。
💎 极度恐惧 (绿色区域): 价格 < -0.3 标准差。历史上通常是代际级别的买入机会。
情绪评分 (0-100)
100: 极度贪婪 (顶部)
50: 公允价值
0: 极度恐惧 (底部)
5. 使用建议
周期: 仅限日线 (1D) 或周线 (1W)。
原因: 底层数据源(M2, PMI)是月度更新的。标普500和算力是日度更新的。在日内图表(如15分钟、1小时、4小时)上使用此指标没有任何意义,因为基本面数据不会变化得那么快。
长期视角: 这是一个宏观周期指标,旨在识别数月甚至数年的周期顶部和底部,而非用于日内交易。
6. 免责声明
本指标仅供教育和参考使用,不构成任何财务建议。该模型依赖于历史相关性,未来可能不再适用。所有交易均涉及风险。GW Capital 及制作者不对任何交易损失承担责任。

BTC Price Prediction Model [Global PMI]🇨🇳 中文说明 (Chinese Version)
1. 简介
本指标由 GW Capital 使用 Gemini Vibe Coding 技术制作。利用先进的 AI 编程能力,将复杂的宏观经济模型重构为可执行的交易工具。
2. 致谢
特别感谢模型原作者 Marty Kendall。他对这一算法的研究奠定了基础,揭示了比特币价格与宏观经济因素之间的深层联系。
3. 模型原理与公式
该模型基于四大宏观经济支柱计算比特币的“公允价值”。它假设比特币的价格是全球流动性、网络安全性、风险偏好和经济周期的函数。
模型公式
$$\ln(BTC) = \alpha + (1 + \beta \cdot PMI_{z}) \times $$
全球流动性 (M2): 美、中、欧、日四大经济体的 M2 总量(折算为美元)。代表可流入资产的法币资金池。
网络安全性 (Hashrate): 比特币全网算力,代表网络的物理安全性和实用价值。
风险偏好 (S&P 500): 作为全球风险情绪的代理指标。
经济周期 (PMI Z-Score): 美国制造业 PMI 用于根据商业周期(扩张 vs 收缩)来放大或抑制估值。
4. 指标用法
指标会在图表上绘制 公允价值 (白线) 以及基于统计偏差 (Z-Score) 的四条情绪带。
情绪区间
🚨 极度贪婪 (红色区域): 价格 > +0.3 标准差。历史上通常预示市场顶部或情绪过热。
⚠️ 一般贪婪 (橙色区域): 价格 > +0.15 标准差。多头动能强劲,但需谨慎。
⚖️ 公允价值 (白线): 基于宏观数据的理论“正确”价格。
😨 一般恐惧 (青色区域): 价格 < -0.15 标准差。进入低估区域。
💎 极度恐惧 (绿色区域): 价格 < -0.3 标准差。历史上通常是代际级别的买入机会。
情绪评分 (0-100)
100: 极度贪婪 (顶部)
50: 公允价值
0: 极度恐惧 (底部)
5. 使用建议
周期: 仅限日线 (1D) 或周线 (1W)。
原因: 底层数据源(M2, PMI)是月度更新的。标普500和算力是日度更新的。在日内图表(如15分钟、1小时、4小时)上使用此指标没有任何意义,因为基本面数据不会变化得那么快。
长期视角: 这是一个宏观周期指标,旨在识别数月甚至数年的周期顶部和底部,而非用于日内交易。
6. 免责声明
本指标仅供教育和参考使用,不构成任何财务建议。该模型依赖于历史相关性,未来可能不再适用。所有交易均涉及风险。GW Capital 及制作者不对任何交易损失承担责任。
🇺🇸 English Guide (英文说明)
1. Introduction
This indicator was created by GW Capital using Gemini Vibe Coding technology. It leverages advanced AI coding capabilities to reconstruct complex macroeconomic models into actionable trading tools.
2. Credits
Special thanks to the original model author, Marty Kendall. His research into the correlation between Bitcoin's price and macroeconomic factors lays the foundation for this algorithm.
3. Model Principles & Formula
This model calculates the "Fair Value" of Bitcoin based on four key macroeconomic pillars. It assumes that Bitcoin's price is a function of Global Liquidity, Network Security, Risk Appetite, and the Economic Cycle.
The Formula
$$\ln(BTC) = \alpha + (1 + \beta \cdot PMI_{z}) \times $$
Global Liquidity (M2): Sum of M2 supply from US, China, Eurozone, and Japan (converted to USD). Represents the pool of fiat money available to flow into assets.
Network Security (Hashrate): Bitcoin's hashrate, representing the physical security and utility of the network.
Risk Appetite (S&P 500): Used as a proxy for global risk sentiment.
Economic Cycle (PMI Z-Score): US Manufacturing PMI is used to amplify or dampen the valuation based on where we are in the business cycle (Expansion vs. Contraction).
4. How to Use
The indicator plots the Fair Value (White Line) and four sentiment bands based on statistical deviation (Z-Score).
Sentiment Zones
🚨 Extreme Greed (Red Zone): Price > +0.3 StdDev. Historically indicates a market top or overheated sentiment.
⚠️ Greed (Orange Zone): Price > +0.15 StdDev. Bullish momentum is strong but caution is advised.
⚖️ Fair Value (White Line): The theoretical "correct" price based on macro data.
😨 Fear (Teal Zone): Price < -0.15 StdDev. Undervalued territory.
💎 Extreme Fear (Green Zone): Price < -0.3 StdDev. Historically a generational buying opportunity.
Sentiment Score (0-100)
100: Maximum Greed (Top)
50: Fair Value
0: Maximum Fear (Bottom)
5. Usage Recommendations
Timeframe: Daily (1D) or Weekly (1W) ONLY.
Reason: The underlying data sources (M2, PMI) are updated monthly. The S&P 500 and Hashrate are daily. Using this indicator on intraday charts (e.g., 15m, 1h, 4h) adds no value because the fundamental data does not change that fast.
Long-Term View: This is a macro-cycle indicator designed for identifying cycle tops and bottoms over months and years, not for day trading.
6. Disclaimer
This indicator is for educational and informational purposes only. It does not constitute financial advice. The model relies on historical correlations which may not hold true in the future. All trading involves risk. GW Capital and the creators assume no responsibility for any trading losses.

Pythia — 33 FULLPythia — v33 (Full Edition)
Analysis of Structure, Divergences, and Energy Conditions
Description
Pythia Full visualizes the structural characteristics of price movement and the internal conditions that accompany changes in market behavior.
The indicator highlights moments when impulse slows down, when energy diverges from price, when structural inconsistencies appear, or when the market shows early signs of instability.
It relies on time-based, price-based, and energy-based metrics, combining them into a unified system of visual elements.
________________________________________
Setup
Only five main parameters are required for practical use.
The built-in HUD helps evaluate how chosen settings influence the indicator’s behavior.
Additional parameters are pre-configured and optimized for a wide range of instruments.
________________________________________
What Pythia Displays
• structural conditions associated with changes in movement dynamics
• micro- and macro-divergences
• areas where impulse slows or loses stability
• combinations of energy and price movement (EnergyTrap / PriceTrap)
• sudden impulsive spikes
• time-based zones where movement compresses or changes character
• local flow conditions (Flow)
• internal directional metrics (inner-channel logic)
These elements form a structural map of the chart, helping to interpret the current movement context.
________________________________________
Core Modules
1. TTC Zones (Time-To-Collapse)
Show areas where movement historically loses impulse.
Highlight time and price conditions affecting the stability of the current swing.
2. Micro- and Macro-Divergences
Micro — local discrepancies between price and MACD.
Macro — larger-cycle structural divergences.
3. Energy Conditions
Significant micro-divergences receive an energy assessment to distinguish stronger discrepancies from weaker ones.
4. Movement Traps
EnergyTrap — elevated energy load with limited price result.
PriceTrap — notable price movement with low energy.
Both help identify unstable combinations of impulse and result.
5. Impulsive Spikes
Mark sharp price expansions, energy surges, and subsequent instability zones.
6. Flow Mode
Evaluates local changes in the energy-flow context.
7. Inner-Channel Logic
Used internally within Flow to refine directional characteristics of the movement.
8. OR-Impulses
Rare energy bursts that help identify structural features of local movement.
Interpretation of Chart Markers (1–15)
(with version availability: Full / Standard / Lite)
________________________________________
1 — Pre-Flow Divergence
What it is:
A divergence displayed in a pale version of the trend color, showing early price-energy discrepancy while price moves in a strong impulse.
Why it matters:
Signals that a regular divergence may be ignored because the market still has enough momentum to continue without correction.
How to use:
Not a reversal entry.
Wait for impulse weakening or confirmation from traps, micro-divergences, TTC, or the Catcher zone.
Versions:
(Full, Standard — limited, Lite — not included)
________________________________________
2 — Regular Bearish Divergence
What it is:
A classic discrepancy between price and momentum.
Why it matters:
Shows weakening of the current swing and increases the probability of correction or reversal.
How to use:
Useful for exits or timing counter-trend entries.
Best when combined with traps, TTC, or the Catcher zone.
Versions:
(Full, Standard, Lite)
________________________________________
3 — Divergence Energy Indicator
What it is:
A marker showing how strong the divergence energy load is.
Why it matters:
Helps separate weak divergences from structurally significant ones.
How to use:
High-energy divergences carry greater reversal potential.
Versions:
(Full, Standard — no, Lite — no)
________________________________________
4 — Trap Cloud: Mass Without Impulse
What it is:
A cloud indicating significant trade mass with minimal price progress.
Why it matters:
Shows hidden exhaustion or buildup before a directional change.
How to use:
When combined with divergences or the Catcher zone, attention increases.
Lite uses micro-markers instead of clouds.
Versions:
(Full, Standard, Lite — limited)
________________________________________
5 — Trap Cloud: Impulse Without Mass
What it is:
Shows small clusters of relatively large trades producing impulse without depth.
Why it matters:
Often indicates unstable or misleading moves.
How to use:
Strengthens reversal probability when combined with divergences.
Versions:
(Full, Standard, Lite — limited)
________________________________________
6 — Post-Impulse Oscillation Window
What it is:
The time window after an impulse-shift marker (7).
Why it matters:
Shows whether the new impulse strengthened or faded.
How to use:
Supports reading the stability of short-term structural breaks.
Versions:
(Full, Standard — no, Lite — no)
________________________________________
7 — Instant Impulse-Shift Marker
What it is:
A marker showing a sudden change in structural impulse.
Why it matters:
These points often precede short-term acceleration or instability.
How to use:
Especially meaningful when appearing near traps or divergences.
Versions:
(Full, Standard — no, Lite — no)
________________________________________
8 — Growing Price–Energy Discrepancy
What it is:
Marks increasing separation between price progress and energy behavior.
Why it matters:
Often precedes divergence formation or weakening of movement.
How to use:
Use as an early attention signal, especially when clusters appear.
Versions:
(Full, Standard — no, Lite — no)
________________________________________
9 — Collapsed Micro-Divergences
What it is:
Micro-divergences that formed but collapsed.
Why it matters:
Clusters of such points often reflect hidden weakness.
How to use:
Multiple collapsed micro-divs frequently precede structural slowing.
Versions:
(Full, Standard, Lite)
________________________________________
10 — Low-Energy Uncertainty Cloud
What it is:
A weak instability cloud similar to marker 7 but less pronounced.
Why it matters:
Marks zones where the market struggles with direction.
How to use:
Strengthens reversal context when inside a Catcher zone.
Versions:
(Full, Standard — no, Lite — no)
________________________________________
11 — Catcher Zone Marker
What it is:
Marks the moment a Catcher zone was created.
Why it matters:
Even if the zone collapses, the marker remains as evidence of structural preparation.
How to use:
If traps or divergences appear afterward, reversal probability increases.
Versions:
(Full, Standard, Lite)
________________________________________
12 — Catcher Zone (Forecast Window for Divergence)
What it is:
A dynamic zone predicting where a divergence is most likely to appear.
Why it matters:
Helps anticipate reversal signals earlier and with better timing.
How to use:
Divergences born inside the zone are significantly stronger.
Standard and Lite preserve full functionality with simplified visuals.
Versions:
(Full, Standard — limited visuals, Lite — limited visuals)
________________________________________
13 — Divergence Probation Start
What it is:
Beginning of the window where divergence must prove itself.
Why it matters:
If no structural reaction appears, the signal weakens.
How to use:
Watch traps, micro-divs, and impulse slowdown during this interval.
Versions:
(Full, Standard — limited, Lite — not included)
________________________________________
14 — Divergence Probation End
What it is:
The final point where divergence should manifest.
Why it matters:
If no reaction occurs, the market transitions into Flow and the divergence becomes irrelevant.
How to use:
If price does not react by this point — ignore the divergence.
Versions:
(Full, Standard — limited, Lite — not included)
________________________________________
15 — Catcher HUD (Forecast Accuracy Panel)
What it is:
A panel showing how many divergences the Catcher predicted and how many were confirmed by the market.
Why it matters:
Helps tune the indicator without guesswork.
How to use:
Adjust parameters and observe how HUD accuracy changes instantly.
Optimizes Pythia for each instrument and timeframe.
Versions:
(Full, Standard, Lite)
________________________________________
Note from the Developers
Pythia marks the exact areas where the market can mislead you.
So here is a simple and practical rule:
Do not step into the places where the markers stand.)

Pythia — 33 STANDARTPythia — v33 (Standard Edition)
Structural Movement Analysis, Divergences, Flow, and Traps
Overview
Pythia Standard is built on the same structural core as the Full Edition and focuses on practical trading tasks: timely detection of divergences, slowdown zones, traps, and local flow transitions.
It highlights areas where impulse loses strength, where price disagrees with internal energy, and where movement enters higher-risk structural states.
The Standard Edition removes specialized modules (news impulses, extended channel geometry, advanced visuals) while preserving all essential structural and energy logic.
Configuration
Only several base parameters are required in real use (MACD lengths, pivot sensitivity, structural thresholds).
Internal coefficients for TTC, Flow, and energy filters are pre-optimized, reducing the number of visible inputs.
Alerts for the key signal groups are available directly in the settings.
What Pythia Standard Displays
• structural conditions where movement changes behaviour
• micro- and macro-divergences
• zones where impulse slows down or becomes unstable
• movement traps:
– EnergyTrap — strong energy, weak price result
– PriceTrap — strong price move, weak internal energy
• TTC time- and price-based zones where movement contracts or shifts
• full Flow-mode, showing local energy-flow transitions
• inner-channel directional context
• rare OR-impulse spikes (high-intensity bursts)
Together these elements form a compact structural map of the market — without the heavier Full-Edition modules.
Key Modules
1. TTC Zones (Time-To-Collapse)
Highlight areas where momentum historically weakens.
Reflect how far a structure can extend in time and price before losing stability.
2. Micro and Macro Divergences
Micro — local short-cycle structural breaks.
Macro — larger movements with stronger implications.
Both scales are available, with sensitivity controlled by MACD and T3 filters.
3. Flow Mode
Tracks local changes in the energy-flow context.
Identifies transitions between:
• probation flow
• confirmed flow
• false flow
A useful tool for assessing whether the current movement is stable or weakening.
4. Movement Traps (EnergyTrap / PriceTrap)
EnergyTrap — strong internal energy, weak price response.
PriceTrap — strong price expansion with weak energy.
Both conditions mark vulnerable structural states where movement often breaks or changes behaviour.
5. OR-Impulses
Identify rare high-impulse events combining price expansion, an internal energy surge, and post-event instability.
Useful for recognising structurally important segments.
6. TTC Grids & Alerts
Pythia Standard includes TTC grids (with adjustable transparency) and alerts for:
• micro/macro divergences
• Flow states
• movement traps
• TTC structural conditions
News-impulse alerts and extended channel geometry remain exclusive to the Full Edition.
Release Notes
Pythia — v33 (Standard Edition) uses the same structural-energy engine as the Full Edition while excluding news impulses and extended geometry modules.
Optimized for everyday trading: divergences, Flow, traps, TTC zones, and core alerts — with fewer inputs and a cleaner interface.
Interpretation of Chart Markers (1–15)
(with version availability: Full / Standard / Lite)
________________________________________
1 — Pre-Flow Divergence
What it is:
A divergence displayed in a pale version of the trend color, showing early price-energy discrepancy while price moves in a strong impulse.
Why it matters:
Signals that a regular divergence may be ignored because the market still has enough momentum to continue without correction.
How to use:
Not a reversal entry.
Wait for impulse weakening or confirmation from traps, micro-divergences, TTC, or the Catcher zone.
Versions:
(Full, Standard — limited, Lite — not included)
________________________________________
2 — Regular Bearish Divergence
What it is:
A classic discrepancy between price and momentum.
Why it matters:
Shows weakening of the current swing and increases the probability of correction or reversal.
How to use:
Useful for exits or timing counter-trend entries.
Best when combined with traps, TTC, or the Catcher zone.
Versions:
(Full, Standard, Lite)
________________________________________
3 — Divergence Energy Indicator
What it is:
A marker showing how strong the divergence energy load is.
Why it matters:
Helps separate weak divergences from structurally significant ones.
How to use:
High-energy divergences carry greater reversal potential.
Versions:
(Full, Standard — no, Lite — no)
________________________________________
4 — Trap Cloud: Mass Without Impulse
What it is:
A cloud indicating significant trade mass with minimal price progress.
Why it matters:
Shows hidden exhaustion or buildup before a directional change.
How to use:
When combined with divergences or the Catcher zone, attention increases.
Lite uses micro-markers instead of clouds.
Versions:
(Full, Standard, Lite — limited)
________________________________________
5 — Trap Cloud: Impulse Without Mass
What it is:
Shows small clusters of relatively large trades producing impulse without depth.
Why it matters:
Often indicates unstable or misleading moves.
How to use:
Strengthens reversal probability when combined with divergences.
Versions:
(Full, Standard, Lite — limited)
________________________________________
6 — Post-Impulse Oscillation Window
What it is:
The time window after an impulse-shift marker (7).
Why it matters:
Shows whether the new impulse strengthened or faded.
How to use:
Supports reading the stability of short-term structural breaks.
Versions:
(Full, Standard — no, Lite — no)
________________________________________
7 — Instant Impulse-Shift Marker
What it is:
A marker showing a sudden change in structural impulse.
Why it matters:
These points often precede short-term acceleration or instability.
How to use:
Especially meaningful when appearing near traps or divergences.
Versions:
(Full, Standard — no, Lite — no)
________________________________________
8 — Growing Price–Energy Discrepancy
What it is:
Marks increasing separation between price progress and energy behavior.
Why it matters:
Often precedes divergence formation or weakening of movement.
How to use:
Use as an early attention signal, especially when clusters appear.
Versions:
(Full, Standard — no, Lite — no)
________________________________________
9 — Collapsed Micro-Divergences
What it is:
Micro-divergences that formed but collapsed.
Why it matters:
Clusters of such points often reflect hidden weakness.
How to use:
Multiple collapsed micro-divs frequently precede structural slowing.
Versions:
(Full, Standard, Lite)
________________________________________
10 — Low-Energy Uncertainty Cloud
What it is:
A weak instability cloud similar to marker 7 but less pronounced.
Why it matters:
Marks zones where the market struggles with direction.
How to use:
Strengthens reversal context when inside a Catcher zone.
Versions:
(Full, Standard — no, Lite — no)
________________________________________
11 — Catcher Zone Marker
What it is:
Marks the moment a Catcher zone was created.
Why it matters:
Even if the zone collapses, the marker remains as evidence of structural preparation.
How to use:
If traps or divergences appear afterward, reversal probability increases.
Versions:
(Full, Standard, Lite)
________________________________________
12 — Catcher Zone (Forecast Window for Divergence)
What it is:
A dynamic zone predicting where a divergence is most likely to appear.
Why it matters:
Helps anticipate reversal signals earlier and with better timing.
How to use:
Divergences born inside the zone are significantly stronger.
Standard and Lite preserve full functionality with simplified visuals.
Versions:
(Full, Standard — limited visuals, Lite — limited visuals)
________________________________________
13 — Divergence Probation Start
What it is:
Beginning of the window where divergence must prove itself.
Why it matters:
If no structural reaction appears, the signal weakens.
How to use:
Watch traps, micro-divs, and impulse slowdown during this interval.
Versions:
(Full, Standard — limited, Lite — not included)
________________________________________
14 — Divergence Probation End
What it is:
The final point where divergence should manifest.
Why it matters:
If no reaction occurs, the market transitions into Flow and the divergence becomes irrelevant.
How to use:
If price does not react by this point — ignore the divergence.
Versions:
(Full, Standard — limited, Lite — not included)
________________________________________
15 — Catcher HUD (Forecast Accuracy Panel)
What it is:
A panel showing how many divergences the Catcher predicted and how many were confirmed by the market.
Why it matters:
Helps tune the indicator without guesswork.
How to use:
Adjust parameters and observe how HUD accuracy changes instantly.
Optimizes Pythia for each instrument and timeframe.
Versions:
(Full, Standard, Lite)
________________________________________
Note from the Developers
Pythia marks the exact areas where the market can mislead you.
So here is a simple and practical rule:
Do not step into the places where the markers stand.)

SK Trading System v1.6 SK Trading System v0.16 – Rule-Based Market Strategy for Precise Entries & Exits
The SK Trading System v0.16 is a comprehensive, rule-based approach to trading designed to identify market turning points using price action and Fibonacci levels. Built on over 6 years of trading experience and thousands of hours of market analysis, this system combines the power of Fibonacci retracements and extensions with structured price sequences to provide a high-probability framework for identifying trend reversals and market entries.
Key Features:
Price Action-Based: The system leverages market structure, including price highs and lows, to identify significant turning points in the market.
Fibonacci Levels: Key retracement and extension levels (0.382, 0.5, 0.618, 1.618, 2.000) are used to identify optimal entry and exit points for trades.
Clear Sequences: The strategy identifies sequences of price movements (Points 0, A, B, and C) that follow a well-defined pattern of market behavior.
Risk & Money Management: The system enforces strict risk management principles, capping loss exposure to 1-3% per trade and targeting a minimum 1:1 risk/reward ratio.
Automated Trade Setup: Automatic detection of key price levels, including the Golden Pocket zone, targets, and invalidation points.
Visual Trade Markers: Easy-to-read visual indicators, including Fibonacci zones, points of interest, and target levels, to support your trading decisions.
Why Use It:
Disciplined Approach: Follow a strict, rule-driven methodology to eliminate emotional trading and boost consistency.
Multi-Timeframe Analysis: Ideal for traders who analyze multiple timeframes, from higher timeframes for trend direction to lower timeframes for precise entry points.
Comprehensive Risk Management: The system includes built-in stop loss and take profit management to protect your capital and lock in profits.
Continuous Adaptation: The strategy can adapt to changing market conditions, ensuring you stay on the right side of the market.
Who Can Benefit:
Swing Traders: Ideal for traders looking to capture medium- to long-term price movements with high-probability setups.
Trend Followers: Perfect for those who want to trade with the prevailing trend while managing risk.
Fibonacci Enthusiasts: This strategy leverages Fibonacci retracements and extensions to find high-confluence entry and exit zones.
Maximize your trading efficiency and reduce the noise of unpredictable market moves with the SK Trading System v16. Let the system guide your trading decisions with clear, actionable signals and reliable market patterns.

IU Momentum OscillatorDESCRIPTION:
The IU Momentum Oscillator is a specialized trend-following tool designed to visualize the raw "energy" of price action. Unlike traditional oscillators that rely solely on closing prices relative to a range (like RSI), this indicator calculates momentum based on the ratio of bullish candles over a specific lookback period.
This "Neon Edition" has been engineered with a focus on visual clarity and aesthetic depth. It utilizes "Shadow Plotting" to create a glowing effect and dynamic "Trend Clouds" to highlight the strength of the move. The result is a clean, modern interface that allows traders to instantly gauge market sentiment—whether the bulls or bears are in control—without cluttering the chart with complex lines.
USER INPUTS:
- Momentum Length (Default: 20): The number of past candles analyzed to count bullish occurrences.
- Momentum Smoothing (Default: 20): An SMA filter applied to the raw data to reduce noise and provide a cleaner wave.
- Signal Line Length (Default: 5): The length of the EMA signal line used to generate crossover signals and the "Trend Cloud."
- Overbought / Oversold Levels (Default: 60 / 40): Thresholds that define extreme market conditions.
- Colors: Fully customizable Neon Cyan (Bullish) and Neon Magenta (Bearish) inputs to match your chart theme.
LONG CONDITION:
- Signal: A Buy signal is indicated by a small Cyan Circle.
- Logic: Occurs when the Main Momentum Line (Glowing) crosses ABOVE the Grey Signal Line.
- Visual Confirmation: The "Trend Cloud" turns Cyan and expands, indicating that bullish momentum is accelerating relative to the recent average.
SHORT CONDITIONS:
- Signal: A Sell signal is indicated by a small Magenta Circle.
- Logic: Occurs when the Main Momentum Line (Glowing) crosses BELOW the Grey Signal Line.
- Visual Confirmation: The "Trend Cloud" turns Magenta, indicating that bearish pressure is increasing.
WHY IT IS UNIQUE:
1. Candle-Count Logic: Most oscillators calculate price distance. This indicator calculates price participation (how many candles were actually green vs red). This offers a different perspective on trend sustainability.
2. Optimized Performance: The script uses math.sum functions rather than heavy for loops, ensuring it loads instantly and runs smoothly on all timeframes.
3. Visual Hierarchy: It uses dynamic gradients and transparency (Alpha channels) to create a "Glow" and "Cloud" effect. This makes the chart easier to read at a glance compared to flat, single-line oscillators.
HOW USER CAN BENEFIT FROM IT:
- Trend Confirmation: Traders can use the "Trend Cloud" to stay in trades longer. As long as the cloud is thick and colored, the trend is strong.
- Divergence Spotting: Because this calculates momentum differently than RSI, it can often show divergences (price goes up, but the count of bullish candles goes down) earlier than standard tools.
- Scalping: The crisp crossover signals (Circles) provide excellent entry triggers for scalpers on lower timeframes when combined with key support/resistance levels.
DISCLAIMER:
This source code and the information presented here are for educational and informational purposes only. It does not constitute financial, investment, or trading advice.
Trading in financial markets involves a high degree of risk and may not be suitable for all investors. You should not rely solely on this indicator to make trading decisions. Always perform your own due diligence, manage your risk appropriately, and consult with a qualified financial advisor before executing any trades.

Net Futures OI Change + Price/OI Logic – All Bars-This indicator shows Net Change in Open Interest of Futures contract , with Open interest built-up with relation to price, specifically made for Indian Markets. Works on Index futures & Stock Futures (even on chart of underlying *if also traded in F&O segment*).
-This indicator only shows Net Futures open interest, as Tradingview only provides Open Interest for Futures contracts (in pinescript) and updates every 3 Minutes (according to the rule of National Stock Exchange)
-Also works on timeframes: 3 Minutes to 1 Month (only on Indian Scrips)
*Can use on other scrips excluding Indian Markets, but it will work only on Daily Timeframe*
Tip: Turn on/off ‘Pane Labels’ under graphic objects from indicator settings to view price relation with Open Interest (small text will appear on histogram bar)
How to Use:
Rise in Price, Rise in OI = Long Built Up
Rise in Price, Slide in OI = Short Covering
Slide in Price, Slide in OI = Short Built Up
Slide in Price, Slide in OI = Long Unwinding
Disclaimer/Warning: This indicator does not provide Buy/Sell signals or nor is an investment advice. This indicator solely for the purpose of study of price and open interest. Users are responsible for their own actions, profit/loss of the users is not the liability of author.
