GKD-C Double Smoothed Stochastic of Momentum [Loxx]Giga Kaleidoscope Double Smoothed Stochastic of Momentum Confirmation is a Confirmation module included in Loxx's "Giga Kaleidoscope Modularized Trading System".
What is Loxx's "Giga Kaleidoscope Modularized Trading System"?
The Giga Kaleidoscope Modularized Trading System is a trading system built on the philosophy of the NNFX (No Nonsense Forex) algorithmic trading.
What is an NNFX algorithmic trading strategy?
The NNFX algorithm is built on the principles of trend, momentum, and volatility. There are six core components in the NNFX trading algorithm:
1. Volatility - price volatility; e.g., Average True Range, True Range Double, Close-to-Close, etc.
2. Baseline - a moving average to identify price trend (such as "Baseline" shown on the chart above)
3. Confirmation 1 - a technical indicator used to identify trends. This should agree with the "Baseline"
4. Confirmation 2 - a technical indicator used to identify trends. This filters/verifies the trend identified by "Baseline" and "Confirmation 1"
5. Volatility/Volume - a technical indicator used to identify volatility/volume breakouts/breakdown.
6. Exit - a technical indicator used to determine when a trend is exhausted.
How does Loxx's GKD (Giga Kaleidoscope Modularized Trading System) implement the NNFX algorithm outlined above?
Loxx's GKD v1.0 system has five types of modules (indicators/strategies). These modules are:
1. GKD-BT - Backtesting module (Volatility, Number 1 in the NNFX algorithm)
2. GKD-B - Baseline module (Baseline and Volatility/Volume, Numbers 1 and 2 in the NNFX algorithm)
3. GKD-C - Confirmation 1/2 module (Confirmation 1/2, Numbers 3 and 4 in the NNFX algorithm)
4. GKD-V - Volatility/Volume module (Confirmation 1/2, Number 5 in the NNFX algorithm)
5. GKD-E - Exit module (Exit, Number 6 in the NNFX algorithm)
(additional module types will added in future releases)
Each module interacts with every module by passing data between modules. Data is passed between each module as described below:
GKD-B => GKD-V => GKD-C(1) => GKD-C(2) => GKD-E => GKD-BT
That is, the Baseline indicator passes its data to Volatility/Volume. The Volatility/Volume indicator passes its values to the Confirmation 1 indicator. The Confirmation 1 indicator passes its values to the Confirmation 2 indicator. The Confirmation 2 indicator passes its values to the Exit indicator, and finally, the Exit indicator passes its values to the Backtest strategy.
This chaining of indicators requires that each module conform to Loxx's GKD protocol, therefore allowing for the testing of every possible combination of technical indicators that make up the six components of the NNFX algorithm.
What does the application of the GKD trading system look like?
Example trading system:
Backtest: Strategy with 1-3 take profits, trailing stop loss, multiple types of PnL volatility, and 2 backtesting styles
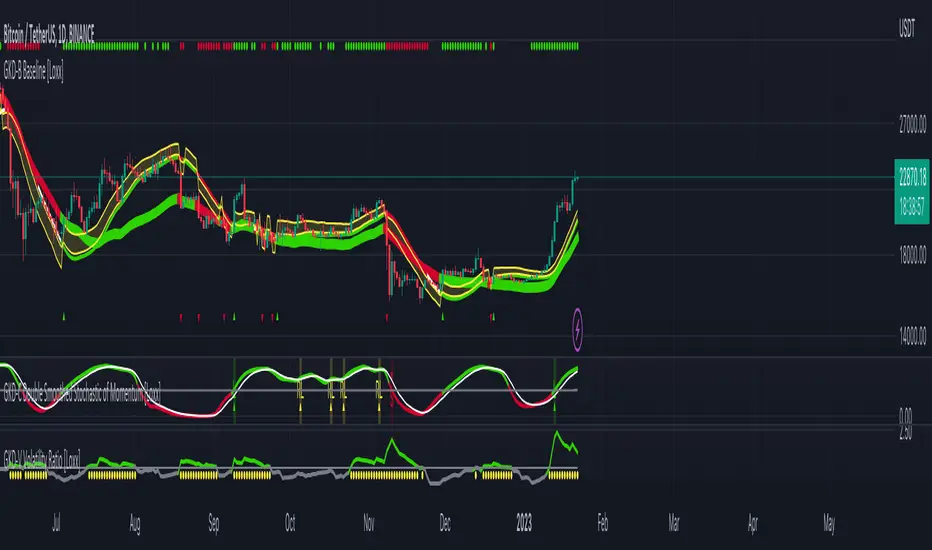
Baseline: Leader Exponential Moving Average as shown on chart
Volatility/Volume: Volatility Ratio as shown on chart
Confirmation 1: Double Smoothed Stochastic of Momentum as shown on the chart above
Confirmation 2: Jurik Turning Point Oscillator
Exit: Rex Oscillator
Each GKD indicator is denoted with a module identifier of either: GKD-BT, GKD-B, GKD-C, GKD-V, or GKD-E. This allows traders to understand to which module each indicator belongs and where each indicator fits into the GKD protocol chain.
Now that you have a general understanding of the NNFX algorithm and the GKD trading system. Let's go over what's inside the GKD-E Double Smoothed Stochastic of Momentum itself.
What is Double Smoothed Stochastic of Momentum?
The Double Smoothed Stochastic of Momentum demonstrates smoother indicators and therefore gives fewer false signals in comparison with the traditional oscillator.
The indicator is written in accordance with the description given in the book by Joe Dinapoli "Trading With DiNapoli Levels". This oscillator smoothing method leads to a filtering of the most "noise" component of the price movement.
The Double Smoothed Stochastic of Momentum indicator can be used in the strategies oriented to a standard stochastic. However, the stronger smoothing can lead to the loss of an array of signals. It is recommended to apply any trend indicator for more efficient use of the indicator and its signals filtering.
Signals
A GKD-C Confirmation indicator can be used as either a Confirmation 1, Confirmation 2, or Solo Confirmation indicator. See step 3 & 4 of the NNFX algorithm above to understand how this indicator fits into the GKD trading system. The Solo Confirmation setting allows you to test this indicator by itself without an additional GKD-C indicator present in the GKD protocol chain.
On the chart shown above, this indicator is shown as GKD-C Double Smoothed Stochastic of Momentum and is set to Solo Confirmation. The GKD-B Baseline, GKD-V Volatility Ratio, and this indicator satisfy the first three steps in the GKD trading system chain: GKD-B => GKD-V => GKD-C(solo).
The signals from each of these settings are as follows:
Confirmation 1 Signal
Initial Long (L): Double Smoothed Stochastic of Momentum crosses-up over middle-line*
Initial Short (S): Double Smoothed Stochastic of Momentum crosses-down under middle-line*
Continuation Long (CL): Double Smoothed Stochastic of Momentum is over middle-line, then crosses-up over the signal**
Continuation Short (CS): Double Smoothed Stochastic of Momentum is under middle-line, then crosses-down under the signal**
Post Baseline Cross Long (BL): Double Smoothed Stochastic of Momentum crossed-up over middle-line but Baseline is still in downtrend, then Baseline turns to uptrend within XX bars***
Post Baseline Cross Short (BS): Double Smoothed Stochastic of Momentum crossed-down under middle-line but Baseline is still in uptrend, then Baseline turns to downtrend within XX bars***
BL Recovery Continuation Long (RL): Double Smoothed Stochastic of Momentum is above middle-line. Baseline already crossed down into downtrend, then baseline crosses back up to uptrend; then, Double Smoothed Stochastic of Momentum crosses-up over the signal****
BL Recovery Continuation Short (RS): Double Smoothed Stochastic of Momentum is below middle-line. Baseline already crossed up into uptrend, then baseline crosses back down to downtrend; then, Double Smoothed Stochastic of Momentum crosses-down under the signal****
*All signals are shown regardless of Baseline and Volatility/Volume qualification
**All signals are shown regardless of Baseline qualification; however, when Baseline filter is active, only true continuations are shown. When the Baseline filter is not active, then all continuations are shown. True continuations are when the Baseline is active and maintains its uptrend/downtrend after the initial cross-up/cross-down over the middle-line respectively. This means that if the Baseline trend then moves against the Double Smoothed Stochastic of Momentum then any continuation signals are voided until another initial Long/Short. All continuations are will either show as regular continuations or be converted into recovery continuations
***All signals are shown regardless of Volatility/Volume qualification
****When the Baseline filter is active, some regular continuations are converted to recovery continuations and are shown. When the Baseline filter is not active, then these signals are not shown.
Confirmation 2 Signal
Initial Long (L): Double Smoothed Stochastic of Momentum crosses-up over middle-line*
Initial Short (S): Double Smoothed Stochastic of Momentum crosses-down under middle-line*
Continuation Long (CL): Double Smoothed Stochastic of Momentum is over middle-line, then crosses-up over the signal**
Continuation Short (CS): Double Smoothed Stochastic of Momentum is under middle-line, then crosses-down under the signal**
Post Baseline Cross Long (BL): Double Smoothed Stochastic of Momentum crossed-up over middle-line but Baseline is still in downtrend, then Baseline turns to uptrend within XX bars***
Post Baseline Cross Short (BS): Double Smoothed Stochastic of Momentum crossed-down under middle-line but Baseline is still in uptrend, then Baseline turns to downtrend within XX bars***
BL Recovery Continuation Long (RL): Double Smoothed Stochastic of Momentum is above middle-line. Baseline already crossed down into downtrend, then baseline crosses back up to uptrend while Double Smoothed Stochastic of Momentum is still above middle-line; then, Double Smoothed Stochastic of Momentum crosses-up over the signal****
BL Recovery Continuation Short (RS): Double Smoothed Stochastic of Momentum is below middle-line. Baseline already crossed up into uptrend, then baseline crosses back down to downtrend while Double Smoothed Stochastic of Momentum is still below middle-line; then, Double Smoothed Stochastic of Momentum crosses-down under the signal****
*All signals are shown regardless of Baseline and Volatility/Volume qualification
**All signals are shown regardless of Baseline qualification; however, when Baseline filter is active, only true continuations are shown. When the Baseline filter is not active, then all continuations are shown. True continuations are when the Baseline is active and maintains its uptrend/downtrend after the initial cross-up/cross-down over the middle-line respectively. This means that if the Baseline trend then moves against the Double Smoothed Stochastic of Momentum then any continuation signals are voided until another initial Long/Short. All continuations are will either show as regular continuations or be converted into recovery continuations
***All signals are shown regardless of Volatility/Volume qualification
****When the Baseline filter is active, some regular continuations are converted to recovery continuations and are shown. When the Baseline filter is not active, then these signals are not shown.
Confirmation 2 Confluence Background Color Signals; Confirmation Order: Regular; Confirmation Type: Confirmation 1
Initial Long (L): The imported GKD-C Confirmation 1 indicator crosses-up over middle-line, then Double Smoothed Stochastic of Momentum crosses-up over the middle-line on the same bar or "Number of Bars Confirmation" bars in the future (see X-bar rule below)
Initial Short (S): The imported GKD-C Confirmation 1 indicator crosses-down under middle-line, then Double Smoothed Stochastic of Momentum crosses-down under the middle-line on the same bar or "Number of Bars Confirmation" bars in the future (see X-bar rule below)
Continuation Long Confirmation 1 (CL): The imported GKD-C Confirmation 1 indicator is over middle-line, then crosses-up over the signal
Continuation Short Confirmation 1 (CS): The imported GKD-C Confirmation 1 indicator is under middle-line, then crosses-down under the signal
Post Baseline Cross Long (BL): The imported GKD-C Confirmation 1 crossed-up over middle-line but Baseline is still in downtrend; and Double Smoothed Stochastic of Momentum crossed-up over middle-line on the same bar or XX bars in the future but Baseline is still in downtrend; then Baseline turns to uptrend within "Maximum Allowable PSBC Bars Back" bars (see X-bar rule below)
Post Baseline Cross Short (BS): The imported GKD-C Confirmation 1 crossed-down under middle-line but Baseline is still in uptrend; and, Double Smoothed Stochastic of Momentum crossed-down under middle-line on the same bar or XX bars in the future but Baseline is still in uptrend; then Baseline turns to downtrend within "Maximum Allowable PSBC Bars Back" bars (see X-bar rule below)
BL Recovery Continuation Long (RL): The imported GKD-C Confirmation 1 indicator is above middle-line. Baseline already crossed down into downtrend, then baseline crosses back up to uptrend while Double Smoothed Stochastic of Momentum is still above middle-line; then, The imported GKD-C Confirmation 1 crosses-up over the signal
BL Recovery Continuation Short (RS): The imported GKD-C Confirmation 1 indicator is below middle-line. Baseline already crossed up into uptrend, then baseline crosses back down to downtrend while Double Smoothed Stochastic of Momentum is still below middle-line; then, The imported GKD-C Confirmation 1 crosses-down under the signal
Confirmation 2 Confluence Background Color Signals; Confirmation Order: Regular; Confirmation Type: Confirmation 2
Initial Long (L): same as Confirmation 2 Confluence Background Color Signals; Confirmation Order: Regular; Confirmation Type: Confirmation 1
Initial Short (S): same as Confirmation 2 Confluence Background Color Signals; Confirmation Order: Regular; Confirmation Type: Confirmation 1
Continuation Long Confirmation 2 (CL): Double Smoothed Stochastic of Momentum is over middle-line, then crosses-up over the signal
Continuation Short Confirmation 2 (CS): Double Smoothed Stochastic of Momentum is under middle-line, then crosses-down under the signal
Post Baseline Cross Long (BL): same as Confirmation 2 Confluence Background Color Signals; Confirmation Order: Regular; Confirmation Type: Confirmation 1
Post Baseline Cross Short (BS): same as Confirmation 2 Confluence Background Color Signals; Confirmation Order: Regular; Confirmation Type: Confirmation 1
BL Recovery Continuation Long (RL): Double Smoothed Stochastic of Momentum is above middle-line. Baseline already crossed down into downtrend, then baseline crosses back up to uptrend; then, Double Smoothed Stochastic of Momentum crosses-up over the signal
BL Recovery Continuation Short (RS): Double Smoothed Stochastic of Momentum is below middle-line. Baseline already crossed up into uptrend, then baseline crosses back down to downtrend; then, Double Smoothed Stochastic of Momentum crosses-down under the signal
Confirmation 2 Confluence Background Color Signals; Confirmation Order: Regular; Confirmation Type: Both
Initial Long (L): same as Confirmation 2 Confluence Background Color Signals; Confirmation Order: Regular; Confirmation Type: Confirmation 1
Initial Short (S): same as Confirmation 2 Confluence Background Color Signals; Confirmation Order: Regular; Confirmation Type: Confirmation 1
Continuation Long Confirmation 2 (CL): The imported GKD-C Confirmation 1 indicator is over middle-line, then crosses-up over the signal; Double Smoothed Stochastic of Momentum is over middle-line, then crosses-up over the signal within "Number of Bars Confirmation" bars in the future
Continuation Short Confirmation 2 (CS): The imported GKD-C Confirmation 1 indicator is under middle-line, then crosses-down under the signal; Double Smoothed Stochastic of Momentum is under middle-line, then crosses-down under the signal within "Number of Bars Confirmation" bars in the future
Post Baseline Cross Long (BL): same as Confirmation 2 Confluence Background Color Signals; Confirmation Order: Regular; Confirmation Type: Confirmation 1
Post Baseline Cross Short (BS): same as Confirmation 2 Confluence Background Color Signals; Confirmation Order: Regular; Confirmation Type: Confirmation 1
BL Recovery Continuation Long (RL): The imported GKD-C Confirmation 1 indicator is above middle-line and Double Smoothed Stochastic of Momentum is above middle-line. Baseline already crossed down into downtrend, then baseline crosses back up to uptrend; then, the imported GKD-C Confirmation 1 crosses-up over its signal, and Double Smoothed Stochastic of Momentum crosses-up over its signal within "Number of Bars Confirmation" bars in the future
BL Recovery Continuation Short (RS): The imported GKD-C Confirmation 1 indicator is below middle-line and Double Smoothed Stochastic of Momentum is below middle-line. Baseline already crossed up into uptrend, then baseline crosses back down to downtrend; then, the imported GKD-C Confirmation 1 crosses-down under its signal, and Double Smoothed Stochastic of Momentum crosses-down under its signal within "Number of Bars Confirmation" bars in the future
Confirmation 2 Confluence Background Color Signals; Confirmation Order: Both; Confirmation Type: (continuations don't change from the variations above)
Initial Long (L): The imported GKD-C Confirmation 1 indicator crosses-up over middle-line, then Double Smoothed Stochastic of Momentum crosses-up over the middle-line on the same bar or "Number of Bars Confirmation" bars in the future (see X-bar rule below); OR, Double Smoothed Stochastic of Momentum crosses-up over middle-line, then the imported GKD-C Confirmation 1 indicator crosses-up over the middle-line on the same bar or "Number of Bars Confirmation" bars in the future (see X-bar rule below)
Initial Short (S): The imported GKD-C Confirmation 1 indicator crosses-down under middle-line, then Double Smoothed Stochastic of Momentum crosses-down under the middle-line on the same bar or "Number of Bars Confirmation" bars in the future (see X-bar rule below); OR, Double Smoothed Stochastic of Momentum crosses-down under middle-line, then the imported GKD-C Confirmation 1 indicator crosses-down under the middle-line on the same bar or "Number of Bars Confirmation" bars in the future (see X-bar rule below)
Post Baseline Cross Long (BL): The imported GKD-C Confirmation 1 crossed-down under middle-line but Baseline is still in uptrend; and, Double Smoothed Stochastic of Momentum crossed-down under middle-line on the same bar or XX bars in the future but Baseline is still in uptrend; then Baseline turns to downtrend within "Maximum Allowable PSBC Bars Back" bars (see X-bar rule below); OR, Double Smoothed Stochastic of Momentum crossed-down under middle-line but Baseline is still in uptrend; and, the imported GKD-C Confirmation 1 crossed-down under middle-line on the same bar or XX bars in the future but Baseline is still in uptrend; then Baseline turns to downtrend within "Maximum Allowable PSBC Bars Back" bars (see X-bar rule below)
Post Baseline Cross Short (BS): The imported GKD-C Confirmation 1 crossed-down under middle-line but Baseline is still in uptrend; and, Double Smoothed Stochastic of Momentum crossed-down under middle-line on the same bar or XX bars in the future but Baseline is still in uptrend; then Baseline turns to downtrend within "Maximum Allowable PSBC Bars Back" bars (see X-bar rule below); OR, Double Smoothed Stochastic of Momentum crossed-down under middle-line but Baseline is still in uptrend; and, the imported GKD-C Confirmation 1 crossed-down under middle-line on the same bar or XX bars in the future but Baseline is still in uptrend; then Baseline turns to downtrend within "Maximum Allowable PSBC Bars Back" bars (see X-bar rule below)
Solo Confirmation Signals
Initial Long (L): Double Smoothed Stochastic of Momentum crosses-up over middle-line
Initial Short (S): Double Smoothed Stochastic of Momentum crosses-down under middle-line
Continuation Long (CL): Double Smoothed Stochastic of Momentum is over middle-line, then crosses-up over the signal
Continuation Short (CS): Double Smoothed Stochastic of Momentum is under middle-line, then crosses-down under the signal
Post Baseline Cross Long (BL): Double Smoothed Stochastic of Momentum crossed-up over middle-line but Baseline is still in downtrend, then Baseline turns to uptrend within XX bars
Post Baseline Cross Short (BS): Double Smoothed Stochastic of Momentum crossed-down under middle-line but Baseline is still in uptrend, then Baseline turns to downtrend within XX bars
BL Recovery Continuation Long (RL): Double Smoothed Stochastic of Momentum above middle-line. Baseline already crossed down into downtrend, then baseline crosses back up to uptrend while Double Smoothed Stochastic of Momentum is still above middle-line
BL Recovery Continuation Short (RS): Double Smoothed Stochastic of Momentum below middle-line. Baseline already crossed up into uptrend, then baseline crosses back down to downtrend while Double Smoothed Stochastic of Momentum is still below middle-line
X-bar Rule settings
This rule only applies when this indicator "Confirmation Type" set to "Confirmation 2"
Requirements
Inputs: Confirmation 1 and Solo Confirmation: GKD-V Volatility/Volume indicator; Confirmation 2: GKD-C Confirmation indicator
Output: Confirmation 2 and Solo Confirmation: GKD-E Exit indicator; Confirmation 1: GKD-C Confirmation indicator
Additional features will be added in future releases.
This indicator is only available to ALGX Trading VIP group members . You can see the Author's Instructions below to get more information on how to get access.
Indicatore Momentum (MOM)
Multi SMI Ergodic OscillatorThe Multi SMI Ergodic Oscillator (Multi SMIEO) indicator can be used to identify potential buy and sell signals based on the relationship between the TSI and EMA lines.
The script is creating an indicator that plots multiple (3) sets of Time Series Indicator (TSI-Indicator) and Exponential Moving Average (EMA-Signal) lines as a single indicator.
The TSI is a momentum oscillator that helps identify overbought and oversold conditions. It is calculated using the close prices of an asset, a short-term moving average, and a long-term moving average. The script uses three different pairs of input values for the short-term and long-term periods, which can be adjusted by the user.
The EMA is a type of moving average that gives more weight to recent prices. It is calculated by applying a weighting factor to the most recent price, and then adding that weighted value to the previous EMA value. The script uses three different input values for the length of the EMA, which can also be adjusted by the user.
After calculating the TSI and EMA for each set, the script plots them on the same graph, with different colors and widths to differentiate them. The three sets of TSI and EMA lines are plotted to allow the user to compare the results of different periods. The script also plots a horizontal line at zero, which is used as a reference point for the oscillations of the indicator lines.
One way to use this indicator is to look for crossovers between the TSI and the EMA lines. A bullish crossover occurs when the TSI crosses above the EMA. This suggests that the buying pressure is increasing and a potential buy signal is generated. A bearish crossover occurs when the TSI crosses below the EMA. This suggests that the selling pressure is increasing and a potential sell signal is generated.
Some other ways that the indicator can be used include:
1. Identifying trends: The TSI and EMA lines can be used to identify the direction of the trend. An uptrend is present when the TSI and EMA lines are both trending upwards, while a downtrend is present when the TSI and EMA lines are both trending downwards.
2. Overbought and oversold conditions: The TSI can be used to identify overbought and oversold conditions. When the TSI is above the upper limit of the range, the asset is considered overbought and may be due for a price correction. Conversely, when the TSI is below the lower limit of the range, the asset is considered oversold and may be due for a price rebound.
3. Confirming price action: The Multi SMIEO indicator can be used to confirm price action. If a bullish divergence is present, it confirms a potential bullish reversal. If a bearish divergence is present, it confirms a potential bearish reversal.
4. Multiple time frame analysis: By using different periods for the TSI and EMA lines, the indicator can be used to analyze the asset on multiple time frames. It can be useful to compare the results of different periods to get a better understanding of the asset's price movements.
5. Risk management: This indicator can be used as an element of risk management strategy, it can help traders to identify overbought and oversold conditions to set stop loss or take profit levels.
The Multi SMI Ergodic Oscillator (Multi SMIEO) is a versatile indicator that can be used in a number of ways to analyze the price movements of an asset. It can be used to identify potential buy and sell signals, trends, overbought and oversold conditions, and to confirm price action. By using different periods for the TSI and EMA lines, the indicator can also be used to analyze the asset on multiple time frames. However, it is important to remember that indicators are based on historical data, and past performance does not guarantee future results.
It is important to use the indicator as part of a comprehensive trading strategy that includes risk management and other analysis techniques, such as fundamental and technical analysis. It is also important to keep in mind that indicators are not a standalone solution for trading, they should be used in conjunction with other market analysis and research techniques to generate better results.
Lastly, it is important to keep in mind that trading in financial markets comes with a certain level of risk and it is crucial to always have a proper risk management plan in place. Never invest more than you can afford to lose.

BullBarbies MoRoll v1.0If you like the TTM Squeeze histogram, this may be your favorite new indicator.
5 customizable timeframe MACD-based oscillators are programmed to give you a heads-up when momentum is rolling over and changing to a new direction by using lower timeframes as a "heads-up" of a potential change. Designed to be used on the 5 minute chart, but can be adapted for higher timeframes as well. Not recommended for charts under 5 minutes. Settings default to those recommended for a 5 in chart: 5, 4, 3, 2, & 1 min oscillators. If using on a higher timeframe, consider starting with the current timeframe and stepping each down from there. Lower timeframe oscillators will begin to roll first. Most multi-timeframe indicators keep watch for conditions on higher timeframes, this one is designed to give you a leg-up in seeing what's happening underneath the price action and squeezes by taking a peak at lower timeframes. Designed to be faster to help you make intra-day day trading decisions.
When all 5 indicators are in color agreement (all red or all green), this indicates strong directional momentum. To catch a shift in momentum, watch for colors to begin shifting red to green or green to red. When you can catch these shifts at support and resistance, it can make for a higher probability trade than trading just support and resistance. The more oscillators in agreement, the more confidence you can have that you are on the right side of the trade.
Pay attention to relative distance from the zero line as well. A trend day will have oscillators spending most of their time to one side or the other of the zero line. Oscillators change colors at the zero line for visual aid. Extremely high or low readings can indicate oversold or overbought conditions.
When the lines are a tangled mess of red and green, this indicates choppy conditions when many daytraders like to avoid.
Works well paired with the TTM squeeze for a more detailed look at your current timeframe.
This indicator has several features:
* 5 Timeframe oscillators that display as lines
* A zero line to show relative distance from the midpoint
* 4 color settings: rising above/below zero; falling above/below zero
I built this indicator because I love using the TTM Squeeze histogram on multiple timeframes to aid in predicting the loss and gain of momentum, but do not want to dedicate the monitor space to 5 charts just for the squeeze histogram. Plotting the histogram as lines allows the display of multiple timeframes. It has become standard on my intraday trading charts.

Stoch RSI 15 min - multi time frame tableABOUT THIS INDICATOR
This indicator calculates the Stochastic RSI for the time frames 15 min, 30 min, 1h, 4h, and 12h. However, the 15 min time frame should always be the default time frame for your chart.
IMPORTANT
* NOTE! It's extremely important that the chosen time frame for your chart is 15 min. Otherwise the Stochastic RSI for the longer time frames won’t be correctly calculated.
* Stochastic RSI will be calculated and displayed in a table for the time frames: 15 min, 30 min, 1h, 4h, 12h.
* All time frames are based on closed bars except the "15minR" that are realtime updated values calculated on a 15 min time frame.
ABOUT STOCHASTIC RSI
The Stochastic RSI (StochRSI) is a momentum indicator that ranges between 0 and 100. A Stochastic RSI value above 80 is considered overbought and below 20 is considered oversold.
By using different time frames you can get a better idea of what direction the trade could take in a "longer" perspective.
SETTINGS
1.) Length RSI = 14 (default period)
2.) Smoothing parameter of Stochastic RSI (Length Moving Average = 3) . Moving average of stochastic RSI
* By default the displayed Stochastic RSI values are smoothed values of the actual Stochastic RSI. The smoothnes is formed by a calculated moving average of with the length of 3 by default.
If you want Stochastic RSI with a sharper signal (higher risk for "false alarms" being more sensitive) change the Length Moving Average to = 1 (no smoothness at all)
You can see the selected "Length RSI" and "Length Moving Average" on top of the Stochastic RSI table.
Next version of this script will be updated with more a more flexible solution for different time frames.
* NOTE, Tradingview comes with a inbuilt Stochastic RSI. See the the chart below. The blue line in the Stochastic-RSI chart represents (K value = 3) the same value as the script calculate/display in the table.

1st Gray Cross Signals ━ Histogram SQZMOM [whvntr][LazyBear]This is the Histogram Version of one of my other indicators named: SQZ Momentum + 1st Gray Cross Signals (with arrows) Which is a modification of "Squeeze Momentum Indicator" by user: "LazyBear". In that indicator of his he described, and suggested, the use of his gray cross signals to find points of interest for trading based on the direction of momentum when the first gray cross appears... I have programmed these points, and highlighted them, for ease of use. The 1st gray cross strategy, he said , is from John F. Carter's book, Chapter 11, "Mastering the Trade".
Here we have the Histogram version, with background highlights only, and nothing on the chart, in true SQZ Momentum style.
Disclaimer: using this indicator, or any indicator anywhere, involves risk when trading and isn't a guarantee of 100% accurate results.

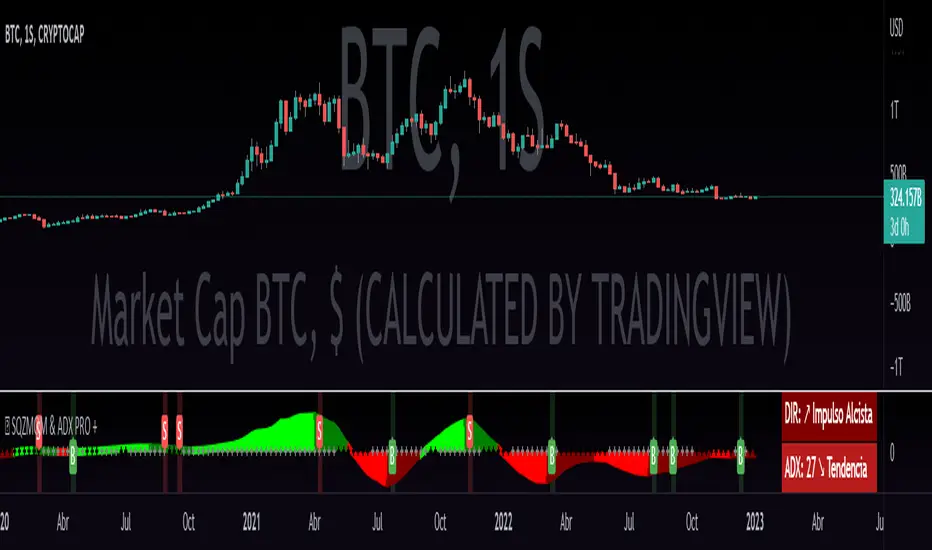
QZMOM & ADX PRO+The Momentum Squeeze Indicator is a momentum oscillator that indicates how explosively the price will move. Its first known version was called "TTM Squeeze" by John Carter explained in his book "Mastering the Trade" (chapter 11) and popularized in TradingView by a developer named LazyBear.
The black crosses on the center line show that the market has just entered a consolidation. This means low volatility, the market is preparing for an explosive move (up or down). The gray crosses mean the "Squeeze". Carter suggests waiting until the first gray after a black cross and taking a position in the direction of the oscillator. For its part, LazyBear recommends using an additional indicator such as ADX to improve the effectiveness of entry points and position closures.
Oscillator understanding improvements:
During the indicator creation process we were able to better understand the logic of the oscillator and based on that knowledge we implemented improvements.
Oscillator development improvements:
Side panel:
The ADX algorithm was incorporated, which is displayed numerically on the right panel of the indicator, shows the value of ADX and its directionality.
Added an arrow pointer to indicate oscillator directionality.
Two exponential moving averages of 11 and 55 periods have been added to the right panel, this will mark if the trend is bullish or bearish depending on the crossover of the EMAs.
An indicator of the Indicator Squeeze was also included, which marks the periods of price consolidation (OFF) and the periods in which the price should react explosively.
Added a feature that allows automatic color changing of the panels based on the color of the oscillator and the ADX.
o ADX: Dark green (bullish force).
o ADX: Light green (loss of bullish strength).
o ADX: Dark red (bearish force).
o ADX: Light red (loss of bearish strength).
o ADX: Orange (loss of strength, disinterest and low volume).
Signs:
A very famous strategy that we have learned is that of the trading expert Jaime Merino, who by combining the Momentum Squeeze Indicator and a ADX común, logró vincular eficientemente la debilidad del ADX con el inicio de un momentum alcista o bajista. La parametrización de su estrategia se señaló en alertas de compra y venta, que se representan de la siguiente manera:
B (Comprar): se activa cuando un movimiento bajista marcado por el ADX (pendiente negativa) termina y el oscilador toma direccionalidad alcista (impulso alcista).
S (Vender): se activa cuando un movimiento alcista marcado por el ADX (pendiente negativa) termina y el oscilador toma direccionalidad bajista (momentum bajista).
Filter:
To prevent any trader from trading against the trend, a filter was added that limits bearish entry alerts when the trend is up and vice versa, that is, when the EMA 10 is above the EMA 55, it is understood that the trend is up in that time frame, therefore bearish entry alerts will not be triggered. It will be the decision of each trader to activate or deactivate this function.
Alerts:
This is without a doubt the most awaited function for all Latin American traders, (Just kidding), but being aware, I am very proud of the implementation of alerts for each improvement made to this indicator, if you decide to use the Momentum Squeeze Indicator you can automate alerts for the following actions:
Buy and sell alerts.
Alerts to activate the Squeeze to (ON).
Oscillator quadrant change alerts
or bullish momentum.
or bearish momentum.
o Bullish force.
o Bearish force.
Recommendations:
One of the things that became clearer in the development of this indicator is the coloring of the dials, which is why we recommend the use of four colors, one for each oscillator grid.
[LazyBear] SQZ Momentum + 1st Gray Cross Signals ━ whvntrI have modified LazyBears Squeeze Momentum Indicator with enhancements, plus added signals
LazyBear mentioned that in John F. Carter's book, Chapter 11, "Mastering the Trade", that "Mr. Carter suggests waiting till the first gray after a black cross, and taking a position in the direction of the momentum (for ex., if momentum value is above zero, go long). Exit the position when the momentum changes (increase or decrease --- signified by a color change)." I have done just that. Now at each "first gray after a black cross", there are now Bearish and Bullish signals.. The signals only appear in the direction of the momentum.
Disclaimer: This indicator does not constitute investment advice. Trade at your own
risk with this method of identifying changes in stock market momentum.

DRM StrategyOne of the ways I go when I develop strategies is by reducing the number of parameters and removing fixed parameters and levels.
In this strategy, I'm trying to create an RSI indicator with a dynamic length.
Length is computed based on the correlation between Price and its momentum.
You can set min and max values for the RSI, and if the correlation is close to 1, we'll be at a min RSI value. When it's -1, we'll be at the max level.
I got this idea from Sofien Kaabar's book.
The strategy is super simple, and there might be much room for improvement.
Performance on the deep backtesting is not excellent, so I think the strategy needs some filters for regimes, etc.
Thanks to @MUQWISHI for helping me code it.
Disclaimer
Please remember that past performance may not indicate future results.
Due to various factors, including changing market conditions, the strategy may no longer perform as well as in historical backtesting.
This post and the script don’t provide any financial advice.

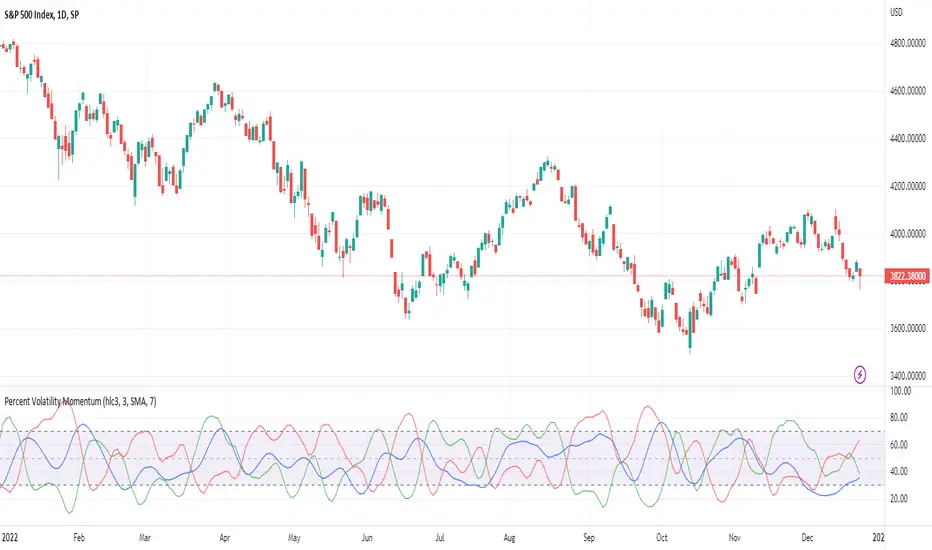
Percent Volatility MomentumThis pine script calculates percent volatility momentum, negative percent volatility and positive percent volatility. The blue line is the overall momentum of the current percent volatility trend. The red line only includes negative movements in the percent volatility of the source. The green line includes only positive movements of the percent volatility of the source. The script also includes an angle and a normalized angle setting that allows one to determine the angle of the source curve. Note, the angle was transformed from -90 to 90 to 0 to 100. Such that an angle of -90 is transformed to 0. An angle of 0 is transformed to 50 and an angle of 90 is transformed to 100. This is the first draft of this script and my first pine script published. Any feedback is welcome. I borrowed code from TradingView's Linear Regression Channel and Relative Strength Index pine scripts.
Quantum CDV HistogramThis script is an addition to Fixed Quantum Cdv.
It shows vector cdv ratio in columns.
You can select the length as an input to how many bars to look back for the whole calculation.
The green bars represent the bullish values and the red bars the bearish values.
The green line represents an ema of the bullish value and the red line the ema of the bearish value.
The momentum ema (in purple) represent the cdv ratio (bullish - bearish).
When the momentum ema is at 100% or more it’s a good sell opportunity and when the momentum ema is at or under 100% it’s a good buy opportunity. It is not financial advise. Make sure to make your own analysis. This script help to make entries, but do not enter positions only based on this signal.
In the inputs you can select the emas that you want to display on your histogram.
The original script is the Cumulative Delta Volume by LonesomeTheBlue.

Alex's Dikfat Velocity 2hr CCI Color SignalerAlex's Dikfat Velocity 2hr CCI Color Signaler
As most traders have experienced at one time or another, over bought and oversold readings are relative in nature and do not always work as a standalone reading.
Momentum indicators such as the Commodity Channel Index ( CCI ) have to be understood and read correctly to determine the value in a momentum reading.
When an asset is "Overbought" or "Oversold" the reading can remain in this region Irrationally for extended periods as the market remains in irrational trend.
In order to better understand this and other readings on a momentum indicator clues such as divergence, exhaustion, continuation, time and frequency as well as the actual velocity of the movement must be measured. In addition, there are very specific measurement lines on the CCI that must be read and that can reject or break and result in the asset either loosing or gaining momentum in one direction or the other. These are the dashed lines in the background.
For the purposes of this Indicator, the actual function, characterization and use of CCI will not be explained here as the colored indications themselves will do all the work for you.
It is very important to know that the calculations used to signal the color filling ARE NOT based on simple breaks of the dashed background lines as traditionally read with a CCI indicator.
The calculations used in this Indicator are based on a very fine tuned mathematical algorithm that measure an unseen element within the CCI . When the VELOCITY of a move in momentum is met, the color fills will begin. When the VELOCITY of the move changes, so to will colorization. This has led to some of the best High Probability Long and Short Sale signaling in any CCI indicator. Pairing this with your favorite chart indicators and personal analysis will result in high tradability but can also be used stand alone.
Remember: No one single indicator should ever be used to determine market signaling.
A basic understanding of a CCI indicator is recommended before using this indicator.
This indicator and the proprietary calculations used were built and meant to be used on the 2 Hour Timeframe. The indicator is open to all time frames and accuracy increases as the time frame increases.
It is recommended that if you use this indicator on a lower timeframe, to pull CCI readings from a higher Timeframe as found in the settings.
This indicator signals long and short opportunities. High Probability long and short trades, bullish and bearish divergence building, market time traps and bullish / bearish continuation as well as exhaustion of these moves.
There is also a companion indicator which will signal the High Probability Long and Short trades on the candle chart called "Alex's Dikfat CCI Equity Signaler" Which will place white Triangles on the candle chart showing high probability long entries and Orange Triangles for High Probability short entries. These are also built into the CCI line and can be turned on in this indicator.
Color Code:
Bullish Continuation: (Background Color Black)
The function of the black background colorization is to alert the user that a bullish move has begun and is currently in a strong continuation period. the longer the black background color draws, the more sustained or trending up the current move is. When these background lines begin to break and start to appear as more frequent broken background lines, exhaustion in the move can be assumed. When the black stops drawing all together, the strength of the continuation move is gone.
Bearish Continuation: (Background Color Fuchsia)
The function of the fuchsia background colorization is to alert the user that a bearish move has begun and is currently in a strong continuation period. the longer the fuchsia background color draws, the more sustained or trending down the current move is. When these background lines begin to break and start to appear as more frequent broken background lines, exhaustion in the move can be assumed. When the fuchsia stops drawing all together, the strength of the continuation move is gone.
High Probability Long/Short:
These buy and sell opportunities were designed to give a trader the best signal/entry on a Long or a Short with the highest probability of making a large and typically sustained impulse move.
High Probability Long: (White Color Fill)
The High Probability Long is a signal to BUY with the best possible entry on an a pending large impulse move to the upside. When White begins to fill, The long is extremely likely. The signal is confirmed on the close of the following candle after white begins to draw unless an opposing color immediately follows, or white dips below the zero line. White will always usually start just below the zero line in the highest probability scenarios.
High Probability Short: (Orange Color Fill)
The High Probability Short is a signal to SELL SHORT with the best possible entry on a pending large impulse move to the downside. When Orange begins to fill, The Short is extremely likely. The signal is confirmed on the close of the following candle after orange begins to draw unless an opposing color immediately follows. Some of the best entries for Orange are when it starts at the END of a black stripe in the background and better so when Orange dips below zero for entry. The signal was designed to color early enough to get in a short during consolidation before the move.
Long and Short Opportunities: Long and Short opportunities are just as they sound. Coloring will signal green for a long opportunity and red for a short opportunity. These opportunities are not always guaranteed and usually result in an lesser impulse move in one direction with a shorter duration.
Long Opportunity: (Green)
The Long Opportunity is a signal that a Long is possible however with less likely odds of a larger more sustained move. When Green begins to fill, a long opportunity is available. The signal is confirmed on the close of the following candle after green begins to draw unless an opposing color immediately follows, or green dips below the zero line. Green will always usually start just above the zero line and have the best opportunities at the end of Bullish Divergence (Blue) at the end of Bearish Continuation (Fuchsia) or a non filled CCI .
Short Opportunity: (Red)
The Short Opportunity is a signal that a Short is possible however with less likely odds of a larger more sustained move. When Red begins to fill, a short opportunity is available. The signal is confirmed on the close of the following candle after red begins to draw unless an opposing color immediately follows. Some of the best entries for Red are when it starts at the END of a black stripe in the background (higher odds than other red signaling). The signal was designed to color early enough to get in a short during consolidation before the move and better so if orange develops after red.
Bullish Divergence: (Dark Blue)
Dark Blue colors when Bullish Divergence is detected. Bullish divergence is a signal that momentum is building higher within the asset for an up move while price action in the candle chart makes lower lows. Bullish Divergence is not a signal to buy or sell but rather a sign post to say WAIT. Bullish divergence is building and a Long is coming. Some traders will buy bullish divergence in anticipation of a move and is only equitable if you have the cash and resolve to follow it through for as long as it is developing. Buying or selling divergence right away is not always the best practice unless a hard dip below all momentum lines followed by an immediate buy signal from white or green resulting in a drop base rally.
Bearish Divergence: (Dark Maroon)
Dark Maroon colors when Bearish Divergence is detected. Bearish divergence is a signal that momentum is dropping out of the asset for a move lower while price action in the candle chart makes higher highs. Bearish Divergence is not a signal to buy or sell but rather a sign post to say WAIT. Bearish divergence is building and a Short is coming. Some traders will sell bearish divergence in anticipation of a move and is only equitable if you have the cash and resolve to follow it through for as long as it is developing. Buying or selling divergence right away is not always the best practice unless a hard rip above all momentum lines followed by an immediate sell signal from red or orange resulting in a rally base drop.
No Color Fill:
When CCI has no color fill whatsoever it is telling the trader there are no high velocity movements in momentum in any direction. Best practice is to do nothing and wait out the Time Trap currently on the chart until signaling develops.
Time and Frequency:
Time and frequency is notable throughout the indicator. First and foremost when CCI is not being filled it is best practice to do nothing as there is NO Velocity of Movement within the asset at that time. This is one of the most obvious of Time Traps.
Bullish and Bearish Divergence is also a type of Time Trap. The longer these develop, the more weak hands are shaken out of the market and derivatives traders have their premium burned. Best practice with divergences is also to wait until adequate signaling develops, or be willing to buy or sell the appropriate divergence by accumulating or distributing for as long as it develops; or simply to buy/sell and hold for the move.
Any Sustained color for extended periods of time is also a time trap signaling to the trader that the asset is being irrational in its present move.
Bullish and Bearish Continuation:
These also deal with time and frequency most importantly. When we are on a sustained Bull Run, black will color in the background continuously. When the black starts to barcode or break up, exhaustion of the bull run is assumed as the frequency of the run becomes erratic. Inversely, When we are on a sustained Bear Run, fuchsia will color in the background continuously. When the fuchsia starts to barcode or break up, exhaustion of the bear run is assumed as the frequency of the run becomes erratic.
The color scheme is designed to be read from darkest to lightest when a sequence of events is found. I.E Dark Maroon>Red>Orange or Inversely Dark Blue>Green>White
In keeping with the best practices and traditions of TradingView, we have published this as a public script with the best intentions of aiding the TradingView community in unique and valuable ways. While some of our best indicators are by invite only, we feel an addition to the community of this magnitude will add to the fabric and substance of community.

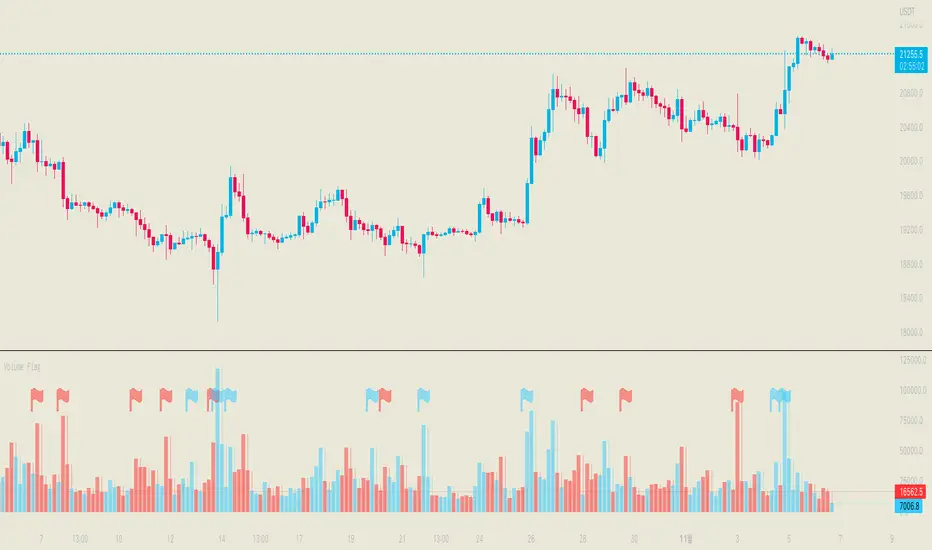
Volume FlagThis indicator shows the increased volume compared to the previous volume.
A flag is displayed when the trading volume increased by *n of the previous candle.
Receive a signal as an alert.
Thank you.
(Please comment and click on the rocket.)
-------------------
이 지표는 이전 캔들의 거래량 대비 증가된 거래량을 확인할 수 있습니다.
깃발을 사용하여 증가 감소를 확인할 수 있으며 n배 만큼의 증가 되었을때 표시됩니다.
그리고 깃발이 표시될 경우 알람을 받으실 수 있습니다.
감사합니다.
댓글과 로케트 클릭 부탁드립니다.
[TTI] Stage Analysis Momentum Index––––History & Credit
The credit to this indicator goes to Stan Weinstein, the father of Stage Analysis. By studying his books and methods he has disclosed the exact way of calculating the Momentum Index that is being used by him and his team in order to gauge the market.
–––––What it does
The indicator falls into the category of technical indicators used by Stan. It calculates an simple moving average based on the difference between the Advancing and Declining issues on various markets.
The settings of the indicator allow to adjust the length of the moving average as well to choose 1 of the 3 markets for which it has been scripted to work: NYSE, NASDAQ or Total US Stocks.
–––––How to use it
The indicator ought to be used on the daily chart
The most important thing to look for is if the indicator is if it is above zero and below zero. A below zero Momentum index is an outright bearish signal and traders should consider stepping out of the market or initiate short positions.
The other things that ought to be considered are the depth and length of the prior to a violating action. In a nutshell the longer, stronger the above zero action the more powerful a below zero cross will be.

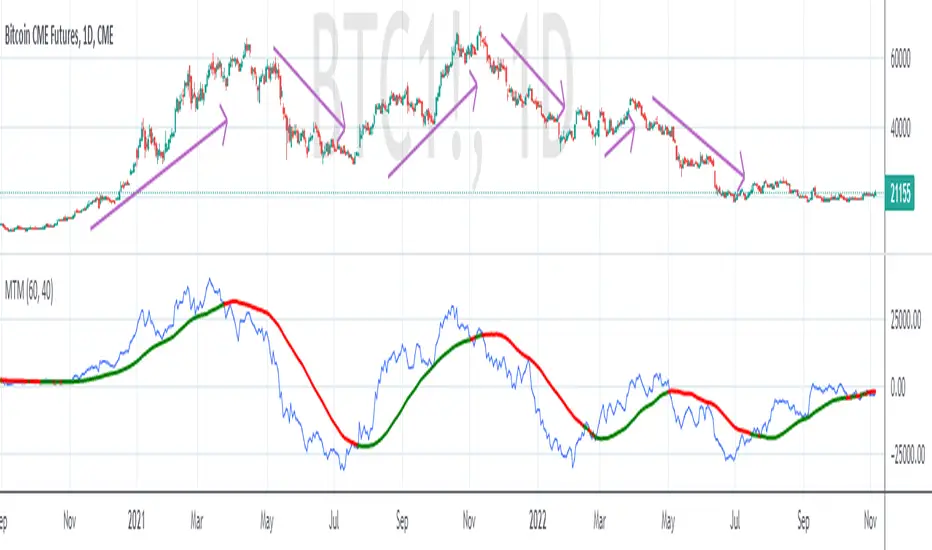
MTM - Momentum IndicatorMTM - Momentum
Description
The Momentum indicator is a speed of movement indicator that is designed to identify the speed (or strength) of price movement. This indicator compares the current close price to the close price N bars ago and also displays a moving average of this difference.
Category
Momentum Indicators
Parameters
N ( Default: 6 Min: 1 Max: 100 )
N1 ( Default: 6 Min: 1 Max: 100 )
Chart Script
MTM : CLOSE-REF(CLOSE,N);
MTMMA : MA(MTM,N1)
www.edgerater.com
TMO ScalperTMO - (T)rue (M)omentum (O)scillator) MTF Scalper Version
TMO Scalper is a special custom version of the popular TMO Oscillator. Scalper version was designed specifically for the lower time frames (1-5min intraday scalps). This version prints in the signals directly on top of the oscillator only when the higher aggregations are aligned with the current aggregation (the big wheels must be spinning in order for a small wheel to spin). The scalper consist of three MTF TMO oscillators. First one is the one that plot signals (should be the fastest aggregation), second serves as a short term trend gauge (good rule of thumb is to us 2-5x of the chart time frame or the first aggregation). The third one (optional) is shaded in the background & should only serve as a trend gauge for the day (usually higher time frames 30min+).
Time Frames Preffered by Traders:
1. 1m / 5m / 30m - This one is perfect for catching the fastest moves. However, during choppy days the 1min can produce more false signals..
2. 2m / 10m / 30m - Healthy middle, the 2min aggregation nicely smooths out the 1min mess. Short term gauge is turning slowly (10min for a signal to confirm).
3. 3m / 30m / 60m - This TF is awesome for day traders that prefer to take it slow. Obviously, this combination will produce far less signals during the day.
Hope it helps.

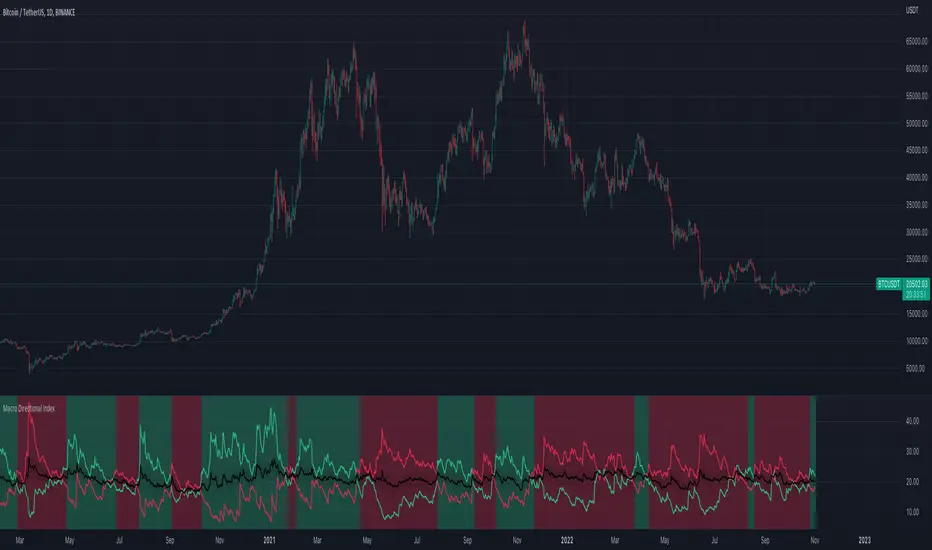
Macro Directional IndexCore to this indicator is the rate at which DI+ and DI- are moving away or towards each other. This is called The Rate of Change (ROC). The ROC length dictates how many bars back you want to compare to the current bar to see how much it has changed. It is calculated like this:
(source - source /source ) * 100
This indicator has 4 values in the status line:
DI+
DI-
Distance between DI+ and DI-
DI Rate of Change
DI Rate of Change
The rate of change is smoothed using an EMA. A shorter EMA length will cause the ROC to flip back and forth between positive and negative while a larger EMA length will cause the ROC to change less often. "Since the rate of change is used to indicate periods of 'consolidation', you want to find a setting that doesn't flip back and forth too often.
Directional Index Middle Channel
Between the DI+ and DI- is a black centerline. Offset from this centerline is a channel that is used to filter out false crosses of the DI+ and DI-. Sometimes, the DI+ and DI- lines will come together in this channel and cross momentarily before resuming the direction prior to the cross. When this happens, you don't want to flip your bias too soon. The wider the channel, the later the indicator will signal a DI reversal. A narrower channel will call it sooner but risks being more choppy and indicating a false cross."
Waverider [Loxx]Waverider is a momentum strategy that probes historical data to find the optimal entries based on measures of volatility and gaussian adaptive filtering. To accomplish this, after each successful trade, XX trades will be skipped until a specific loss count is achieved after which the strategy will activate again, searching for the next trade.
Features
Select long/short profit target and stoploss by %
Skip weekends
Toggle on/off adaptive divergence detection and forced exit

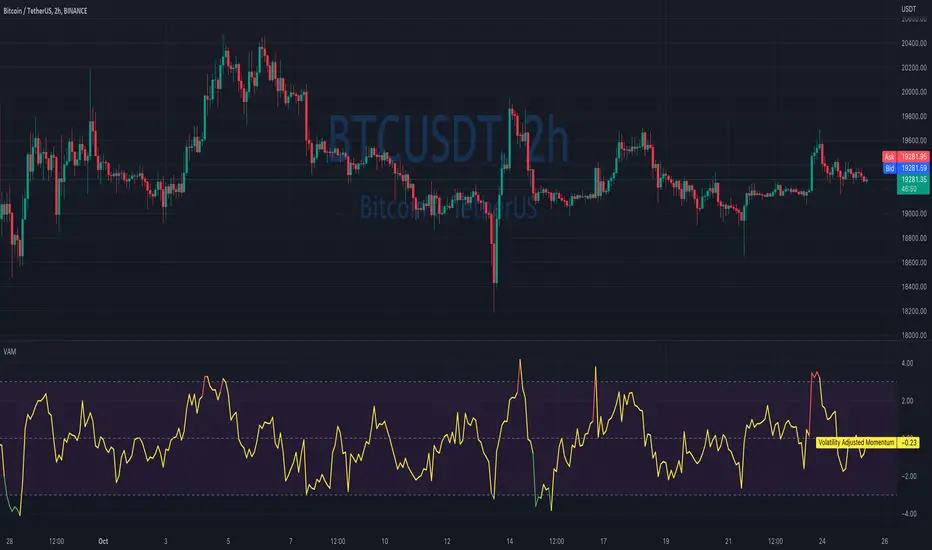
Volatility Adjusted MomentumIt's a script that computes volatility-adjusted momentum indicators.
The problem with the momentum indicator is that it's absolute and it's hard to interpret its value. For example, if you'll change the timeframe or instrument value of Momentum will be very different.
We tried to solve that by expressing momentum in volatility. This way you can easier spot overbought/oversold values.
You can choose to use Standard Deviation or ATR for adjustments.
Thanks to @MUQWISHI for helping me code it.
Disclaimer
Please remember that past performance may not be indicative of future results.
Due to various factors, including changing market conditions, the strategy may no longer perform as well as in historical backtesting.
This post and the script don’t provide any financial advice.
Ichimoku MA Up & DownIchimoku and MA use the default.
It is repainted because it uses a moving average line.
A marker is only true if it was created after the candle closed.
The principle is too simple.
Please enjoy using it.
- Up : Conversion Line > MA #1 and Base Line > MA #2
It is an uptrend. The short-term moving average should be above the conversion line. And the long-term should be above the Base Line.
- Down : Conversion Line < MA #1 and Base Line < MA #2
It's a downtrend. The short-term moving average should be below the conversion line. And the long-term should be below the Base Line.
You can get better results if you use a momentum indicator like RSI.
Thank you.

Qube [AstrideUnicorn]Qube is an indicator that shows market regimes. It is able to detect medium and long term trends and ranging markets. If the indicator bars are colored blue and are between the two blue lines, it means that the market is in sideways movement or consolidation. If indicator bars cross the upper boundary and are colored green, it means that the market is in an uptrend. Red bars crossing the lower blue line indicate a downward trend. The red or green columns are further referred as signal bars.
The indicator is based on the normalized momentum oscillator raised to the third power. This is done to increase the sensitivity of the indicator and to emphasize the difference between the market modes.
The indicator can be used in different ways. One of them is determining the trend direction based on the last signal bar. Even if the current indicator bar is blue (showing range or consolidation), the user should consider the longer-term market mode as upward if the last signal bar is green. And vice versa, if the last signal bar is red, the current market bias is downward. One other way to use the indicator is to catch active price impulses, when columns of the same color (red or green) appear consecutively.

Directional Slope Strength IndexThe most basic of trend indicators is the price change over some period of time. Rate of change is the most common indicator to use which calculates the current price minus the price n bars back. I've written this indicator to solve several problems the default value of ROC.
1. We're interested in the magnitude or strength of the slope of change.
2. We need a number that we can make decisions from between 0 and something close to a peak of 10.
3. We need the ability to define a threshold where a directional change might be taking place.
The Directional Slope Strength Index solves these problems by taking 1000 samples of your given Rate of Change input and calculating a standard score (or z-score) which represents the number of standard deviations by which the current rate of change is above or below the historical average. A higher number represents a stronger move up and a lower (negative) number represents a stronger move down. A value closer to 0 would represent a sideways trend or the slowing of a current trend.
A potential threshold could be 2 or -2 which is two standard deviations from the mean ROC.
The inputs can be modified to control the sensitivity.
1. A lower ROC length would provide a more sensitive measure, but still measure how that sensitive input changes over 1000 samples.
2. I recommend keeping the sample rate at 1000 as that provides enough historical data to give a more accurate distribution and therefore a more accurate DSSI (z-score).
A number of decisions can be made from the indicator:
1. When the DSSI crosses above 2, it could be a sign of a strong move upward. When below -2 it could be a sign of a strong downward move.
2. When the DSSI persists in a positive or negative channel between 0 and 2 or 0 and -2 this could indicate the formation of the next trend.
3. Values outside 2 and -2 standard deviations should be interpreted as high volatility environments.
4. For convenience, a highest and lowest DSSI have been plotted to provide references to the historical extremes.
I'm open to any questions and feedback as this is a first, original indicator for me.

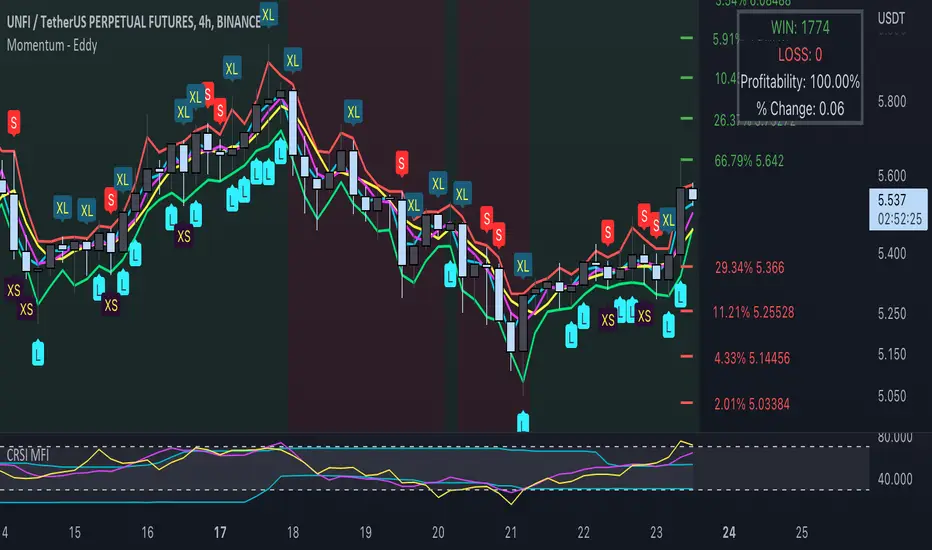
Momentum - EddyThis indicator uses momentum, emas, macd trend, probability to find the best entry for both long and short positions.
L = Long
When the low goes below the green line (ema fast low), close is above open and momentum is up
S = Short
When the high goes above the red line (ema fast high), close is below open and momentum is down
XS = Exit short at potential bullish pivot
When the low is below a red step (probability) and below ema fast low and both ema fast high and low are 0.5 % (can be changed in the settings) spread, and high is below ema fast low and open is at least 0.2 % spread (can be change in the settings).
XL = Exit long
When the high is above ema fast high and above a green step (probability) with at least 0.2 % spread (customizable in the settings)
The win rate changes based on the % change parameter. The lower the % change the higher the win rate will be.
Green and Red background shows you a bull trend or bear trend. It uses the Mac signal (periods are customizable in the settings).
You can add alerts for Long / Short / Exit Long / Exit short.
You can adjust parameters in the settings.
Use your own judgement to place trades. This algorithm helps you remove the stress of trading.
To avoid false signals trade from 4h timeframe +.
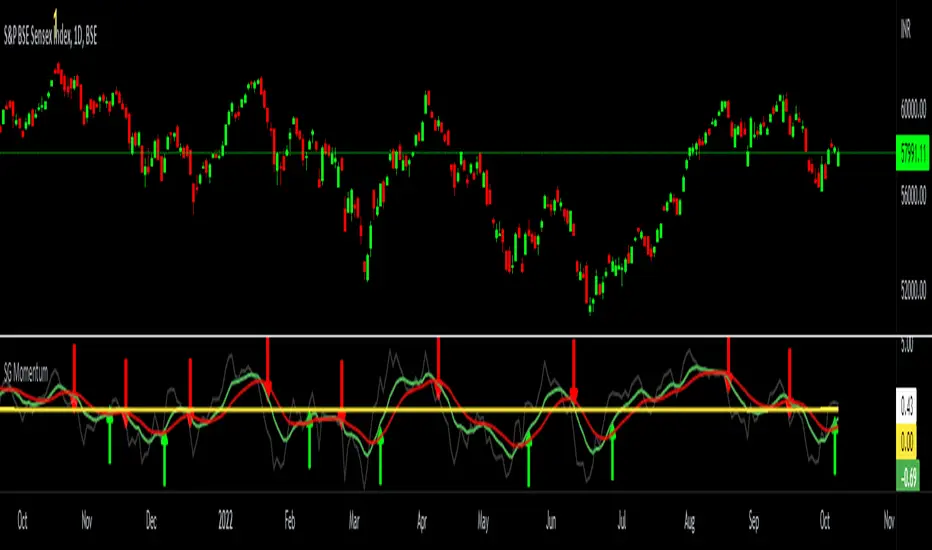
SG MomentumHello All,
I have made a momentum indicator based on the distance from exponential moving average. This captures both buy and sell cycles effectively. The logic is to calculate the distance of closing price from an exponential moving average ( I use 13 period - You are free to choose any other period) - this is the dim grey line which you can toggle off too. Then I smoothen this by calculating a 9-period EMA of the same (the green line). I further slow it down by another 9-period EMA of the same ( the red line). Now when the green lines crosses the red line from below 0 it signifies a new bull cycle and vice versa for bear cycle. This works across all timeframes. I have marked few signals in the below chart for your reference.