Smart Accumulation Pro – US SmallCap Edition v2
Smart Accumulation Pro v2 — US SmallCap Edition
Institutional Footprint and Structural Behavior Engine
Overview
Smart Accumulation Pro v2 detects structural behavior, internal liquidity shifts, and multi-phase accumulation footprints that are not visible through momentum or volatility indicators. The engine focuses on underlying institutional habits rather than reacting to price alone.
ULTRA — High-Threshold Structural Trigger
ULTRA appears only when multiple internal phases align simultaneously. It is not a momentum spike or volume anomaly. It represents compression pressure, phase readiness, and structural alignment. ULTRA does not repaint. When this signal appears, internal liquidity has already transitioned into an acceleration phase.
PRE — Early Structural Drift (Not a Buy Signal)
PRE should not be interpreted as a buy signal. It indicates gradual accumulation or controlled liquidity positioning. PRE usually appears during stable or quiet phases but rarely appears during panic drops or disorderly downtrends.
ACC — Transitional Footprint Signal
ACC identifies late-stage structural footprints. It is not intended as a standalone buy trigger. ACC highlights that structural preparation is underway, but direction and timing require user validation. ACC often precedes larger institutional behavior.
Philosophy
This engine does not attempt to cover every market pattern. It focuses on the highest-probability institutional habits. Exit timing, risk management, and execution remain user responsibility. The tool minimizes noise and emphasizes rare, high-impact structural zones.
Preset Modes
1) Conservative
For ETFs or stable large-cap instruments. Minimal noise and lower signal frequency.
2) Normal
Optimized for US mid-cap and small-cap behavior. Balanced and recommended as the default mode.
3) Aggressive
For volatile or thematic instruments. Higher frequency, higher risk.
Usage Notes
This indicator does not provide financial advice. It highlights structural conditions that often precede institutional movement. Execution and risk decisions depend on the user.
License Notice
Unauthorized copying, redistribution, or sharing is prohibited. Invite-Only access requires your TradingView username. One purchase equals one user license.
------------------------------------------------------------
Korean Summary (한국어 요약본)
------------------------------------------------------------
Smart Accumulation Pro v2는 세력의 습관, 유동성 이동, 압축 단계 등의 “보이지 않는 내부 구조”를 추적하는 지표다. 기존 모멘텀 기반 지표로는 포착되지 않는 패턴을 분석한다.
ULTRA 신호는 여러 내부 단계가 동시에 정렬될 때만 등장하는 극히 희귀한 트리거다. 페인팅이 없으며, 신호가 뜰 때 이미 내부 구조는 가속 단계에 진입한 상태다.
PRE는 매수 신호가 아니다. 세력이 서서히 움직이기 시작하거나 유동성을 재정렬할 때 나타나는 미세한 초기 흔적이다.
ACC는 본격 움직임 전에 나타나는 마지막 흔적이다. 단독 매수 신호가 아니며, 이후 더 큰 구조적 변화로 이어질 가능성을 나타내는 정도로 해석해야 한다.
이 지표는 모든 패턴을 잡지 않는다. 세력이 반복적으로 사용해 온 고확률 구조만 좁게 추적한다. 출구 전략과 리스크 관리는 사용자의 몫이다.
프리셋은 Conservative, Normal, Aggressive의 3가지 모드로 구성되며, 각각 안정형·균형형·변동성형 종목에 맞춰 설계되었다.
본 지표는 금융 조언을 제공하지 않으며, 무단 공유 또는 재배포는 금지된다. Invite-Only 기반이며 1인 1라이선스 방식이다.
Indicatore Momentum (MOM)

QuantMotions - TPR Sentinel LineTPR Sentinel Line is an advanced adaptive Support/Resistance system that combines multi-layered trend analysis with a directional Time-Price Ratio (TPR) engine. The indicator dynamically builds a stabilized support or resistance line that adjusts to market volatility, trend strength, ATR expansion and contraction, and real-time slope changes.
This creates a high-precision, self-adjusting trend barrier that acts as support in uptrends, resistance in downtrends, and a neutral anchor during sideways phases.
Key Features
✔ Adaptive Trend Base
- A composite trend model blending:
- Kijun-style midpoint
- Donchian midline
- SMA & EMA smoothing
This creates a stable baseline that reacts smoothly but reliably to structural trend shifts.
✔ Directional TPR Calculation
The indicator measures slope across short, medium, and long trend windows, normalizes it with ATR, and determines:
- Trend direction
- Trend strength
- Momentum quality
✔ Dynamic Support/Resistance Line
Depending on trend direction:
- In uptrends → the line becomes adaptive support
- In downtrends → the line becomes adaptive resistance
- In neutral phases → the line centers around the smoothed trend base
A built-in lag factor prevents unrealistic jumps and keeps the level stable.
✔ Automatic Support/Resistance Zones
The indicator expands the main line into upper and lower zones based on ATR and trend strength, creating a dynamic volatility envelope around the trend structure.
✔ Signals & Alerts
- Support bounce
- Resistance rejection
- Breakouts above/below the dynamic line
These events help identify high-probability continuation or reversal moments.
✔ Information Panel
A real-time status table displays:
- Trend direction
- Trend strength
- Current S/R level
🎯 Ideal For
- Precision entries on pullbacks
- Detecting trend shifts earlier
- Identifying strong or weak trend phases
- Adaptive take-profit and stop-loss zones
- Filtering false breakouts
💡 Summary
TPR Sentinel Line gives you a living, breathing support/resistance structure that evolves with the market.
Instead of relying on static levels, you get a continuously adapting trend barrier that reflects real strength, real volatility, and real momentum.
A powerful tool for traders who want structure, clarity, and trend confidence.

EGGY SIGNALEGGY SIGNAL is a custom trading system designed to eliminate market noise and provide clean, high-probability entry signals. Unlike standard indicators that often give conflicting information, this script uses a Triple Confirmation Algorithm that works in the background.
The script combines three essential market elements:
Trend Filter: Determines the overall market direction to prevent counter-trend trading.
Momentum Detector: Identifies the speed of price movement.
Strength Validator: Confirms the power of the current candle.
How it Works: This indicator utilizes a "Clean Chart" philosophy. You will not see messy lines or clouds.
BUY Signal: Appears only when the Trend is Bullish, Momentum is shifting upwards, and Market Strength is confirmed.
SELL Signal: Appears only when the Trend is Bearish, Momentum is shifting downwards, and Market Strength is confirmed.
Features:
No Repaint: Signals are permanent once the candle closes.
False Signal Filtering: The algorithm automatically filters out signals during choppy/sideways markets.
Proprietary Settings: The input parameters are hardcoded and optimized for specific market conditions to ensure strategy integrity.
How to Use: Simply wait for the "BUY" or "SELL" label to appear. If no label is present, the market is considered neutral or too risky for entry.

Ryan Bot Signals ProRyan EMA Trend Screener Pro — Smart Auto Signals + TP/SL Engine + MTF Dashboard
Ryan EMA Trend Screener Pro is an advanced trading system that combines
✔ EMA Ribbon Trend Confirmation
✔ Auto BUY/SELL Signals
✔ ATR-based TP & SL engine
✔ Multi-Timeframe Trend Dashboard
✔ Real-Time Screener
into one clean, powerful tool.
Key Features
🔹 Smart EMA Crossover Signals
Automatically detects momentum shifts using fast vs slow EMA cloud.
🔹 Auto TP/SL System
– Up to 4 Take-Profit levels
– ATR-based dynamic Stop Loss
– Entry, SL & TP lines with labels
– Trade zones highlighted using boxes
🔹 MTF Trend Dashboard
Trend status from 5m, 15m, 30m, 1h, Daily
Shows combined trend strength (Bullish / Bearish).
🔹 Built-in Screener
Scan multiple symbols directly on your chart.
Displays trend direction & recent signals.
🔹 Fully Customizable
Modify EMA lengths, ATR settings, TP count, dashboard position & screener layout.
How to Use
Follow BUY/SELL labels created by EMA2/EMA8 crossover.
Use TP/SL lines to plan exits.
Check dashboard to confirm higher-timeframe trend.
Optional: add your favourite chart structure (S/R, Fibs, Liquidity).
Disclaimer
This tool does not guarantee profits. Use proper risk management.

CSS_LFU_v0.1Overview:
A multi-factor, market-adaptive swing strategy designed for intraday and short-term crypto trading. It synthesizes momentum, volatility, and trend signals into a unified composite score over a configurable lookback window. The strategy leverages a modular, signal-weighted approach to ensure robust entry timing while remaining compatible with human-in-the-loop validation and algorithmic execution.
Core Modules:
AJFFRSI (RSX-based Momentum): Measures smoothed price momentum with noise-reduction filters to detect crossovers relative to the QQE trailing stop.
QQE (Quantitative Qualitative Easing RSI): A modified RSI with a dynamic trailing stop that adapts to short-term volatility, identifying exhaustion and potential reversal points.
Keltner Channel Zones: Determines overextension relative to trend, providing buy/sell zones based on ATR-banded EMA.
WaveTrend Oscillator: Confirms short-term swings and market direction through smoothed oscillator cross signals.
Rolling Composite Score: Aggregates module signals over a unified lookback (e.g., 144 bars) to normalize noise and capture consistent trends.
Signal Logic:
Each module outputs a discrete score (+1 / 0 / -1).
The rolling composite score sums all module scores over the lookback period.
Long positions trigger when the rolling score meets or exceeds the long threshold.
Short positions trigger when the rolling score meets or falls below the short threshold.
Multi-dimensional signal aggregation reduces false positives from single indicators.
Rolling lookback ensures score normalization across different volatility regimes.
Highly modular: easy to adapt modules or weights to different instruments or timeframes.
Fully compatible with automated execution pipelines, including custom exchange screener bots.
Use Case:
Ideal for quant-driven altcoin or multi-asset strategies where high-frequency validation is critical and sequential module weighting enhances trend flip detection.

AJFFRSI+QQEROC Uses Jurik RSI for smooth, responsive momentum measurement
Incorporates QQE features for trend strength and dynamic trailing stop signals
Designed for clearer, more reliable overbought/oversold and reversal signals on TradingView
Suitable for intraday, swing, and longer-term analysis
Not a financial advice. DYOR

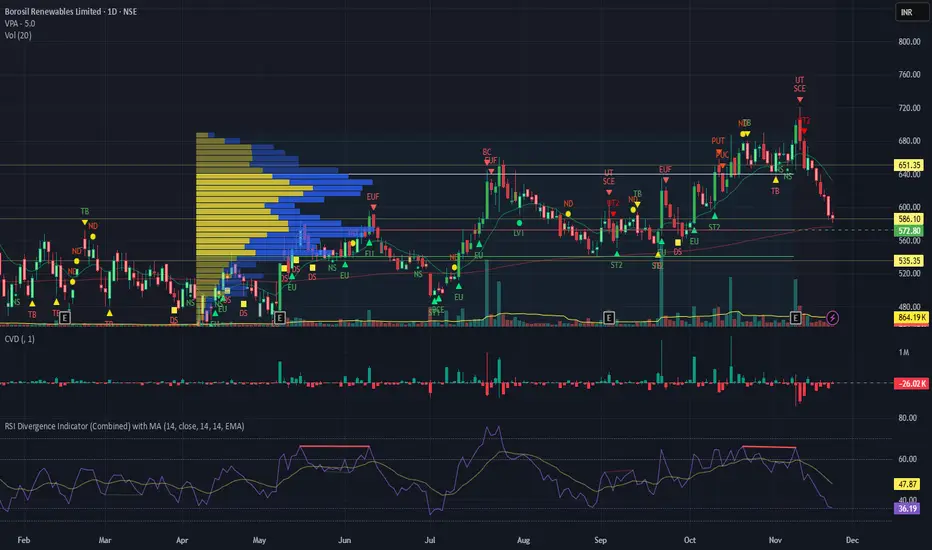
RSI Divergence Indicator with closingRSI Divergence Indicator with Closing Line is an advanced momentum-analysis tool that combines Regular Divergence, Hidden Divergence, Multi-RSI comparison, Moving Averages, and a dynamic RSI Closing Line into one powerful oscillator panel.
This script is designed for traders who want deeper insight into momentum strength, trend exhaustion, and reversal zones by analyzing both price action and RSI structure.
Momentum + Volume Percentile
This advanced momentum indicator combines smoothed momentum analysis with percentile-based volume filtering to identify high-quality trading opportunities backed by significant market participation.
How It Works:
The indicator calculates momentum (rate of change) over a customizable period and applies multiple smoothing techniques to reduce noise. It then filters price action by highlighting only periods where volume exceeds a specified percentile threshold.
The algorithm:
Calculates raw momentum based on price changes over the specified period
Applies customizable smoothing (SMA, EMA, WMA, or HMA) to the momentum values
Computes a moving average of the smoothed momentum as a trend reference
Analyzes volume over a lookback period to establish percentile rankings
Highlights candles where volume exceeds the percentile threshold with color-coded backgrounds
Distinguishes between bullish (green) and bearish (red) high-volume events

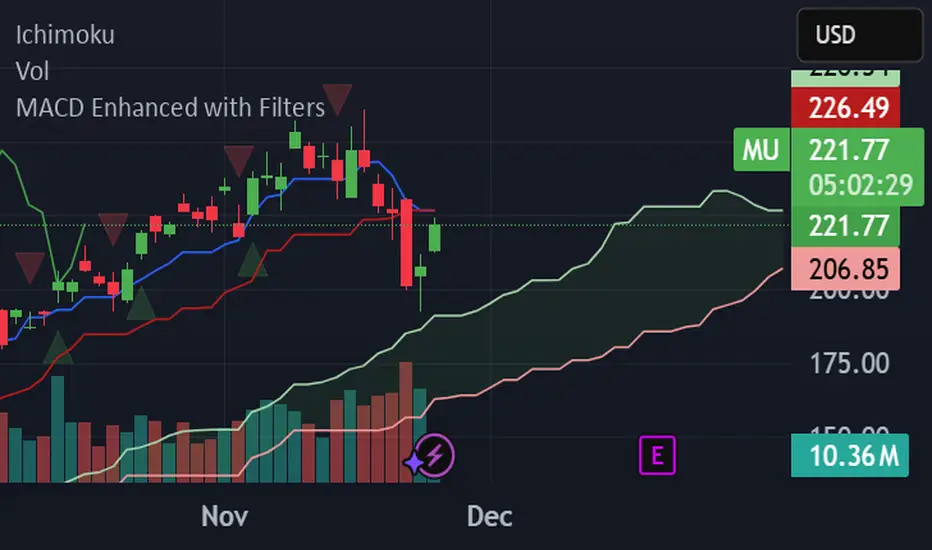
MACD Enhanced with FiltersProfessional MACD indicator with buy/sell signals and real-time alerts. Features: ✅ MACD crossover signals with triangles ✅ Green buy triangles (below bars) ✅ Red sell triangles (above bars) ✅ Real-time browser/email/Slack alerts ✅ Signal strength analysis ✅ Customizable parameters Perfect for active traders managing multiple accounts. Supports Webull, Interactive Brokers, and other platforms.
Volatility Signal-to-Noise Ratio🙏🏻 this is VSNR: the most effective and simple volatility regime detector & automatic volatility threshold scaler that somehow no1 ever talks about.
This is simply an inverse of the coefficient of variation of absolute returns, but properly constructed taking into account temporal information, and made online via recursive math with algocomplexity O(1) both in expanding and moving windows modes.
How do the available alternatives differ (while some’re just worse)?
Mainstream quant stat tests like Durbin-Watson, Dickey-Fuller etc: default implementations are ALL not time aware. They measure different kinds of regime, which is less (if at all) relevant for actual trading context. Mix of different math, high algocomplexity.
The closest one is MMI by financialhacker, but his approach is also not time aware, and has a higher algocomplexity anyways. Best alternative to mine, but pls modify it to use a time-weighted median.
Fractal dimension & its derivatives by John Ehlers: again not time aware, very low info gain, relies on bar sizes (high and lows), which don’t always exist unlike changes between datapoints. But it’s a geometric tool in essence, so this is fundamental. Let it watch your back if you already use it.
Hurst exponent: much higher algocomplexity, mix of parametric and non-parametric math inside. An invention, not a math entity. Again, not time aware. Also measures different kinds of regime.
How to set it up:
Given my other tools, I choose length so that it will match the amount of data that your trading method or study uses multiplied by ~ 4-5. E.g if you use some kind of bands to trade volatility and you calculate them over moving window 64, put VSNR on 256.
However it depends mathematically on many things, so for your methods you may instead need multipliers of 1 or ~ 16.
Additionally if you wanna use all data to estimate SNR, put 0 into length input.
How to use for regime detection:
First we define:
MR bias: mean reversion bias meaning volatility shorts would work better, fading levels would work better
Momo bias: momentum bias meaning volatility longs would work better, trading breakouts of levels would work better.
The study plots 3 horizontal thresholds for VSNR, just check its location:
Above upper level: significant Momo bias
Above 1 : Momo bias
Below 1 : MR bias
Below lower level: significant MR bias
Take a look at the screenshots, 2 completely different volatility regimes are spotted by VSNR, while an ADF does not show different regime:
^^ CBOT:ZN1!
^^ INDEX:BTCUSD
How to use as automatic volatility threshold scaler
Copy the code from the script, and use VSNR as a multiplier for your volatility threshold.
E.g you use a regression channel and fade/push upper and lower thresholds which are RMSEs multiples. Inside the code, multiply RMSE by VSNR, now you’re adaptive.
^^ The same logic as when MM bots widen spreads with vola goes wild.
How it works:
Returns follow Laplace distro -> logically abs returns follow exponential distro , cuz laplace = double exponential.
Exponential distro has a natural coefficient of variation = 1 -> signal to noise ratio defined as mean/stdev = 1 as well. The same can be said for Student t distro with parameter v = 4. So 1 is our main threshold.
We can add additional thresholds by discovering SNRs of Student t with v = 3 and v = 5 (+- 1 from baseline v = 4). These have lighter & heavier tails each favoring mean reversion or momentum more. I computed the SNR values you see in the code with mpmath python module, with precision 256 decimals, so you can trust it I put it on my momma.
Then I use exponential smoothing with properly defined alphas (one matches cumulative WMA and another minimizes error with WMA in moving window mode) to estimate SNR of abs returns.
…
Lightweight huh?
∞

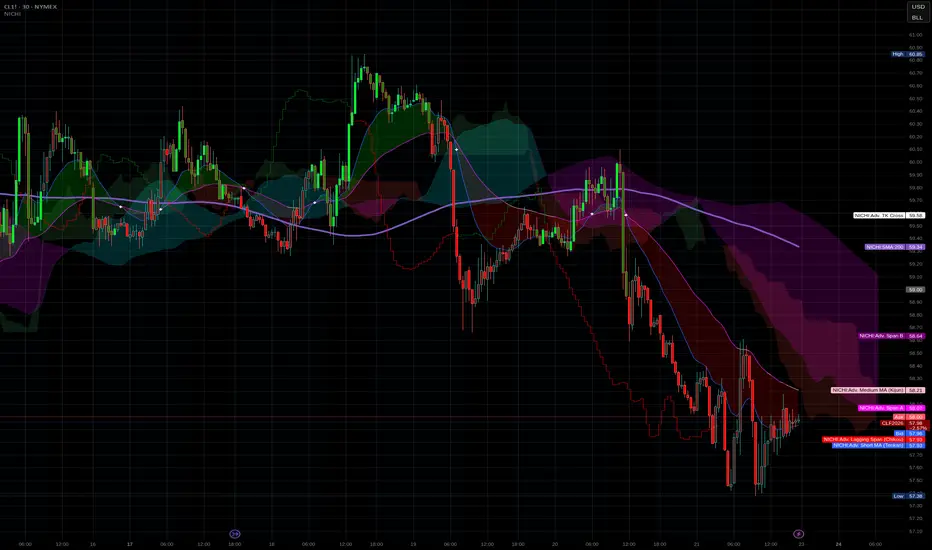
NICHI Beta (NuwenPham's Ichimoku)# **NuwenPham’s Ichimoku (NICHI)**
**Version BETA.251123a.3.1.2 – Pine Script v6**
**Author:** NuwenPham
**Forked from:** Donovan Wall
**Contributors:** Claude (Anthropic)
**License:** MPL 2.0
---
# **Overview**
**NICHI (Nuwen’s Ichimoku)** is a next-generation Ichimoku system that merges the classical Hosoda Ichimoku with a modular adaptive-smoothing engine, enhanced Kumo logic, directional trend counters, and multi-mode bar coloring.
The indicator includes **two completely separate Ichimoku engines**:
* **Standard Ichimoku** – Traditional Donchian-based Tenkan, Kijun, Senkou A/B, and Chikou
* **Advanced Ichimoku** – Fully customizable Ichimoku using 15+ moving-average filters and enhanced logic
NICHI is designed for modern markets—especially **futures and volatile instruments** (NG, CL, ES, NQ, crypto).
---
# **Key Features**
## **1. Dual Ichimoku Systems**
* **Standard Mode:**
Classic Donchian Ichimoku with Tenkan, Kijun, Senkou A/B, and Chikou.
Clean, faithful implementation.
* **Advanced Mode:**
Every Ichimoku line uses a **selected smoothing filter** (EMA, KAMA, FRAMA, Hull, McGinley, etc.).
Includes directional persistence tracking, enhanced cloud logic, and adaptive bar coloring.
---
## **2. Advanced Filter Engine (15+ Smooth Types)**
Use any of the following for Tenkan, Kijun, Senkou B, or Chikou:
* EMA
* DEMA
* SMA
* SMMA (RMA)
* WMA
* VWMA
* Hull MA
* ALMA
* LSMA (Linear Regression)
* McGinley Dynamic
* KAMA
* FRAMA
* COVWMA
* Moving Median
* 50th Percentile (Nearest Rank)
This transforms Ichimoku into an **adaptive trend system**.
---
## **3. Enhanced Cloud (Kumo) Modeling**
* Independent forward offsets for Span A & Span B
* Cloud colors adapt based on strength, direction, and filter behavior
* Cloud thickness reflects volatility
* Neutral cloud state available when spans disagree
---
## **4. Directional Persistence Counters**
NICHI tracks the **trend streak** of each main component:
* Tenkan rising/falling
* Kijun rising/falling
* Span A rising/falling
* Span B rising/falling
These counters make cloud and line colors more accurate and stable.
---
## **5. Regime-Based Bar Coloring (3 Modes)**
NICHI includes three built-in trading frameworks:
### **Mode 1: Kumo-Based**
Bar color reflects price relative to the cloud:
* Green = Above Kumo
* Red = Below Kumo
* Orange = Inside Kumo
Ideal for **trend-following** and **market regime detection**.
---
### **Mode 2: Tenkan/Kijun-Based**
Bar color reflects momentum structure:
* Green = Price above both Tenkan & Kijun
* Red = Price below both
Designed for **momentum entries and TK breakouts**.
---
### **Mode 3: Chikou-Based**
Bars reflect historical confirmation:
* Green = Chikou > price (offset period)
* Red = Chikou < price
Excellent for **confirmation-first strategies** where accuracy matters most.
---
## **6. Multi-MA Overlay System**
Up to **four optional moving averages**:
* SMA, EMA, SMMA, WMA, HMA, VWMA
* Independent lengths, widths, colors
* Useful for bias, confluence, trend filters
Default: **SMA 200** enabled.
---
## **7. TK Cross Signals**
Both systems show TK crosses:
* Standard TK Cross (classic)
* Advanced TK Cross (filtered version)
Crosses appear with clear markers for entry/exit logic.
---
# **How to Use NICHI**
## **1. Choose Your Engine**
* **Standard:** Clean, classic Ichimoku
* **Advanced:** Adaptive, filter-driven Ichimoku
* **Both:** Comparative analysis
---
## **2. Select Your Filter Type (Advanced Mode)**
Suggested filters:
| Market | Filter Type | Notes |
| ---------------- | ---------------- | -------------------------- |
| Natural Gas (NG) | KAMA or FRAMA | Handles extreme volatility |
| Crude Oil (CL) | McGinley Dynamic | Smooths spikes |
| ES / NQ | SMMA or WMA | Balanced response |
| Crypto | Hull or ALMA | Handles momentum bursts |
| FX | EMA or SMMA | Classic, stable |
---
## **3. Choose a Bar-Color Strategy**
* **Kumo-Based:** Trend following
* **TK-Based:** Momentum and breakouts
* **Chikou-Based:** Highest confirmation/accuracy
Each strategy is valid and intentionally distinct.
---
## **4. Reading the Cloud**
* **Bullish Cloud:** Span A > Span B
* **Bearish Cloud:** Span A < Span B
* **Neutral Cloud:** Disagreement between spans
* **Thick Cloud:** High volatility / stronger structure
* **Thin Cloud:** Weak trend / potential twist
---
## **5. Entry & Exit Concepts**
### **Entries**
* **Momentum Entry:** TK cross with price above the cloud
* **Reversal Entry:** TK cross before a cloud twist
* **Confirmation Entry:** Chikou breaks cleanly above/below past price
### **Exits**
* Price falling through Kijun
* Re-entering the cloud
* Opposite TK cross
* Cloud flipping against position
---
# **Recommended Trading Approaches**
## **Kumo-Based Trend Strategy**
* Long above cloud, short below
* Avoid signals inside cloud
Best for swing/position trading.
---
## **TK-Based Momentum Strategy**
* Enter on Tenkan/Kijun breakout
* Bar color confirms momentum
* Cloud filter optional but helps
Great for high-velocity markets.
---
## **Chikou-Based Confirmation Strategy**
* Enter only when Chikou confirms structure
* Highest accuracy, fewest trades
* Ideal for volatile markets (NG, CL)
---
# **Closing Notes**
NICHI is a **research-grade Ichimoku framework** designed to handle modern volatility where traditional Ichimoku often fails.
It supports scalpers, swing traders, and system developers alike.
Experiment with:
* Filter types
* Cloud offsets
* Bar-color modes
* MA overlays
to match your strategy and market.
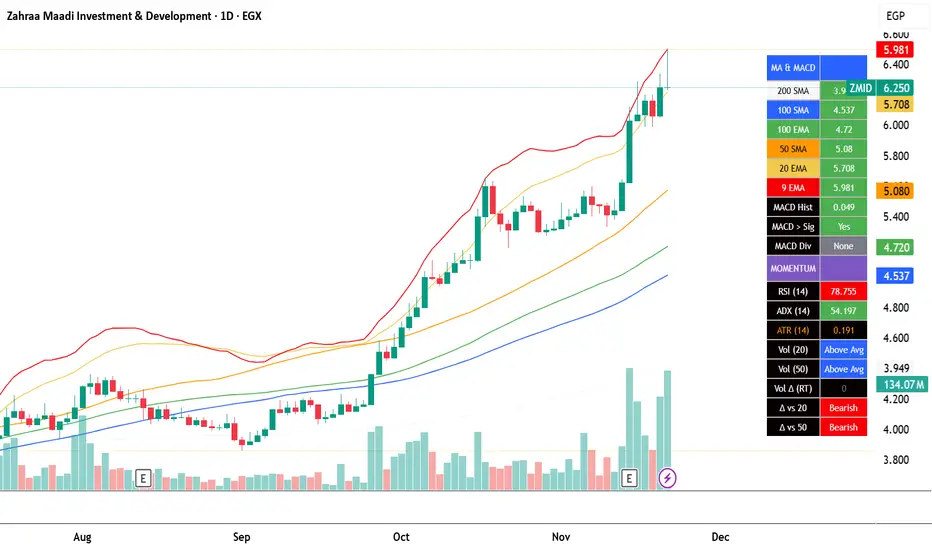
EGX Monitor Dashboard By Biscuits_Trading_Solutionsلوحة مراقبة البورصة المصرية من Biscuits_Trading_Solutions
نظرة عامة:
لوحة مراقبة البورصة المصرية هي أداة تحليل فني شاملة مصممة لتوفير نظرة فورية وواضحة على صحة السوق. تجمع الأداة مؤشرات رئيسية مختارة بعناية لتناسب السوق المصري لتوفر عليك عبء إضافة عدد كبير من المؤشرات في وقت واحد على الشاشة - بما في ذلك متوسطات متحركة، MACD، RSI، ADX، ATR، وتحليل متقدم لحجم التداول (دلتا) - في جدول واحد وسهل القراءة على الرسم البياني. مثالية للمتداولين الذين يحتاجون لتقييم الاتجاه، الزخم، وديناميكيات الحجم في لمحة دون تشويش الشاشة.
English Version is below ⬇️⬇️
المميزات الرئيسية:
* لوحة متابعة للمتوسطات المتحركة: تتابع وتلون وضع السعر بالنسبة لـ 6 متوسطات متحركة رئيسية (200 بسيط، 100 بسيط/آسي، 50 بسيط، 20 آسي، 9 آسي).
* تحليل متقدم لـ MACD: تعرض قيمة هِستوجرام MACD، حالة التقاطع بين MACD وخط الإشارة، وتكشف عن انحرافات صعودية محتملة (Bullish Divergence).
* مقاييس الزخم: تتضمن قراءات RSI و ADX، مع تلوينها للإشارة إلى مناطق الشراء المفرط والبيع المفرط وقوة الاتجاه.
تحليل متطور للحجم:
*دلتا الحجم/السيولة (الفارق بين حجم الشراء وحجم البيع).
* الحجم مقارنة بمتوسطه المتحرك لـ 20 و 50 فترة (لمقارنته بفترة متوسطة 20 شمعة وطويلة 50 شمعة)
* دلتا الحجم مقارنة بمتوسطها المتحرك لـ 20 و 50 فترة لقياس ضغط البيع والشراء.
عرض مرئي نظيف : جميع البيانات معروضة في جدول شبه شفاف يمكن وضعه في أي مكان على الرسم البياني. يتم أيضًا رسم المتوسطات المتحركة بخفة للاستدلال البصري.
مدخلات قابلة للتخصيص : جميع أطوال المؤشرات، المضاعفات، وموضع الجدول قابلة للتعديل كليًا من الإعدادات.
إزاحة الشمعة : تسمح لك بمشاهدة قراءات المؤشر من عدد محدد من الشمعات السابقة، مما يفيد في تحليل الظروف السابقة.
طريقة الاستخدام:
* تقييم الاتجاه: انظر إلى جدول المتوسطات المتحركة. وجود عدة خلايا خضراء (السعر فوق المتوسط) يشير إلى اتجاه صاعد قوي، بينما يشير اللون الأحمر إلى اتجاه هابط.
* تأكيد الزخم: تحقق من مؤشر RSI (شراء مفرط >70، بيع مفرط <30) و ADX (اتجاه قوي >25) لفهم سياق الزخم.
*تأكيد الحجم: استخدم أعمدة الحجم لتأكيد الحركات. حركة السعر المصحوبة بحجم "أعلى من المتوسط" ودلتا "صعودي" تكون أكثر أهمية.
إشارات الدخول/الخروج:
* انحراف MACD الصعودي يمكن أن يشير إلى انعكاس محتمل.
* وجود "نعم" لـ "MACD > Sig" يؤكد الزخم الصعودي.
* قيم ATR المرتفعة تشير إلى زيادة التقلب، وغالبًا ما ترافق الاتجاهات القوية أو اختراقات المستويات.
الإعدادات:
ما عليك سوى إضافة المؤشر إلى الرسم البياني الخاص بك. ستظهر اللوحة تلقائيًا. يمكنك ضبط جميع المعاملات (أطوال المتوسطات المتحركة، إعدادات الحجم، مكان الجدول) في تبويب "الإدخالات" في نافذة المؤشر لتناسب أسلوب تداولك.
إخلاء مسؤولية: جميع الإشارات التي تظهر ليست دعوة للبيع والشراء، هذا المحتوى تعليمي يساعدك على قراءة الشاشة بشكل أفضل، وقرارك الاستثماري يعود لك وحدك.
---
EGX Monitor Dashboard By Biscuits_Trading_Solutions
Overview :
The EGX Monitor Dashboard is a comprehensive technical analysis tool designed to provide a clear and immediate overview of the market's health. It consolidates key indicators, carefully selected for the Egyptian market, saving you the burden of adding a large number of indicators to your screen at once —including moving averages, MACD, RSI, ADX, ATR, and advanced volume delta analysis—into a single, easy-to-read table on your chart. Perfect for traders who need to assess trend, momentum, and volume dynamics at a glance without cluttering their screen.
Key Features :
* Moving Average Dashboard: Tracks and color-codes the price position relative to 6 key moving averages (200 SMA, 100 SMA/EMA, 50 SMA, 20 EMA, 9 EMA).
* Advanced MACD Analysis: Displays the MACD histogram value, the MACD vs. Signal line crossover state, and detects potential bullish divergences.
* Momentum Gauges: Includes RSI and ADX readings, color-coded for overbought/oversold and trend strength conditions.
Advanced Volume/Liquidity Analysis:
* Volume Delta (the difference between buying and selling volume).
* Volume compared to its 20 and 50-period moving averages (for medium-term 20-bar and long-term 50-bar comparisons).
* Volume Delta compared to its 20 and 50-period moving averages to measure buying/selling pressure.
Clean Visualization: All data is presented in a semi-transparent table that can be positioned anywhere on the chart. The moving averages are also plotted lightly for visual reference.
Customizable Inputs: All indicator lengths, multipliers, and the table position are fully adjustable in the settings.
Bar Offset: Allows you to view the indicator readings from a specific number of bars back, useful for analyzing past conditions.
How to Use:
* Trend Assessment: Look at the MA table. A cluster of green "Bullish" cells (price above MA) indicates a strong uptrend, while red indicates a downtrend.
* Momentum Confirmation: Check the RSI (overbought >70, oversold <30) and ADX (strong trend >25) for momentum context.
* Volume Confirmation: Use the volume columns to confirm moves. A price move with "Above Avg" volume and "Bullish" Delta is more significant.
Entry/Exit Clues:
* A "Bullish" MACD divergence can signal a potential reversal.
* A "Yes" for "MACD > Sig" confirms bullish momentum.
* High ATR values indicate increased volatility, often accompanying strong trends or breakouts.
Configuration:
Simply add the indicator to your chart. The dashboard will appear automatically. You can adjust all parameters (MA lengths, volume settings, table position) in the indicator's "Inputs" tab to suit your trading style.
Disclaimer: All signals that appear are not an invitation to buy or sell. This content is educational and is intended to help you read the screen better. Your investment decision is yours alone.
Stochastic Pro+ Suite📚 What Is the Stochastic Oscillator?
The stochastic oscillator is a momentum indicator comparing a security's closing price to its price range over a set number of periods. The %K line represents the raw stochastic value, while the %D line is a smoothed moving average of %K.
Stochastic helps identify:
Overbought and oversold conditions
Bullish and bearish crossovers
Momentum shifts before price reversals
It is widely used in both trending and ranging markets.
💡 What Makes This Suite Different?
This script supercharges the traditional stochastic with a multi-timeframe engine , divergence detection , and a highly customizable visual suite , including:
✅ Core Features:
- Multi-Timeframe (%K, %D, Spread): Pulls stochastic data from any higher timeframe for improved signal quality.
- Custom Overbought/Oversold Levels: Fully adjustable OB/OS thresholds (default: 80/20).
- %K-%D Spread Histogram: View the difference between %K and %D visually as a histogram.
- Color-coded Cross Highlights: Optional background shading for key crossover events in OB/OS zones (high probability reversal areas).
🔍 Divergence Detection (Optional):
- Bullish Divergence: Price makes lower lows while %K makes higher lows.
- Bearish Divergence: Price makes higher highs while %K makes lower highs.
- Customizable pivot lookbacks and range filters to control divergence strictness.
- Visual divergence labels plotted directly on the oscillator.
🎛️ Fully Toggleable Visuals:
Show/hide %K, %D, OB/OS lines, spread histogram, background highlight, and divergence — all via simple checkboxes.
🔔 Alerts:
Set alerts for both bullish and bearish divergences — ideal for swing, day, or trend reversal strategies.
⚙️ Use Cases
- Spot exhaustion in overbought/oversold zones
- Confirm or filter entries with divergence signals
- Monitor multiple timeframes without switching charts
- Use as a signal tool in confluence with price action or volume indicators
⚠️ Disclaimer
This tool is for educational and informational purposes only. It does not constitute financial advice, trading advice, or investment guidance. Always do your own research and consult a qualified financial advisor before making trading decisions.

Hash Momentum IndicatorHash Momentum Indicator
Overview
The Hash Momentum Indicator provides real-time momentum-based trading signals with visual entry/exit markers and automatic risk management levels. This is the indicator version of the popular Hash Momentum Strategy, designed for traders who want signal alerts without backtesting functionality.
Perfect for: Live trading, automation via alerts, multi-indicator setups, and clean chart visualization.
What Makes This Indicator Special
1. Pure Momentum-Based Signals
Captures price acceleration in real-time - not lagging moving average crossovers. Enters when momentum exceeds a dynamic ATR-based threshold, catching moves as they begin accelerating.
2. Automatic Risk Management Visualization
Every signal automatically displays:
Entry level (white dashed line)
Stop loss level (red line)
Take profit target (green line)
Partial TP levels (dotted green lines)
3. Smart Trade Management
Trade Cooldown: Prevents overtrading by enforcing waiting period between signals
EMA Trend Filter: Only trades with the trend (optional)
Session Filters: Trade only during Tokyo/London/New York sessions (optional)
Weekend Toggle: Avoid low-liquidity weekend periods (optional)
4. Clean Visual Design
🟢 Tiny green dot = Long entry signal
🔴 Tiny red dot = Short entry signal
🔵 Blue X = Long exit
🟠 Orange X = Short exit
No cluttered labels or dashboard - just clean signals
5. Professional Alerts Ready
Set up TradingView alerts for:
Long signals
Short signals
Long exits
Short exits
How It Works
Step 1: Calculate Momentum
Momentum = Current Price - Price
Normalized by standard deviation for consistency
Must exceed ATR × Threshold to trigger
Step 2: Confirm Acceleration
Momentum must be increasing (positive momentum change)
Price must be moving in signal direction
Step 3: Apply Filters
EMA Filter: Long only above EMA, short only below EMA (if enabled)
Session Filter: Check if in allowed trading session (if enabled)
Weekend Filter: Block signals on Sat/Sun (if enabled)
Cooldown: Ensure minimum bars passed since last signal
Step 4: Generate Signal
All conditions met = Entry signal fires
Lines automatically drawn for entry, stop, and targets
Step 5: Exit Detection
Opposite momentum detected = Exit signal
Stop loss or take profit hit = Exit signal
Lines removed from chart
⚙️ Settings Guide
Core Strategy
Momentum Length (Default: 13)
Number of bars for momentum calculation. Higher values = stronger signals but fewer trades.
Aggressive: 10
Balanced: 13
Conservative: 18-24
Momentum Threshold (Default: 2.25)
ATR multiplier for signal generation. Higher values = only trade the biggest momentum moves.
Aggressive: 2.0
Balanced: 2.25
Conservative: 2.5-3.0
Risk:Reward Ratio (Default: 2.5)
Your target profit as a multiple of your risk. With 2.2% stop and 2.5 R:R, your target is 5.5% profit.
Conservative: 3.0+ (need 25% win rate to profit)
Balanced: 2.5 (need 29% win rate to profit)
Aggressive: 2.0 (need 33% win rate to profit)

SWRSI Trends (Source Out)Overview SWRSI Trends is a specialized momentum indicator based on the Relative Strength Index (RSI). While it functions as a visual trading aid with bar coloring and signal shapes, its primary purpose is to serve as a modular signal provider for other strategies and backtesting bots on TradingView.
It detects trend reversals by monitoring RSI crossovers at specific custom levels (Default: 60 and 40), rather than the standard 70/30 extreme zones.
Key Features
1. External Source Outputs (Connect to Bots) This script includes hidden plot outputs specifically designed to interface with other scripts.
RSI LONG SIGNAL (Source): Outputs a value of 1 when a Long condition is met, 0 otherwise.
RSI SHORT SIGNAL (Source): Outputs a value of 1 when a Short condition is met, 0 otherwise.
Usage: You can select these outputs as the "Entry Source" in compatible Strategy scripts or Backtest Bots without needing to copy-paste code.
2. Signal Logic
Long Signal: Triggered when the RSI line crosses OVER the Lower Threshold (Default: 40). This indicates momentum is recovering from the lower zone.
Short Signal: Triggered when the RSI line crosses UNDER the Upper Threshold (Default: 60). This indicates momentum is cooling off from the upper zone.
3. Visual Aids
Bar Coloring: Candles change color based on RSI position (Green above 60, Red below 40).
Dynamic Line: The RSI line changes color to reflect the current zone.
Settings
RSI Length: The lookback period for calculation (Default: 14).
Short Threshold: Level for bearish crossover (Default: 60).
Long Threshold: Level for bullish crossover (Default: 40).
Color Bars: Toggle candle painting on/off.
How to Connect to Another Indicator
Add SWRSI Trends to your chart.
Open the settings of your Target Strategy/Bot (e.g., SwietcherBot).
In the "Source" or "External Signal" input field, select "SWRSI Trends: RSI LONG SIGNAL" or "RSI SHORT SIGNAL" from the dropdown menu.
Hash Momentum Strategy# Hash Momentum Strategy
## 📊 Overview
The **Hash Momentum Strategy** is a professional-grade momentum trading system designed to capture strong directional price movements with precision timing and intelligent risk management. Unlike traditional EMA crossover strategies, this system uses momentum acceleration as its primary signal, resulting in earlier entries and better risk-to-reward ratios.
---
## ⚡ What Makes This Strategy Unique
### 1. Momentum-Based Entry System
Most strategies rely on lagging indicators like moving average crossovers. This strategy captures momentum *acceleration* - entering when price movement is gaining strength, not after the move has already happened.
### 2. Programmable Risk-to-Reward
Set your exact R:R ratio (1:2, 1:2.5, 1:3, etc.) and the strategy automatically calculates stop loss and take profit levels. No more guessing or manual calculations.
### 3. Smart Partial Profit Taking
Lock in profits at multiple stages:
- **First TP**: Take 50% off at 2R
- **Second TP**: Take 40% off at 2.5R
- **Final TP**: Let 10% ride to maximum target
This approach locks in gains while letting winners run.
### 4. Dynamic Momentum Threshold
Uses ATR (Average True Range) multiplied by your threshold setting to adapt to market volatility. Volatile markets = higher threshold. Quiet markets = lower threshold.
### 5. Trade Cooldown System
Prevents overtrading and revenge trading by enforcing a cooldown period between trades. Configurable from 1-24 bars.
### 6. Optional Session & Weekend Filters
Filter trades by Tokyo, London, and New York sessions. Optional weekend-off toggle to avoid low-liquidity periods.
---
## 🎯 How It Works
### Signal Generation
**STEP 1: Calculate Momentum**
- Momentum = Current Price - Price
- Check if Momentum > ATR × Threshold Multiplier
- Momentum must be accelerating (positive change in momentum)
**STEP 2: Confirm with EMA Trend Filter**
- Long: Price must be above EMA
- Short: Price must be below EMA
**STEP 3: Check Filters**
- Not in cooldown period
- Valid session (if enabled)
- Not weekend (if enabled)
**STEP 4: ENTRY SIGNAL TRIGGERED**
### Risk Management Example
**Example Long Trade:**
- Entry: $100
- Stop Loss: $97.80 (2.2% risk)
- Risk Amount: $2.20
**Take Profit Levels:**
- TP1: $104.40 (2R = $4.40) → Close 50%
- TP2: $105.50 (2.5R = $5.50) → Close 40%
- Final: $105.50 (2.5R) → Close remaining 10%
---
## ⚙️ Settings Guide
### Core Strategy
**Momentum Length** (Default: 13)
Number of bars for momentum calculation. Higher = stronger but fewer signals.
**Momentum Threshold** (Default: 2.25)
ATR multiplier. Higher = only trade biggest moves.
**Use EMA Trend Filter** (Default: ON)
Only long above EMA, short below EMA.
**EMA Length** (Default: 28)
Period for trend-confirming EMA.
### Filters
**Use Trading Session Filter** (Default: OFF)
Restrict trading to specific sessions.
**Tokyo Session** (Default: OFF)
Trade during Asian hours (00:00-09:00 JST).
**London Session** (Default: OFF)
Trade during European hours (08:00-17:00 GMT).
**New York Session** (Default: OFF)
Trade during US hours (08:00-17:00 EST).
**Weekend Off** (Default: OFF)
Disable trading on Saturdays and Sundays.
### Risk Management
**Stop Loss %** (Default: 2.2)
Fixed percentage stop loss from entry.
**Risk:Reward Ratio** (Default: 2.5)
Your target reward as multiple of risk.
**Use Partial Profit Taking** (Default: ON)
Take profits in stages.
**First TP R:R** (Default: 2.0)
First target as multiple of risk.
**First TP Size %** (Default: 50)
Percentage of position to close at TP1.
**Second TP R:R** (Default: 2.5)
Second target as multiple of risk.
**Second TP Size %** (Default: 40)
Percentage of position to close at TP2.
### Trade Management
**Use Trade Cooldown** (Default: ON)
Prevent overtrading.
**Cooldown Bars** (Default: 6)
Bars to wait after closing a trade.
---
## 🎨 Visual Elements
### Chart Indicators
🟢 **Green Dot** (below bar) = Long entry signal
🔴 **Red Dot** (above bar) = Short entry signal
🔵 **Blue X** (above bar) = Long position closed
🟠 **Orange X** (below bar) = Short position closed
**EMA Line** = Trend direction (green when bullish, red when bearish)
**White Line** = Entry price
**Red Line** = Stop loss level
**Green Lines** = Take profit levels (TP1, TP2, Final)
### Dashboard
When not in real-time mode, a dashboard displays:
- Current position (LONG/SHORT/FLAT)
- Entry price
- Stop loss price
- Take profit price
- R:R ratio
- Current momentum strength
- Total trades
- Win rate
- Net profit %
---
## 📈 Recommended Settings by Timeframe
### 1-Hour Timeframe (Default)
- Momentum Length: 13
- Momentum Threshold: 2.25
- EMA Length: 28
- Stop Loss: 2.2%
- R:R Ratio: 2.5
- Cooldown: 6 bars
### 4-Hour Timeframe
- Momentum Length: 24-36
- Momentum Threshold: 2.5
- EMA Length: 50
- Stop Loss: 3-4%
- R:R Ratio: 2.0-2.5
- Cooldown: 6-8 bars
### 15-Minute Timeframe
- Momentum Length: 8-10
- Momentum Threshold: 2.0
- EMA Length: 20
- Stop Loss: 1.5-2%
- R:R Ratio: 2.0
- Cooldown: 4-6 bars
---
## 🔧 Optimization Tips
### Want More Trades?
- Decrease Momentum Threshold (2.0 instead of 2.25)
- Decrease Momentum Length (10 instead of 13)
- Decrease Cooldown Bars (4 instead of 6)
### Want Higher Quality Trades?
- Increase Momentum Threshold (2.5-3.0)
- Increase Momentum Length (18-24)
- Increase Cooldown Bars (8-10)
### Want Lower Drawdown?
- Increase Cooldown Bars
- Use tighter stop loss
- Enable session filters (trade only high-liquidity sessions)
- Enable Weekend Off
### Want Higher Win Rate?
- Increase R:R Ratio (may reduce total profit)
- Increase Momentum Threshold (fewer but stronger signals)
- Use longer EMA for trend confirmation
---
## 📊 Performance Expectations
Based on typical backtesting results:
- **Win Rate**: 35-45%
- **Profit Factor**: 1.5-2.0
- **Risk:Reward**: 1:2.5 (configurable)
- **Max Drawdown**: 10-20%
- **Trades/Month**: 8-15 (1H timeframe)
**Note:** Win rate may appear low, but with 2.5:1 R:R, you only need ~29% win rate to break even. The strategy aims for quality over quantity.
---
## 🎓 Strategy Logic Explained
### Why Momentum > EMA Crossover?
**EMA Crossover Problems:**
- Signals lag behind price
- Late entries = poor R:R
- Many false signals in ranging markets
**Momentum Advantages:**
- Catches moves as they start accelerating
- Earlier entries = better R:R
- Adapts to volatility via ATR
### Why Partial Profit Taking?
**Without Partial TPs:**
- All-or-nothing approach
- Winners often turn to losers
- High stress watching open positions
**With Partial TPs:**
- Lock in 50% at first target
- Reduce risk to breakeven
- Let remainder ride for bigger gains
- Lower psychological pressure
### Why Trade Cooldown?
**Without Cooldown:**
- Revenge trading after losses
- Overtrading in choppy markets
- Emotional decision-making
**With Cooldown:**
- Forces discipline
- Waits for new setup to develop
- Reduces transaction costs
- Better signal quality
---
## ⚠️ Important Notes
1. **This is a momentum strategy, not an EMA strategy**
The EMA only confirms trend direction. Momentum generates the actual signals.
2. **Backtest thoroughly before live trading**
Past performance ≠ future results. Test on your specific asset and timeframe.
3. **Use proper position sizing**
Risk 1-2% of account per trade maximum. The strategy uses 100% equity by default (adjust in Properties).
4. **Dashboard auto-hides in real-time**
Clean chart for live trading. Visible during backtesting.
5. **Customize for your trading style**
All settings are fully adjustable. No single "best" configuration.
---
## 🚀 Quick Start Guide
1. **Add to Chart**: Apply to your preferred asset and timeframe
2. **Keep Defaults**: Start with default settings
3. **Backtest**: Review historical performance
4. **Paper Trade**: Test with simulated money first
5. **Go Live**: Start small and scale up
---
## 💡 Pro Tips
**Tip 1: Combine Timeframes**
Use higher timeframe (4H) for trend direction, lower timeframe (1H) for entries.
**Tip 2: Avoid News Events**
Major news can cause whipsaws. Consider manual intervention during high-impact events.
**Tip 3: Monitor Momentum Strength**
Dashboard shows momentum in sigma (σ). Values >1.0σ indicate very strong momentum.
**Tip 4: Adjust for Volatility**
In high-volatility markets, increase threshold and stop loss. In quiet markets, decrease them.
**Tip 5: Review Losing Trades**
Check if losses are hitting stop loss or reversing. Adjust stop accordingly.
---
## 📝 Changelog
**v1.0** - Initial Release
- Momentum-based signal generation
- EMA trend filter
- Programmable R:R ratio
- Partial profit taking (3 stages)
- Trade cooldown system
- Session filters (Tokyo/London/New York)
- Weekend off toggle
- Smart dashboard (auto-hides in real-time)
- Clean visual design
---
## 🙏 Credits
Developed by **Hash Capital Research**
If you find this strategy useful, please give it a like and share with others!
---
## ⚖️ Disclaimer
This strategy is for educational purposes only. Trading involves substantial risk of loss and is not suitable for all investors. Past performance is not indicative of future results. Always do your own research and consult with a qualified financial advisor before trading.
---
## 📬 Feedback
Have suggestions or found a bug? Leave a comment below! I'm continuously improving this strategy based on community feedback.
---
**Happy Trading! 🚀📈**

Fat Tony's Composite Momentum Histogram (v01)# Fat Tony's Composite Momentum Histogram
## What It Does
This indicator combines four momentum oscillators into a single composite signal that ranges approximately from -100 to +100. It identifies potential overbought and oversold conditions while weighting signals by volume activity to filter out weak moves.
The histogram shows momentum strength with color-coded bars:
- **Red bars** indicate extreme overbought conditions (above +100)
- **Green bars** indicate extreme oversold conditions (below -100)
- **Blue bars** show positive momentum in normal range
- **Orange bars** show negative momentum in normal range
## Core Components
The indicator blends these four momentum measures:
1. **Williams %R** - Measures where price closed relative to the high-low range
2. **Stochastic %K** - Compares closing price to the recent price range
3. **MACD Histogram** - Shows momentum changes via moving average convergence/divergence
4. **ROC (Rate of Change)** - Measures percentage price change, normalized by volatility
Each component is scaled to a -50 to +50 range, then averaged together. The MACD component uses adaptive scaling based on its historical volatility to remain relevant across different market conditions.
## Volume Weighting
The indicator amplifies signals when volume is elevated and dampens them when volume is low. It uses a logarithmic scaling approach to smooth extreme volume spikes. There's also a minimum volume filter that prevents signals from triggering during very low-volume periods.
## Settings Explained
**Momentum Settings:**
- **Length (14)** - Lookback period for Williams %R and Stochastic calculations
- **MACD Fast/Slow/Signal (12/26/9)** - Standard MACD parameters
- **ROC Length (10)** - Lookback for rate of change calculation
- **MACD StDev Length (200)** - Historical window for normalizing MACD values
**Levels:**
- **Overbought Level (+100)** - Threshold for extreme upside momentum
- **Oversold Level (-100)** - Threshold for extreme downside momentum
**Volume Settings:**
- **Enable Volume Weighting** - Toggle volume amplification on/off
- **Volume Sensitivity (1.5)** - Controls how much volume impacts the signal (higher = stronger impact)
- **Min Avg Volume (50,000)** - Filters out signals when 5-bar average volume is too low
**Components:**
- **Include ROC Component** - Toggle to add/remove ROC from the calculation
- **Enable Trend Filter** - Only allows signals aligned with the 200-period EMA trend
- **Show Component Plots** - Displays individual oscillator values for tuning purposes
## Trading Signals
**Entry Signals:**
- **Long (green triangle)** - Composite crosses above the oversold level with adequate volume
- **Short (red triangle)** - Composite crosses below the overbought level with adequate volume
**Exit Signals (when trend filter enabled):**
- **Long Exit** - Composite crosses below zero from positive territory
- **Short Exit** - Composite crosses above zero from negative territory
The indicator also provides alert conditions for automated notifications on these signal events.

Universal Sentiment Score — V3 Bottom DetectorThe Universal Sentiment Score (USS) condenses a wide range of market conditions into one easy-to-read oscillator. Instead of relying on a single signal, USS blends multiple forms of trend strength, momentum behavior, volatility shifts, and reversal conditions to generate a unified sentiment metric.

RSI PriceThe relative strength index (RSI) is a momentum indicator used in technical analysis. RSI measures the speed and magnitude of a security's recent price changes to detect overbought or oversold conditions in the price of that security. The RSI is displayed as an oscillator (a line graph) on a scale of 0 to 100.
Traditionally, an RSI reading of 70 or above indicates an overbought condition. A reading of 30 or below indicates an oversold condition. In addition to identifying overbought and oversold securities, the RSI can also indicate securities that may be primed for a trend reversal or a corrective pullback in price.

NAMI Lite │ Zero-Repaint Momentum Wave + Reg Divergences (FREE)
NAMI Lite │ 100% Zero-Repaint Momentum Wave + Divergences (FREE)
The only zero-repaint, zero-lag momentum indicator that calls reversals hours early — even the free version beats all paid indicators.
No repainting on closed bars • Instant wave flips • Clean regular divergences • Money Flow confluence
Zero-Repaint Momentum Wave – CCI-based oscillator with real-time color flips (no lag, no lies)
Regular Bull/Bear Divergences – Faded lines on confirmed pivots only
Money Flow Oscillator – Volume-weighted filled areas for extra confirmation
This Lite version is intentionally limited — powerful enough to replace monthly subscriptions, but missing the pro features that make trading effortless.
Upgrade to Full NAMI Suite (One-Time Payment – Cancel Recurring Fees Forever):
Hidden Divergences with Divergence LABELS (catch 70% more massive moves)
200-Color Stochastic Heat Ribbon (gorgeous visual heatmaps)
True VWAP Oscillator + multi-source options
Buy/Sell Dots + Full Alerts (divergence, money flow, wave flips)
Full and Complete Customization (themes, lengths, colors)
Plus our other toolkits: TRAVIS, SMC Pro, and all future tools free
SEE IMAGE FOR COMPLETE NAMI VIEW
Over 800 traders already switched and saved thousands.

Bullish/Bearish Divergence DetectorUsuable on all time-frames
Indicates multiple divergences (up to 3) with the same start point/date of the divergence

RSI Maniac
RSI Maniac
A powerful, fully-customizable RSI indicator designed for traders who want deeper insight into momentum across multiple timeframes. This indicator enhances the traditional RSI by adding multi-timeframe analysis, multi-timeframe moving averages, and optional Bollinger Bands applied directly on the RSI curve.
----- Key Features -----
1️⃣ Multi-Timeframe RSI (HTF RSI) : Analyse higher-timeframe momentum while staying on your current chart.
Enable/Disable HTF RSI
Select any timeframe (1m → 1M)
Dedicated RSI length & source for HTF
Great for spotting:
Trend confirmation or divergence between LTF & HTF momentum
2️⃣ Multi-Timeframe Moving Averages : A powerful addition for traders using higher timeframe confirmation.
Enable/Disable HTF MAs
Independent Fast & Slow MA settings
Separate HTF timeframe
Separate MA type for HTF (EMA or HMA)
Great for spotting:
HTF RSI trend direction
HTF momentum overlays on LTF RSI
Cross-timeframe momentum alignment
🎛️ Clean & Organized User Interface : The indicator organizes settings into intuitive groups.
Current Timeframe RSI
Current Timeframe MA
Higher Timeframe RSI
Higher Timeframe MA
Bollinger Bands Settings
Traders can toggle any component independently.
How to trade ?
Based on my approach, I don’t use RSI to catch reversals. Instead, I use it to trade continuations—when the lower timeframe (LTF) RSI aligns with the higher timeframe (HTF) trend. I simply wait for the LTF RSI to move in the same direction as the HTF RSI and then take the continuation trade. Please check the snapshots for a clearer understanding of how these trades work.
Trade less, trade better!

MOMO – Imbalance Trend (SIMPLE BUY/SELL)MOMO – Imbalance Trend (SIMPLE BUY/SELL)
This strategy combines trend breaks, imbalance detection, and first-tap supply/demand entries to create a clean and disciplined trading model.
It automatically highlights imbalance candles, draws fresh zones, and waits for the first retest to deliver precise BUY and SELL signals.
Performance
On optimized settings, this strategy shows an estimated 57%–70% win-rate, depending on the asset and timeframe.
Actual performance may vary, but the model is built for consistency, discipline, and improved decision-making.
How it works
Detects trend structure shifts (BOS / Break of Trend)
Identifies displacement (imbalance) candles
Creates supply and demand zones from imbalance origin
Waits for first tap only (no second chances)
Confirms direction using trend logic
Generates clean BUY/SELL arrows
Automatic SL/TP based on user settings
Features
Clean BUY/SELL markers
Auto-drawn supply & demand zones
Trend break markers
Imbalance tags
Smart first-tap confirmation
Customizable stop loss & take profit
Works on crypto, gold, forex, indices
Best on M5–H1 for day trading
Note
This strategy is designed for day traders who want clarity, structure, and zero emotional trading.
Use it with discipline — and it will serve you well.
Good luck, soldier.
