MA SLope Potential Divergence - FontiramisuIndicator showing potential momentum divergences on Moving Average's Slope.
The problem with the classic divergence is that when the signal appears, it is sometimes too late to enter a trade .
The potential divergence corrects this problem by signaling the beginning of a potential divergence .
Moving average slope is a momentum indicator that offers relevant insights with divergences
Potential divergences are indicated with the letter B and a red color for Bearish Div or Green color for Bullish Div .
Potential divergence is confirmed when the line and the label "Bear"' or "Bull" appear.
You can either show fast slope's divergences or slow slope's divergences or slow/fast diff's divergences.
Indicatore Momentum (MOM)

TTM Regression°This oscillator attempts to provide context to John Carter's "TTM Squeeze" indicator.
Similar to my MAR° indicator, statistically significant areas based on the past n candles (Lookback) are calculated to provide context for the y-axis values of the TTM indicator.
Note that Carter's squeeze idea has been dropped in favour of the regression bands, in that they offer a clear visual momentum squeeze condition.
The regression bands identify temporary exhaustion of bullish (purple) and bearish (green) momentum; these could potentially be seen as overbought and oversold indications.
The dotted midlines dictate intra-zones where momentum could reverse to continue the larger trend.
All the latter behave similarly to Support and Resistance zones.
The oscillator can also be normalized over a given interval to show results on a scale between 0 and 100, preserving even more context over time.
You should experiment for yourself to find out what is best for you in terms of scale, and Normalization Period.
Normalization Example: on the left you can observe how the momentum is visualized differently based on the scale, given the rapid momentum to the upside.
// –––. Regular
// –––. Normalized
It's crucial to use this oscillator as confluence only and not to take trades based solely on its indications.
At the moment there are no alerts set for this script, open to suggestions :)

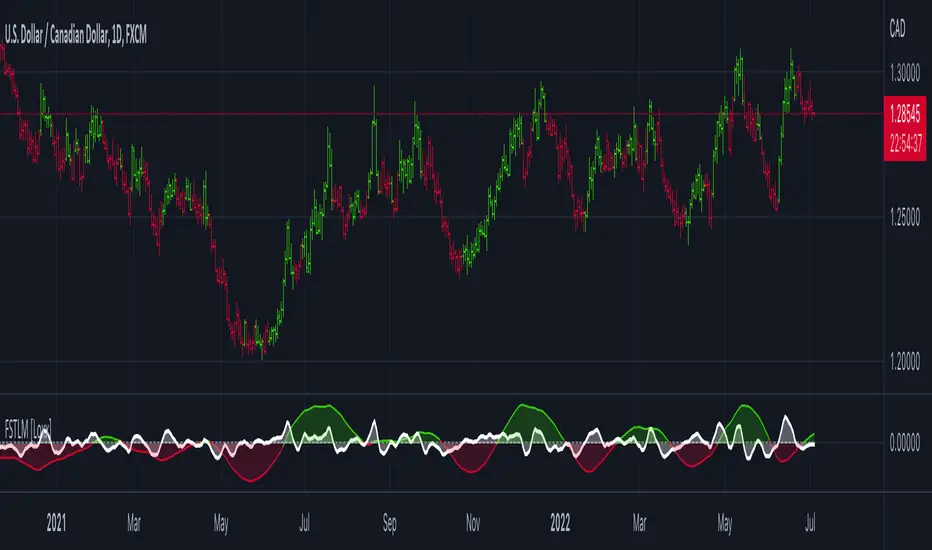
Fast and Slow Trend-Line Momentum [Loxx]Fast and Slow Trend-Line Momentum is a momentum indicator using FATL, SATL, RFTL, & RSTL Digital Filters
What is FTLM-STLM?
Fast Trend Line Momentum (FTLM) and Slow Trend Line Momentum (SLTM) indicators show the rate of price change, FATL and SATL are calculated the similar way as Momentum indicator.
FTLM(bar) = FATL(bar) – RFTL(bar)
STLM(bar) = SATL(bar) – RSTL(bar)
The main difference FTLM from the classic Momentum indicator is the following: it source prices processed by digital filters instead of close prices itself. As a result, FTLM looks smoothed and regular, in contrast with classic Momentum technical indicators.
Included:
-Bar coloring
RAS.V2 Strength Index OscillatorHeavily modified version of my previous "Relative Aggregate Strength Oscillator" -Added high/low lines, alma curves,, lrc bands, changed candle calculations + other small things. Replaces the standard RSI indicator with something a bit more insightful.
Credits to @wolneyyy - 'Mean Deviation Detector - Throw Out All Other Indicators ' And @algomojo - 'Responsive Coppock Curve'
And the default Relative Strength Index
The candles are the average of the MFI ,CCI ,MOM and RSI candles, they seemed similar enough in style to me so I created candles out of each and the took the sum of all the candle's OHLC values and divided by 4 to get an average, same as v1 but with some tweaks. Previous Peaks and Potholes visible with the blue horizontal lines which adjust when a new boundary is established. Toggle alma waves or smalrc curves or both to your liking. This indicator is great for calling out peaks and troughs in realtime, although is best when combined with other trusted indicators to get a consensus.

Multi-timeframe MomentumThe Multi-timeframe momentum indicator is similar in concept to a velocity indicator like rate-of-change, but visualizes smoothed price changes by applying an EMA and linear regression to price difference at every bar. Momentums from 1 minute to 1 quarter are plotted on a single chart using the request.security function. Standard and Fibonacci timeframes are available as well as the ability to hide high-timeframes to keep the chart clean. Like any oscillator, divergence in the momentums can be used to identify price reversals in conjunction with support and resistance. When linear regression is applied, high and low inflection points are used to identify reversals in a manner similar to MACD.
Much love to DumpCap! The script is presented sans secret sauce.

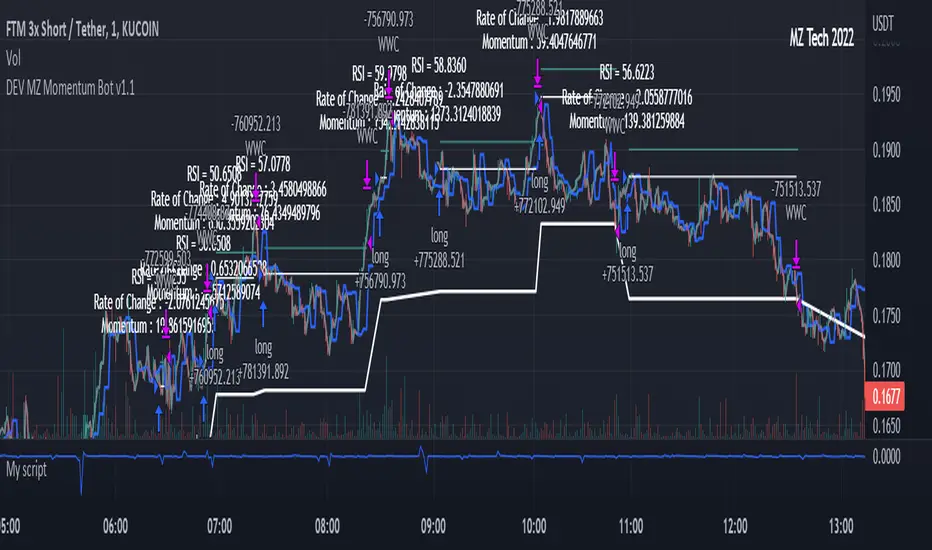
MZ Momentum Non Repainting HTF HFT Scalper BotThis is an original script meant to be a high frequency trader that works on higher time frame calculations. I came up with the idea that using calculus I can figure out the actual rate of change and momentum with different calculations than the momentum indicator that is provided by trading view. Once momentum is shifted on a small time frame, it will provide an entry signal. The script is meant to be used on an algorithmic trading system for scalping purposes. It should be run on a one minute time frame.
Set it up on a one minute chart - setup your bot on a one minute interval.
Find the source of your data. You can use any time frame, open, close. high, low, olc4. Open is pretty much guaranteed to not have any repainting issues - although all the other calcs use a custom isbarconfirmed security repaint calculation.
Set your rate of change period - typically I use a one minute time frame for this as well - but set my length fairly long (30-40).
Then set your period for momentum calculation. This will sample the rate of change data to figure out your momentum. I typically try a setting of 6-8. If that doesn't work, try setting it about the same as the rate of change period and add or subtract a few from there.
Unfortunately due to various plotting constraints in Pinescript, you cannot plot the rate of change and momentum and price in the same.
Set your trigger point. I try values -30, -20, -10, 0, 1. Then finesse to get an earlier entry signal. You should account for a slight delay from the signal to the actual entry. Your backtest should test well, but please note that does not gaurantee results. In my findings, I have seen that there is a slight minimal delay between signal to entry and that can make the difference whether your trade is profitable or not.
Use the show data to show you additional data when you are backtesting. This can allow you to try to filter out results or market conditions that do not work. I typically work with the RSI and use the 30 minute and 15 minute RSIs. I make sure that it is trading within a certain band - about 40-75. You can try the inverse and only buy during really low RSI's as well.
Use the enter and close messages to setup your webhook messages. But I recommend to allow the algo trading platform to close the trade for you based on their calcs since that platform knows the actual price level and when it has become profitable.
Filters have been setup for
Moving Average Variants - any time frame, any length.
RSI - Any time frame, any length,
Future Plans: ATR Filter so you can filter out low volatility periods.
Send me a message with any suggestions.
STD Aadaptive, floating RSX Dynamic Momentum Index [Loxx]STD Aadaptive, floating RSX Dynamic Momentum Index is an attempt to improve Chande's original work on Dynamic Momentum Index. The full name of this indicator is "Standard-Deviation-Adaptive, floating-level, Dynamic Momentum Index on Jurik's RSX".
What Is Dynamic Momentum Index?
The dynamic momentum index is used in technical analysis to determine if a security is overbought or oversold. This indicator, developed by Tushar Chande and Stanley Kroll, is very similar to the relative strength index (RSI). The main difference between the two is that the RSI uses a fixed number of time periods (usually 14), while the dynamic momentum index uses different time periods as volatility changes, typically between five and 30.
What is RSX?
RSI is a very popular technical indicator, because it takes into consideration market speed, direction and trend uniformity. However, the its widely criticized drawback is its noisy (jittery) appearance. The Jurk RSX retains all the useful features of RSI, but with one important exception: the noise is gone with no added lag.
Differences
RSX is used instead of RSI for the calculation, producing a much smoother result
Standard deviation is used to adapt the RSX calculation
Floating levels are used instead of fixed levels for OB/OS
Included
-Change bar colors

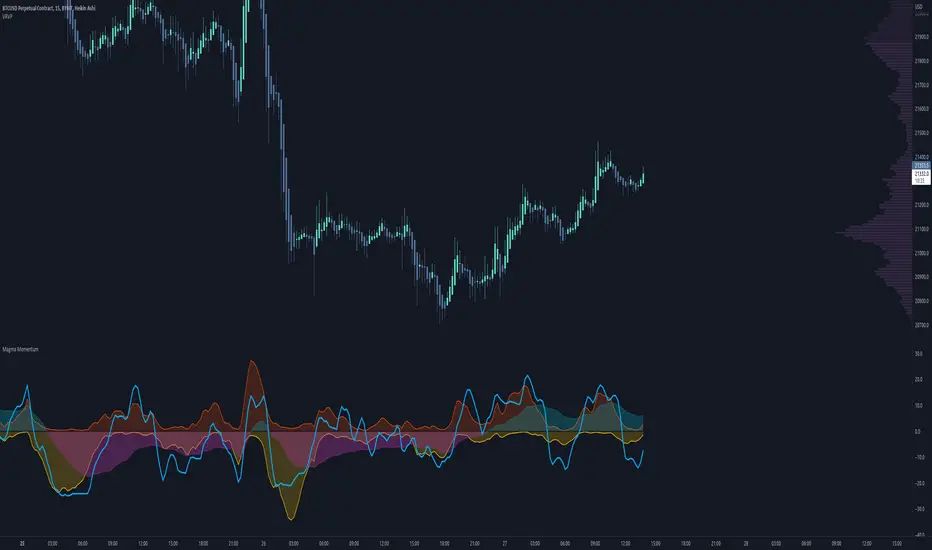
Magma MomentumThis is a simple and easy-to-read momentum indicator that can help you identify divergences and shifts in momentum.
A divergence is when price moves in one direction but the indicator moves in the opposite direction. This typically is a sign of price exhaustion and can indicate that price is about to reverse, at least momentarily.
Here is a comparison with RSI (relative strength index) and some examples of divergences.
Enjoy.
Whale Momentum Wave Oscillator//Credits: @Noldo - Whale Trading System @rumpypumpydumpy - ALMA Ribbons @QuantNomad - Elastic Volume Weighted Moving Average
Composite Indicator, created by taking QuantNomad's EVWMA and using that as input for a variation of rumpypumpydumpy's ALMA Ribbons. Each Ribbon had its sub ribbons summed up and then averaged. The averages were then fed through the ta.rsi and the ta.mom functions giving us our momentum waves. Signal line created from the close value being fed through the ta. ema into the ta.rsi then ta.wma then ta.mom function. Why those in that order? No reason in particular just what I stumbled upon after many variations. I then overlayed Noldo's Whale Trading System to view what "whales" were doing, giving us a good view of when capital is flowing into and out the asset which often contradicts the momentum waves prior to trend changes. Provides a nice visual for how capital is moving along with momentum. Can see when smart money is buying up a big dip or of they seem to still be waiting on the sidelines.

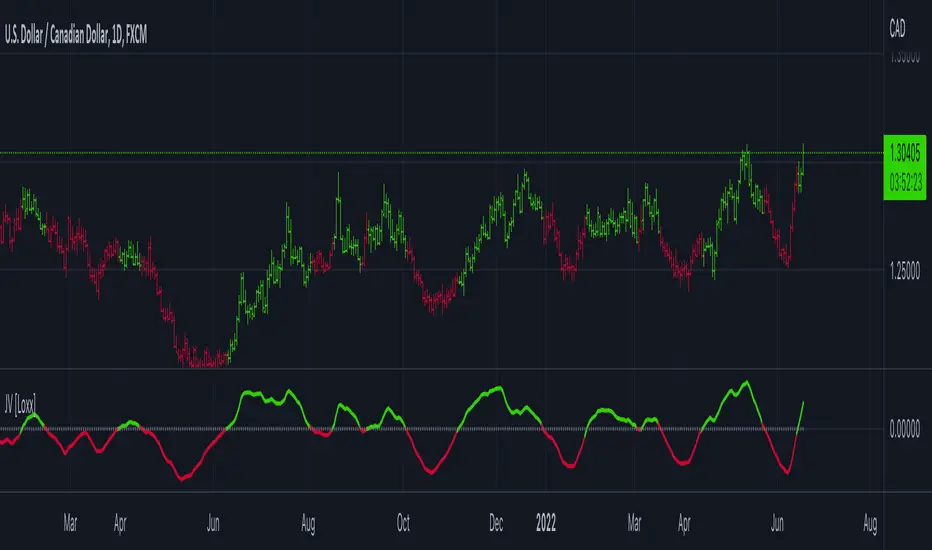
Jurik Velocity ("smoother moment") [Loxx]Jurik Velocity ("smoother moment") is a very simple and very useful calculation. This indicator was created to expose this calculation to folks who might find it useful in their own indicators and strategies.
What is velocity?
Velocity is a vector quantity that refers to "the rate at which an object changes its position." Imagine a person moving rapidly - one step forward and one step back - always returning to the original starting position. While this might result in a frenzy of activity, it would result in a zero velocity. Because the person always returns to the original position, the motion would never result in a change in position. Since velocity is defined as the rate at which the position changes, this motion results in zero velocity. If a person in motion wishes to maximize their velocity, then that person must make every effort to maximize the amount that they are displaced from their original position. Every step must go into moving that person further from where he or she started. For certain, the person should never change directions and begin to return to the starting position.
Velocity is a vector quantity. As such, velocity is direction aware. When evaluating the velocity of an object, one must keep track of direction. It would not be enough to say that an object has a velocity of 55 mi/hr. One must include direction information in order to fully describe the velocity of the object. For instance, you must describe an object's velocity as being 55 mi/hr, east. This is one of the essential differences between speed and velocity. Speed is a scalar quantity and does not keep track of direction; velocity is a vector quantity and is direction aware.
Included:
-Toggle on/off bar coloring
Happy trading!
Relative Aggregate Strength OscillatorCredits to
@wolneyyy - "Mean Deviation Detector - Throw Out All Other Indicators"
And
@algomojo - "Responsive Coppock Curve"
And the default Relative Strength Index
The candles are the average of the MFI ,CCI ,MOM and RSI values presented as candles, they seemed similar enough in style to me so I created candles out of each and the took the sum of all the candle's OHLC values and divided by 4 to get an average.
In the Background we have @wolneyyy's - "Mean Deviation Detector - Throw Out All Other Indicators" in blue
along with @algomojo's - "Responsive Coppock Curve" in red and green.

Momentum Scalping & Swing Signals With AlertsThis Momentum indicator shows a green or red ribbon when smoothed momentum is bullish or bearish. It also includes a long moving average for overall trend confirmation. Wait until the ribbon holds above or below the long moving average and take positions in that direction.
To get an easier to read momentum indicator, I smoothed the momentum out and paired it next to a short term RMA. These two together form the ribbon that will show you early reversals and trend direction. The long moving average is used as an overall trend detector and confirmation for longer term trends.
***HOW TO USE***
Scalping: Enter longs when the ribbon turns green and enter shorts when the ribbon turns red. Exit positions when the ribbon turns the opposite color or crosses the long moving average.
Swing Trading: When the ribbon holds above the long moving average or breaks out and retests it, look for long positions and exit when the ribbon turns red or crosses the long moving average. When the ribbon holds below the long moving average or breaks down and retests it, look for short positions and exit when the ribbon turns green or crosses the long moving average.
***DETAILS***
This indicator gives early reversal signals very well and waiting for the momentum ribbon to cross the long moving average helps to get you into positions when the market is ready to really move while filtering out some of the noise.
The ribbon and background will change to green or red depending on whether it is currently bullish or bearish.
There is also a label that changes colors and tells you if momentum is bullish or bearish and also whether the momentum ribbon is above or below the long moving average.
Green or red circles will appear on the indicator when there is a bullish or bearish cross of the momentum ribbon and the long moving average.
It includes alerts that trigger when momentum is turning bullish/bearish or when the momentum ribbon is crossing the long moving average.
***CUSTOMIZATION***
Each piece of this indicator can be customized to suit your preferences including the momentum source, length, smoothing length, short moving average length and long moving average length. You can also turn off the labels, signals and long moving average. All of these settings can be managed within the indicator settings input tab.
***MARKETS***
This indicator can be used as a signal on all markets, including stocks, crypto, futures and forex.
***TIMEFRAMES***
This Momentum Scalping & Swing Signals indicator can be used on all timeframes.
***TIPS***
Try using numerous indicators of ours on your chart so you can instantly see the bullish or bearish trend of multiple indicators in real time without having to analyze the data. Some of our favorites are Trend Friend Scalp & Swing Trade Signals, Volume Spike Scanner, Buy & Sell Pressure Volume Profile, and RSI Scalper in combination with this momentum indicator. They all have real time Bullish and Bearish labels as well so you can immediately understand each indicator's trend.

Stacked EMAsStacked Daily & Weekly EMAs + Labels
Pretty much self-explanatory indicator that shows the current momentum based on the key exponential moving averages.
Three stages of the EMAs:
1. Stacked Positively (Bullish) - EMAs are stacked on top of each other which represents a healthy bullish uptrend (green Label).
2. Stacked Negatively (Bearish) - EMAs are stacked below each other meaning the trend is bearish (red label).
3. Stacked Neutral (Neutral) - EMAs are crossing each other without any clear direction = chop (yellow label).
Hope it helps.

LNL Squeeze ArrowsIf you struggle with the entries, low % win rate or trading the squeeze setup overall, this indicator is for you!
If you look closely at your losing trades, chances are the losers have one thing in common = inverse momentum. I created this tool after I found out that Stacked EMAs and picture perfect trend is not the only thing you need for a squeeze setup. Squeeze arrows pinpoint the exact moment where the squeeze momentum change happens (momentum change is absolutely crucial for the squeeze setup). These arrows will help you stay out of "everything was aligned but still failed" type of setups.
Squeeze Arrows:
1. Momentum Arrows (cyan blue/red) - Showing the best possible moment for an entry during the squeeze (after you see one, you can expect the squeeze to fire soon).
2. Slingshot Arrows (yellow) - Even though you can trade off of them, these arrows work mostly as a confirmation & caution tool. If an inverse slingshot arrow is plotted during a squeeze that means caution = you should wait because momentum is not on your side thus there there is a quite high probability that the squeeze can fire the other direction.
Squeeze Dots Trigger:
Represents the number of red dots (squeeze) after which the arrows should plot. Default = 5 (only after 5 red dots, arrows will appear), some traders like to set it on 3 or even 1.
Tips & Tricks:
1.Breakout or Bailout Mentality
- The big advantage of the arrows is the fact that they either work straight away or they don't. This is where you can apply the breakout or bailout mentality and really focus exclusively on the breakout part of the whole squeeze move. You can minimize the risk by putting mental stops just a few points below the last low of the candle where the arrows appeared. That way you can be stopped out even during the squeeze = won't hurt as much as when the squeeze fire the opposite direction. Reward may be the same but the risk is lower.
2. Yellow Flags
- Use the slingshot arrows as a caution tool. Even if all your squeeze criteria are met. Yellow inverse arrow = caution (wait for the true momentum change). Once the slingshot arrow appears in the conext of the trend, you are good to go.
3. Last Arrow Rule
- Sometimes you will see a lot of arrows during the longer squeezes. This is where the last arrow rule come in handy. The last arrow you see on chart can be canceled anytime by a new one. The last arrow is the valid one!
Hope you can squeeze from these squeeze arrows as much as there is to squeeze so you can finally trade the squeeze with ease.
Hope it helps.

On Balance Volume MomentumA combination of "On Balance Volume (OBV)" and "Volume Oscillator".
"OBV Momentum" is a trend momentum indicator, that can be used to identify strong trends and also trend changes based on volume.
High positive values indicate strong volume on the buy side, high negative values indicate strong volume on the sell side.
An increasing OBV momentum indicates a strengthening buy trend or a weakening sell trend,
decreasing OBV Momentum indicates a strengthening sell trend or weakening buy trend.
OBV Momentum is calculated by comparing a short vs. a long moving average and plotting the difference in volume.
OBV Momentum metric is absolute volume.

Accelerating Dual Momentum ScoreThis is a score metric used by the Accelerating Dual Momentum strategy.
According to the website you referenced when you created, the strategy is as follows:
Strategy Rules
This strategy allocates 100% of of the portfolio to one asset each month.
1. On the last trading day of each month, calculate the “momentum score” for the S&P 500 ( SPY ) and the international small cap equities (SCZ). The momentum score is the average of the 1, 3, and 6-month total return for each asset.
2. If the momentum score of SCZ > SPY and is greater than 0, invest in SCZ.
3. If the momentum score of SPY > SCZ and is greater than 0, invest in SPY .
4. If neither momentum score is greater than 0, calculate the 1-month total return for long-term US Treasuries ( TLT ) and US TIPS (TIP). Invest in whichever has the higher return.
Source: portfoliodb.co

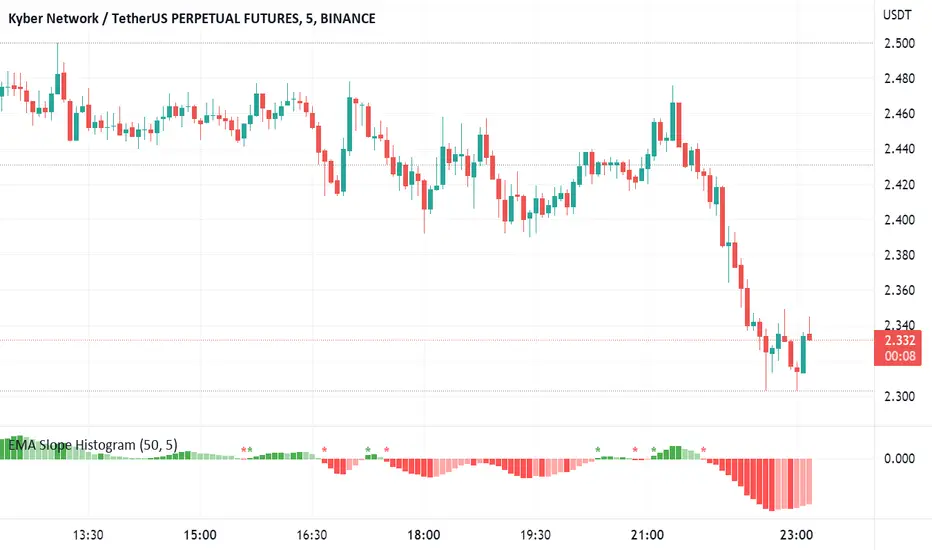
EMA Slope HistogramThe script shows change in a single EMA over a specified period as a histogram. The period of EMA as well as Change period can be specified. Moreover, it also shows change in direction of EMA. The change can be negative for a downward trend and positive for an upward trend.
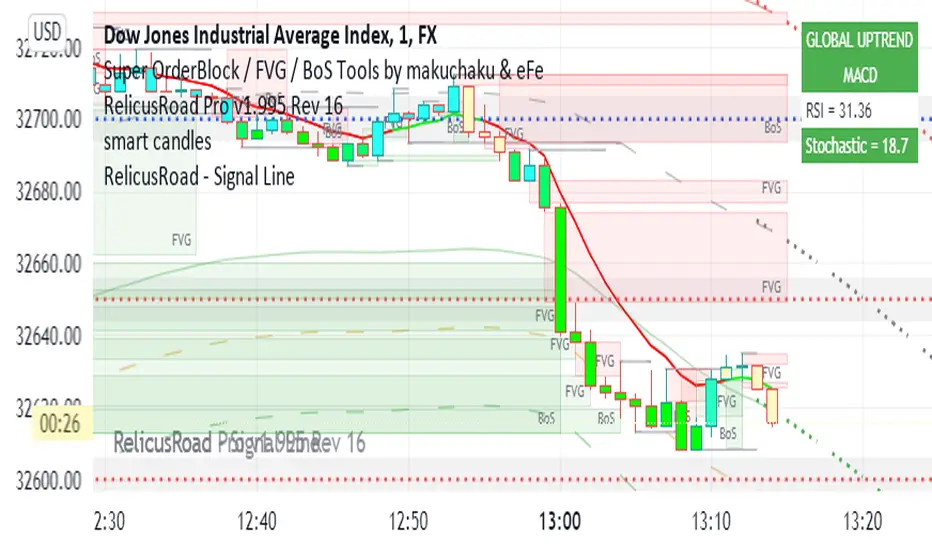
RelicusRoad - Signal LineWhen you have charts full of too many indicators, it can mess up with your analysis and cause analysis paralysis. Use RelicusRoad Signal Line to simply your charts with a beautiful color changing moving average line as per the strategies selected.
4 different strategies to choose from:
1) MACD
2) PMACD (Price Action + MACD)
3) Parabolic SAR
4) Momentum
GREEN: BUY ZONE
RED: SELL ZONE
FUNCTIONS OVERVIEW
MACD: Moving average convergence divergence ( MACD ) is a trend-following momentum indicator that shows the relationship between two moving averages of a security’s price. The MACD is calculated by subtracting the 26-period exponential moving average ( EMA ) from the 12-period EMA .
The result of that calculation is the MACD line. A 9 EMA of the MACD called the "signal line," is then plotted on top of the MACD line, which can function as a trigger for buy and sell signals. Traders may buy the security when the MACD crosses above its signal line and sell—or short—the security when the MACD crosses below the signal line. Moving average convergence divergence ( MACD ) indicators can be interpreted in several ways, but the more common methods are crossovers, divergences, and rapid rises/falls.
Moving average convergence divergence ( MACD ) is calculated by subtracting the 26-period exponential moving average ( EMA ) from the 12-period EMA .
MACD triggers technical signals when it crosses above (to buy) or below (to sell) its signal line.
The speed of crossovers is also taken as a signal of a market is overbought or oversold.
MACD helps investors understand whether the bullish or bearish movement in the price is strengthening or weakening.
PMACD: It's an improvement to MACD that you can use the Red/Green indications to make better decisions.
Parabolic SAR: The parabolic SAR indicator, developed by J. Wells Wilder, is used by traders to determine trend direction and potential reversals in price. The indicator uses a trailing stop and reverse method called "SAR," or stop and reverse, to identify suitable exit and entry points. Traders also refer to the indicator as the parabolic stop and reverse , parabolic SAR , or PSAR.
The parabolic SAR indicator appears on a chart as a series of dots, either above or below an asset's price, depending on the direction the price is moving. A dot is placed below the price when it is trending upward, and above the price when it is trending downward.
The parabolic SAR (stop and reverse) indicator is used by technical traders to spot trends and reversals.
The indicator utilizes a system of dots superimposed onto a price chart.
A reversal occurs when these dots flip, but a reversal signal in the SAR does not necessarily mean a reversal in the price. A PSAR reversal only means that the price and indicator have crossed.
Momentum: On paper, momentum investing seems less like an investing strategy and more like a knee-jerk reaction to market information. The idea of selling losers and buying winners is seductive, but it flies in the face of the tried and true Wall Street adage, "buy low, sell high."
Momentum investing is a trading strategy in which investors buy securities that are rising and sell them when they look to have peaked.
The goal is to work with volatility by finding buying opportunities in short-term uptrends and then sell when the securities start to lose momentum.
Then, the investor takes the cash and looks for the next short-term uptrend, or buying opportunity, and repeats the process.
Skilled traders understand when to enter into a position, how long to hold it for, and when to exit; they can also react to short-term, news-driven spikes or selloffs.
Risks of momentum trading include moving into a position too early, closing out too late, and getting distracted and missing key trends and technical deviations.
TMA-LegacyThis is a script based on the original TMA- RSI Divergence indicator by PhoenixBinary.
The Phoenix Binary community and the TMA community built this version to be public code for the community for further use and revision after the reported passing of Phoenix Binary (The community extends our condolences to Phoenix's family.
The intended uses are the same as the original but some calculations are different and may not act or signal the same as the original.
Description of the indicator from original posting.
This indicator was inspired by Arty and Christy .
█ COMPONENTS
Here is a brief overview of the indicator from the original posting:
1 — RSI Divergence
Arty uses the RSI divergence as a tool to find entry points and possible reversals. He doesn't use the traditional overbought/oversold. He uses a 50 line. This indicator includes a 50 line and a floating 50 line.
The floating 50 line is a multi-timeframe smoothed moving average . Price is not linear, therefore, your 50 line shouldn't be either.
The RSI line is using a dynamic color algo that shows current control of the market as well as possible turning points in the market.
2 — Smoothed RSI Divergence
The Smoothed RSI Divergence is a slower RSI with different calculations to smooth out the RSI line. This gives a different perspective of price action and more of a long term perspective of the trend. When crosses of the floating 50 line up with the traditional RSI crossing floating 50.
3 — Momentum Divergence
This one will take a little bit of time to master. But, once you master this, and combined with the other two, damn these entries get downright lethal!

[TTI] StockBee labelsHISTORY AND CREDITS –––––––––––––––––––––––––––––––––––––––––––––––––––––––
Since I am getting a big interest in the StockBee's TI65 indicator, I decided to make another one which covers the rest of the things I have seen on his chart.
WHAT IT DOES ––––––––––––––––––––––––––––––––––––––––––––––––––––––––––––––
👉 StockBee Labels = these include important measurements that you can have on the chart
— V = Traded Volume Today
— $ = Dollar Net Change Today
— Stop = Stop which is calculated by Low + 1/2 Trading Range
— TI65 = Absolute momentum value
— LD1 = Yesterday's Low
— TC = Todays True Closing Range
— MDR = Modified Double Trouble
Hover over the cells to get additional information
👉 Unusual Volume Bubble = these indicate when an unusually big volume has occurred
👉 Daily Bull/Bear Flags = Technical formation for Bull and Bear Flags
HOW TO USE IT –––––––––––––––––––––––––––––––––––––––––––––––––––––––––––––
👉 StockBee Labels = can be used to determine the momentum strength, stop losses and general movement of stock. They are really good utility labels
👉 Unusual Volume Bars = Indicate significant times in the development of the tickers price movement. These signal extra caution as can be a begining of a big move
👉 Daily Bull and Bear Flags are technical patterns. If you look to trade Bull Flags make sure there is a preceding trend, consolidation channel and good volume pattern beforehand

Squeeze M + ADX + TTM (Trading Latino & John Carter) by [Rolgui]About this indicator:
This indicator aims to combine two good performing strategies, which can be used separately or together, mainly for investment positions, although it can also be used for intraday trading.
Strategy 1) Squeeze Oscillator and Average Directional Index:
This strategy is taught by Jaime Aibsai, which determines market entries based on reading the direction of the price movement (Directionality of the Oscillator) along with the strength of the Oscillator (Slope of the ADX).
Both tools are configured according to Jaime Abisai's strategy, by default (note that point 23 of the ADX is represented by point 0 on the panel, to make reading easier, its interpretation is not affected). Anyway you can adjust the input data according to your interest.
*You can see this setting in the first panel.
Strategy 2) Squeeze Momentum and Trade The Market Waves:
This strategy can be consulted either in John F. Carter's books or on his website.
This market reading is based on Price Volatility (Bollinger Bands and Keltner Channels interaction) and its Trend (Exponential Moving Averages), showing entries at times when price volatility is low and taking filtering active trend using T.T.M. Waves.
To configure the indicator in the same way that Carter does, it would be enough to turn off the ADX, turn on the Squeeze Momentum signals along with the T.T.M. Waves, and importantly, change the Linear Momentum value to 12 (this configuration can be found in his book).
*You can see this setting in the second panel.
Why this indicator?
I've added and removed the above flags as I needed to query them (which became tedious for me). The main objective of having merged them into one is to make their reading more agile and comfortable and thus improve the decision-making capacity of the trader who wishes to use them.
Credits and Acknowledgments:
I would like to give credits to other authors, for the sections of code that I have used to make this technical indicator. Thanks to @LazyBear, @matetaronna, @jombie and @joren for contributing to the community and keeping their code open. It is priceless!
Feel free to combine and practice your trading with both strategies, personally, they improved my profitability and this is why I recommend researching more about them. I've been using it for crypto investing, let me know if it's worth for you on stock market!
If you have any questions or suggestions you can leave it in the comments!
Greetings!

[TTI] ZVR Watchlist––––History & Credit ––––––––––––––––––––––––––––––––––––––––––––––––––––––––––––––
This indicator/screener is inspired by the methodology of a great momentum master - Dan Zanger. Dan holds the world record for higher % gain in a 12month period, which was achieved in 1998 and has not been broken since. One of the secrets he has shared with the world is his famous Zanger Volume Ratio (ZVR), to which his attributes great part of his success.
–––––What it does –––––––––––––––––––––––––––––––––––––––––––––––––––––––––––––––
The script allows you to monitor your watchlist for the most important momentum indicators on an intraday basis in order to maximise your chance of jumping in the right time.
1️⃣ ZVR - pre breakout indicator
ZVR measures unusual momentum at a given time of the day.
Example
Imagine it is the first hour of the trading session and you get AAPL with a daily volume (up to that time) of 2mn shares. Is this normal or not? If you just compare it to the average volume you will be making a logical mistake, since you have 7more hours for volume to reach the "average" level. Henceforth, average volume should be compared on an end of day basis. However, the ZVR looks at the current intraday cumulative volume at any particular time of day, and compare that to the average cumulative volume that has usually traded by that time of day in the past.
The 4 colors are 4 types:
🔴 (RED) — Volume is over 200% of the usual cumulative intraday volume for that day
🟣 (PURPLE) — Volume is between 150% and 200% of the usual cumulative intraday volume for that day
💓 (PINK) — Volume is between 100% and 150% of the usual cumulative intraday volume for that day
🟠 (ORANGE) — Volume is between 50% and 100% of the usual cumulative intraday volume for that day
🌚 (GRAY) — Volume is under 50% of the usual cumulative intraday volume for that day
2️⃣ SQN
The SQN is defined by the late Market Wizard Dr. Van Tharp: "A measure of a market’s movement through an application of the System Quality Number calculation. To calculate, the daily changes from close to close measured in percentage terms are averaged and the standard deviation is calculated. Plugged into the SQN formula, those values and the number of days (N) provide the market SQN score."
👉 Super Bullish - denoted by SB and lime color
👉 Bullish - denoted by B and green color
👉 Neutral - denoted by N and cyan/aqua color
👉 Bearish - denoted by Br and dark red color
👉 Super Bearish - denoted by SBr and light red color
–––––How to use it –––––––––––––––––––––––––––––––––––––––––––––––––––––––––––––––
I use the indicator very much like a watchlist. I put it on a secondary chart and load up all the stocks that I have identified as a buyable. I then wait to get signs of breakout. My favourites are stocks which are in SuperBullish trend (SQN) and starting to show RED ZVR in the beginning of the day. Often these are very strong names that show institutional buying. I purchase close to pivot point and hold for a swing trade. If the stock advances too fast 5-7% on the day, I take some off into strength.
Suggested use for this indicator is to combine with any volatility contraction methodology. Some examples include the TTM Squeeze, Squeeze Pro or my personal favorite Mark Minervini's Volatility Contraction Pattern (VCP).
Look for stocks in a long term uptrend (we have another indicator for Stage 2 identification).

Momentum 2.0 [AstrideUnicorn]Momentum 2.0 is a normalized Momentum oscillator with a moving base-level. The oscillator value is normalized by its standard deviation, similar to the z-score technique. Instead of the zero level, the indicator uses the base-level calculated as the inverted long-term average value of the oscillator. Similar to the zero-level crossing signal used for the Momentum oscillator, our oscillator calculates the base level crossing signal.
The moving base-level helps to reduce the number of false signals. In an uptrend the base-level is below zero, in a downtrend it is above it. This allows us to take into account the trend stability effect. In this case, to form a reversal signal, the oscillator must cross a lower value in an uptrend and a higher value in a downtrend.
HOW TO USE
When the oscillator crosses above the base-level, it gives a bullish signal, when below it gives a bearish signal. The signals are displayed as green and red labels, respectively.
The color of the histogram shows the current direction of the price momentum. Green indicates an upward move and red indicates a downward move. The blue line represents the base-level.
SETTINGS
Oscillator Period - determines the period of the Momentum oscillator
Base Level Period - determines the period used for long-term averaging when calculating the base-level and normalizing the oscillator
