QuickSilver Intraday using RSIThis is a simple intraday strategy using very basic intraday super indicators - RSI & VWAP for working on Stocks . You can modify the values on the stock and see what are your best picks. Comment below if you found something with good returns
Strategy:
Indicators used :
The Relative Strength Index (RSI) is one of the most popular and widely used momentum oscillators.The values of the RSI oscillator, typically measured over a 14-day period, fluctuate between zero and 100. The Relative Strength Index indicates oversold market conditions when below 30 and overbought market conditions when above 70
VWAP identifies the true average price of a stock by factoring the volume of transactions at a specific price point and not based on the closing price. VWAP can add more value than your standard 10, 50, or 200 moving average indicators because VWAP reacts to price movements based on the volume during a given period.
Buying happens at VWAP Breakouts which is then validated with RSI to check for overbought & oversold conditions.
Aggressive trade stop can be employed by using the % for long and shorts in the strategy.
Usage & Best setting :
Choose a good volatile stock and a time frame - 10m.
RSI : 9
Overbought & Oversold - can be varied as per user
There is stop loss and take profit that can be used to optimise your trade
Extending this to,
In general guidelines for RSI :
Short-term intraday traders (day trading) often use lower settings with periods in the range of 9-11.
Medium-term swing traders frequently use the default period setting of 14.
Longer-term position traders often set it at a higher period, in the range of 20-30.
The template also includes daily square off based on your time.
Oscillatori

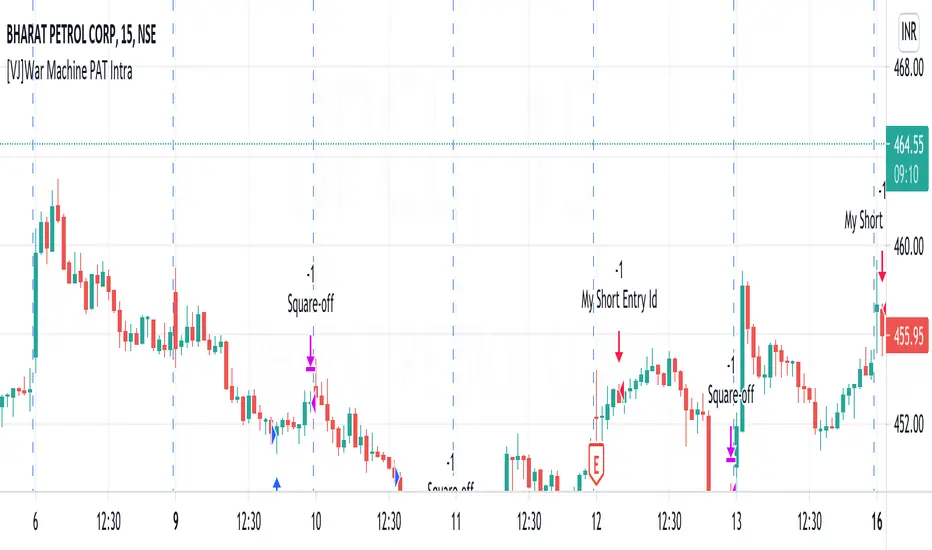
[VJ]War Machine PAT IntraThis is a simple intraday strategy for working on Stocks . You can modify the values on the stock and see what are your best picks. Comment below if you found something with good returns
Strategy:
Indicators used :
The Choppiness Index is designed to determine whether the market is choppy or trading sideways, or not choppy and trading within a trend in either direction. Using a scale from 1 - 100, the market is considered to be choppy as values near 100 (over 61.80) and trending when values are lower than 38.20)
The Money Flow Index (MFI) is a momentum indicator that measures the flow of money into and out of a security over a specified period of time. It is related to the Relative Strength Index (RSI) but incorporates volume, whereas the RSI only considers price. The MFI is calculated by accumulating positive and negative Money Flow values (see Money Flow), then creating a Money Ratio. The Money Ratio is then normalized into the MFI oscillator form.
Using the combination of CI (trend factor as constant) and varying MFI, we can buy/sell when conditions are met
Buying with MFI
1. MFI drops below 20 and enters inside oversold zone.
2. MFI bounces back above 20.
3. MFI pulls back but remains above 20.
4. A MFI break out above its previous high is a good buy signal.
Selling with MFI
1. MFI rises above 80 and enters inside overbought zone.
2. MFI drops back below 80.
3. MFI rises slightly but remains below 80.
4. MFI drops lower than its previous low is a signal to short sell or profit booking
Usage & Best setting :
Choose a good volatile stock and a time frame - 5m.
Trending factor : 50
Overbought & Oversold - can be varied as per user
There is stop loss and take profit that can be used to optimise your trade
The template also includes daily square off based on your time.
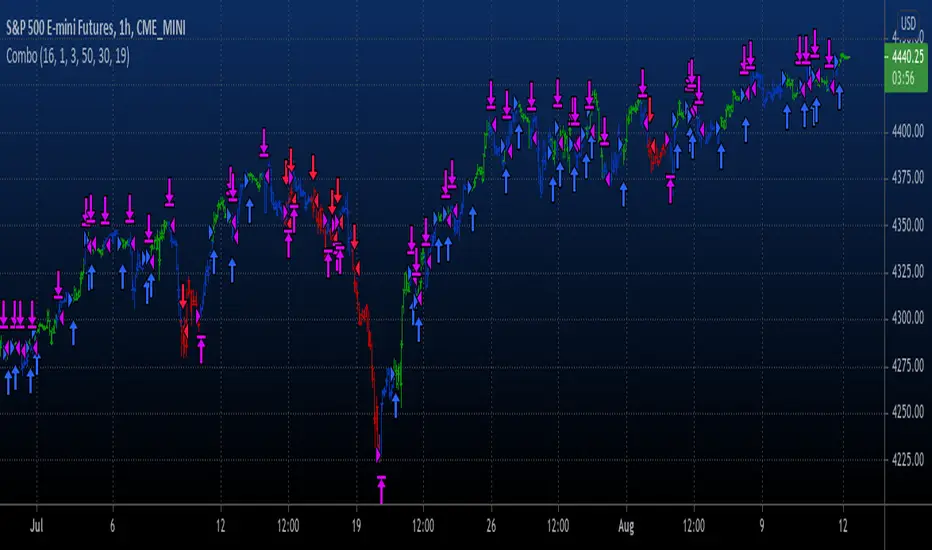
Combo Backtest 123 Reversal & RSIThis is combo strategies for get a cumulative signal.
First strategy
This System was created from the Book "How I Tripled My Money In The
Futures Market" by Ulf Jensen, Page 183. This is reverse type of strategies.
The strategy buys at market, if close price is higher than the previous close
during 2 days and the meaning of 9-days Stochastic Slow Oscillator is lower than 50.
The strategy sells at market, if close price is lower than the previous close price
during 2 days and the meaning of 9-days Stochastic Fast Oscillator is higher than 50.
Second strategy
The RSI is a very popular indicator that follows price activity.
It calculates an average of the positive net changes, and an average
of the negative net changes in the most recent bars, and it determines
the ratio between these averages. The result is expressed as a number
between 0 and 100. Commonly it is said that if the RSI has a low value,
for example 30 or under, the symbol is oversold. And if the RSI has a
high value, 70 for example, the symbol is overbought.
WARNING:
- For purpose educate only
- This script to change bars colors.

Aggresive Scalper/Swing Crypto StrategyThis is a simple yet very efficient scalper long strategy adapted for low timeframes for crypto. Can also be used with bigger timeframes as a swinger.
Its main components are:
Price oscillator swing
Vortex
Risk management for TP/SL
Rules for entry
We calculate the difference between the oscillator from the lowest low and the highest high. If the difference is positive, its a long potential. If its negative we exit from the long trade.
At the same time we check that the we have a crossover between the VIP vortex with the VIM vortex part.
Lastly we check that the current candle is bigger the second previous high.
Rules for exit
If we reach the take profit or the stop loss.
If we have a negative difference betwee LL and HH and VIP vortex crossunder with VIM vortex .
In this example I aimed for a 1:10 risk reward ratio, meaing that for every dollar lost, we will gain 10 when we win. Thus having a 10% minimum win rate will give us a profit over many trades.
If you have any questions, let me know !

Combo Backtest 123 Reversal & Awesome Oscillator (AO) This is combo strategies for get a cumulative signal.
First strategy
This System was created from the Book "How I Tripled My Money In The
Futures Market" by Ulf Jensen, Page 183. This is reverse type of strategies.
The strategy buys at market, if close price is higher than the previous close
during 2 days and the meaning of 9-days Stochastic Slow Oscillator is lower than 50.
The strategy sells at market, if close price is lower than the previous close price
during 2 days and the meaning of 9-days Stochastic Fast Oscillator is higher than 50.
Second strategy
This indicator is based on Bill Williams` recommendations from his book
"New Trading Dimensions". We recommend this book to you as most useful reading.
The wisdom, technical expertise, and skillful teaching style of Williams make
it a truly revolutionary-level source. A must-have new book for stock and
commodity traders.
The 1st 2 chapters are somewhat of ramble where the author describes the
"metaphysics" of trading. Still some good ideas are offered. The book references
chaos theory, and leaves it up to the reader to believe whether "supercomputers"
were used in formulating the various trading methods (the author wants to come across
as an applied mathemetician, but he sure looks like a stock trader). There isn't any
obvious connection with Chaos Theory - despite of the weak link between the title and
content, the trading methodologies do work. Most readers think the author's systems to
be a perfect filter and trigger for a short term trading system. He states a goal of
10%/month, but when these filters & axioms are correctly combined with a good momentum
system, much more is a probable result.
There's better written & more informative books out there for less money, but this author
does have the "Holy Grail" of stock trading. A set of filters, axioms, and methods which are
the "missing link" for any trading system which is based upon conventional indicators.
This indicator plots the oscillator as a histogram where periods fit for buying are marked
as blue, and periods fit for selling as red. If the current value of AC (Awesome Oscillator)
is over the previous, the period is deemed fit for buying and the indicator is marked blue.
If the AC values is not over the previous, the period is deemed fir for selling and the indicator
is marked red.
WARNING:
- For purpose educate only
- This script to change bars colors.
Ichimoku with MACD/ CMF/ TSIThis is a very powerful trend strategy designed for markets such as stocks market , stock index and crypto.
For time frames I found out that 1h seems to do the trick.
Components:
Ichimoku full pack
MACD histogram
CMF oscillator
TSI oscillator
Rules for entry
Long :
For Ichimoku:Tenkan part of cloud is bigger than kijun, Chikou is above 0 , close of a candle is above the Senkou
MACD histogram is above 0
CMF oscillator is positive and bigger than 0.1
TSI oscillator is above 0
Short:
For Ichimoku:Tenkan part of cloud is smaller than kijun, Chikou is below 0 , close of a candle is belowthe Senkou
MACD histogram is below 0
CMF oscillator is negative and below -0.1
TSI oscillator is below 0
Rules for exit
This strategy does not have any risk management inside. Instead it exits whenver it receives an opposite signal form the original one used for entry.
If you have any questions let me know !

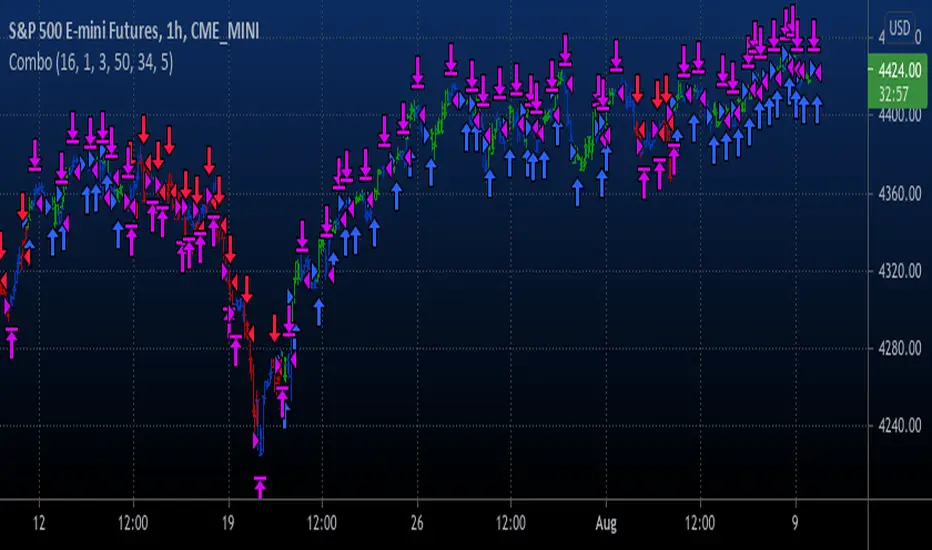
Combo Backtest 123 Reversal & Awesome Oscillator (AC) This is combo strategies for get a cumulative signal.
First strategy
This System was created from the Book "How I Tripled My Money In The
Futures Market" by Ulf Jensen, Page 183. This is reverse type of strategies.
The strategy buys at market, if close price is higher than the previous close
during 2 days and the meaning of 9-days Stochastic Slow Oscillator is lower than 50.
The strategy sells at market, if close price is lower than the previous close price
during 2 days and the meaning of 9-days Stochastic Fast Oscillator is higher than 50.
Second strategy
This indicator plots the oscillator as a histogram where blue denotes
periods suited for buying and red . for selling. If the current value
of AO (Awesome Oscillator) is above previous, the period is considered
suited for buying and the period is marked blue. If the AO value is not
above previous, the period is considered suited for selling and the
indicator marks it as red.
WARNING:
- For purpose educate only
- This script to change bars colors.
Extremely high win rate FOREX swing strategyTHis is a very simple yet extremely efficient FOREX strategy .
In general it tends to work the best against NZD and AUD pairs, however other major pairs and crosses can work as well.
It's made of a time management, together with MACD , moving average , a price action rule and a risk management.
THe logic behind is the next one :
For LONG:
We have 3 ascending candles.
Histogram of MACD is positive.
Last close of a candle is was above moving average.
If all those previous condition happened before 17/18 UTC time depending if its summer time or not, we enter the trade.
For Short:
We have 3 descending candles.
Histogram of MACD is negative.
Last close of a candle is was below moving average.
If all those previous condition happened before 17/18 UTC time depending if its summer time or not, we enter the trade.
RIsk management
For risk management, since we aim to have a 95%+ win rate, we aim to have a 5:1 or 10:1 risk to reward ratio. Meaning that for each $ we can win, we can lose 5-10$.
THats why I recommend to be extremely careful when playing with leverage with this strategy.

Full Forex scalper StrategyTHis is a FOREX scalping system that can be optimized with almost all majors and crosses pairs.
Its made of multiple elements such as :
MACD
Stochastic RSI
Fast VW moving average
Slow VW moving average
Time management( forex sessions as inputs)
Rules for entry
Long
Last 2 MACD values were ascending, fast moving average is below moving average and stochastic RSI is below 30 level. At the same time we are either into London or NY session.
Short
Last 2 MACD values were descending, fast moving average is above moving average and stochastic RSI is above 70 level. At the same time we are either into London or NY
Rules for exit
WE have 2 exit possibilities: we can exit either at the end of NY/London Session or based on a TP/SL risk management calculating % in movement.
If you have any questions let me know !

Combo Backtest 123 Reversal & 2/20 Exponential MA This is combo strategies for get a cumulative signal.
First strategy
This System was created from the Book "How I Tripled My Money In The
Futures Market" by Ulf Jensen, Page 183. This is reverse type of strategies.
The strategy buys at market, if close price is higher than the previous close
during 2 days and the meaning of 9-days Stochastic Slow Oscillator is lower than 50.
The strategy sells at market, if close price is lower than the previous close price
during 2 days and the meaning of 9-days Stochastic Fast Oscillator is higher than 50.
Second strategy
This indicator plots 2/20 exponential moving average. For the Mov
Avg X 2/20 Indicator, the EMA bar will be painted when the Alert criteria is met.
WARNING:
- For purpose educate only
- This script to change bars colors.

Crypto RSI with RVI StrategyThis is a long only strategy adapted for crypto market.
Its idea is to take the most juice out of a long trend and cut the losses as soon as possible.
For this , its components are RSI with a very big length - 100 or 200 preferably and RVI.
Rules for entry
If RVI is in the buy zone and we have a crossover from RSI with the overbought level.
Rules for exit
With change condition : If RVI is in the sell zone and we have a cross under from RSI with the oversold level.
With stop loss : we have a SL based on movement in % of the price, recommendable between 5-10%.
If you have any questions let me know !

Ichimoku + RSI Crypto trending strategyThis is a crypto trending strategy designed for big timeframes such as 3-4h+.
Its components are:
RSI
ICHIMOKU full pack
Heikin Ashi candles for logic calculation inside
Rules for entry.
For long : we have a long cross condition on ichimoku and price is above the ichimoku lines, and at the same time RSI value is > 50.
For long : we have a short cross condition on ichimoku and price is below the ichimoku lines, and at the same time RSI value is < 50.
Rules for exit
We exit whenever we receive an opposite signal of the initial entry.
SInce this strategy is using no risk management inside, I recommend to be careful with it .
If you have any questions, let me know !

BTC Sentiment analysis RSI 2xEMAThis is a CRYPTO correlation strategy, which is using BTC sentiment with BITFINEX long and short ratios.
WIth them we are making from one side 2 RSI, one for long and another for short. And from another side, we are going to make multiple EMA's, using the ratios for long and short.
Rules for entry
For this scenario I created a long only strategy.
The long entry condition is : we have a crossover of the rsi long ratio with rsi short ratio and long ratio from BITFINEX is above the long EMA and short ratio from BITFINEX is below short EMA.
We exit when we get the opposite condition, in this case we have a crossunder of the rsi long ratio with rsi short ratio and long ratio from BITFINEX is below the long EMA and short ratio from BITFINEX is above short EMA.
If you have any questions, let me know !

3 RSI 6sma/ema ribbon crypto strategyThis is a very efficient swing trading strategy designed for crypto long timeframes like 2h+.
Initially we have 3 RSI .
AFter that we use them as source for 6 SMA/EMA for each RSI, 5, 30, 50, 70, 90, 100. With those we create a ribbon that we are going to use in order to check the direction of the trend.
Rules for entry:
For long : if either all the SMA/EMA's from the 2nd RSI are telling us to go long, or all the all SMA/EMA's from the 3rd rsi are telling us to go long F
For short : if either all the SMA/EMA's from the 2nd RSI are telling us to go short, or all the all SMA/EMA's from the 3rd rsi are telling us to go short
We exit when we get an opposite condition than the entry one.
Caution: this strategy has no risk management inside, so use it with caution. If you have any questions , let me know !

Forex scalper 2xEMA + SRSI + MACDThis is a forex scalping strategy designed for the most liquid pairs, like major forex pairs.
Its made of
1 EMA 50
1 EMA 100
Stochastic RSI
MACD
Rules
For long :close of the candle is above moving average 50, moving average 50> moving average 100, macd histogram is positive and cross over of stochastic rsi with the oversold level.
For short :close of the candle is below moving average 50, moving average 50 < moving average 100, macd histogram is negative and cross under of stochastic rsi with the overbought level.
Exit
For exit we have take profit and stop loss using fixed pip points.
For this example on EURUSD we use 20 pips for both tp and sl
IF you have any questions let me know !

Combo Backtest 123 Reversal & Stochastic RSIThis is combo strategies for get a cumulative signal.
First strategy
This System was created from the Book "How I Tripled My Money In The
Futures Market" by Ulf Jensen, Page 183. This is reverse type of strategies.
The strategy buys at market, if close price is higher than the previous close
during 2 days and the meaning of 9-days Stochastic Slow Oscillator is lower than 50.
The strategy sells at market, if close price is lower than the previous close price
during 2 days and the meaning of 9-days Stochastic Fast Oscillator is higher than 50.
Second strategy
This strategy used to calculate the Stochastic RSI
WARNING:
- For purpose educate only
- This script to change bars colors.
[Advanced] Hilega-Milega IndicatorThis Indicator Name is Hilega Milega, and the original Idea given by Nitish Kumar, I just coded it and add some signals for backtesting.
it works on RSI + WMA and EMA plotted.
Default Values Used :
RSI = 9
WMA = 21
EMA = 3
But i added some extra, now everyone can change the Type of WMA and EMA, also SMA for trend confirmation,
How it works ??
Buy : When RSI crossover WMA or any Type of Moving Average you choose,
Sell : When RSI crossunder WMA or any Type of Moving Average you choose,
also:
Buy : When EMA crossover WMA or any Type of Moving Average you choose,
Sell : When EMA crossunder WMA or any Type of Moving Average you choose,
also:
Buy : When RSI + EMA crossover WMA or any Type of Moving Average you choose at the Same time,
Sell : When RSI + EMA crossunder WMA or any Type of Moving Average you choose at the Same time,
and Much More...! hope so you like it,

Delayed RSI StrategyThis strategy uses a 21 period RSI with an overbought (RSI indicator
is greater than) level of 60 (user defined) to determines long entries and an oversold
(RSI indicator is less than) level of 40 (user defined) for shorts. It introduces a bar delay that starts
counting when the RSI < Oversold or RSI > Overbought conditions are true, delaying the entry with
the amount of bars determined by the user. The trading logic can be reversed, which seems to work better.

HYE Combo Market [Strategy] (Vwap Mean Reversion + Trend Hunter)In this strategy, I used a combination of trend hunter and vwap mean reversion strategies that I published before.
Trend Hunter Strategy:
Mean Reversion Vwap Strategy:
The results are quite impressive, especially for bitcoin.
While the hodl return for bitcoin was 13419%, the strategy's return in the same period was about 5 times (65000%) of this.
s3.tradingview.com
In this combo strategy, I made some changes to the original settings of the strategies used together and added some more new features.
Trend Hunter Strategy Settings: (Original / Combo)
- Slow Tenkansen Period : 9 / 9
- Slow Kijunsen Period : 26 / 13
- Fast Tenkansen Period : 5 / 3
- Fast Kijunsen Period : 13 / 7
- BB Length : 20 / 20
- BB Stdev : 2 / 2
- TSV Length : 13 / 20
- TSV Ema Length : 7 / 7
* I also added a "vidya moving average" to be used as a confirmation tool to open a long position. (Candle close must be above the vidya line.)
Vwap Mean Reversion Strategy Settings: (Original / Combo)
- Small Vwap : 2 / 8
- Big Vwap : 5 / 10
- Percent Below to Buy : 3 / 2
- RSI Period : 2 / 2
- RSI Ema Period : 5 / 5
- Maximum RSI Level for Buy : 30
* I also added a "mean vwap line" to be used for exits in this part of the strategy. In the original version, when small vwap crossovers big vwap, we close the position, but in this strategy we will wait for the close above the mean vwap.
TIPS AND WARNINGS
1-) The standard settings of this combo strategy is designed and tested with daily timeframe. For lower timeframes, you should change the strategy settings and find the best value for yourself.
2-) Only the mean vwap line is displayed on the graph. For a detailed view, you can delete the "//" marks from the plot codes in the strategy code.
3-) This is a strategy for educational and experimental purposes. It cannot be considered as investment advice. You should be careful and make your own risk assessment when opening real market trades using this strategy.
________________________________________________________
Bu stratejide, daha önce yayınladığım trend avcısı ve vwap ortalamaya geri dönüş stratejilerinin bir kombinasyonunu kullandım.
Sonuçlar özellikle bitcoin için oldukça etkileyici.
Bitcoin için hodl getirisi %13419 iken, stratejinin aynı dönemdeki getirisi bunun yaklaşık 5 katı (%65000) idi.
Bu kombo stratejide, birlikte kullanılan stratejilerin orijinal ayarlarında bazı değişiklikler yaptım ve bazı yeni özellikler ekledim.
Trend Avcısı Strateji Ayarları: (Orijinal / Combo)
- Yavaş Tenkansen Periyodu : 9 / 9
- Yavaş Kijunsen Periyodu : 26 / 13
- Hızlı Tenkansen Periyodu : 5 / 3
- Hızlı Kijunsen Periyodu : 13 / 7
- BB Uzunluğu : 20 / 20
- BB Standart Sapması : 2 / 2
- TSV Uzunluğu : 13 / 20
- TSV Ema Uzunluğu : 7 / 7
* Ayrıca long pozisyon açmak için onay aracı olarak kullanılmak üzere "vidya hareketli ortalama" ekledim. (Mum kapanışı vidya çizgisinin üzerinde olmalıdır.)
Vwap Ortalamaya Dönüş Stratejisi Ayarları: (Orijinal / Combo)
- Küçük Vwap : 2 / 8
- Büyük Vwap : 5 / 10
- Alış İçin Gerekli Fark Oranı : 3 / 2
- RSI Periyodu : 2 / 2
- RSI Ema Periyodu: 5 / 5
- Alış için gerekli maksimum RSI seviyesi : 30
* Stratejinin bu bölümünde pozisyondan çıkışlar için kullanılacak bir "ortalama vwap çizgisi" de ekledim. Orijinal versiyonda, küçük vwap, büyük vwap'ı yukarı kestiğinde pozisyonu kapatıyoruz, ancak bu stratejide, ortalama vwap'ın üzerindeki kapanışı bekleyeceğiz.
İPUÇLARI VE UYARILAR
1-) Bu birleşik stratejinin standart ayarları, günlük zaman dilimi ile tasarlanmış ve test edilmiştir. Daha düşük zaman dilimleri için strateji ayarlarını değiştirmeli ve kendiniz için en iyi değeri bulmalısınız.
2-) Grafikte sadece ortalama vwap çizgisi görüntülenir. Ayrıntılı bir görünüm için strateji kodundaki "plot" ile başlayan satırlarda grafikte görünmesini istediğiniz özelliğin önündeki "//" işaretlerini silebilirsiniz.
3-) Eğitim ve deneysel amaçlı bir stratejidir. Yatırım tavsiyesi olarak değerlendirilemez. Bu stratejiyi kullanarak gerçek piyasa işlem açarken dikkatli olmalı ve kendi risk değerlendirmenizi yapmalısınız.

7-RSI strategyHello, I've only been trying to learn PineScript for two months on my own, here I am posting a version of the strategy for a grid bot with 20 orders, order size 5%, earlier I tried to find something similar, but could not. Perhaps others, those who, like me, are just starting to learn PineScript, will find something useful. In the process of using grid bots, I noticed that the RSI indicator is sufficient, so the strategy uses 7 RSI indicators on different timeframes, but it is not necessary to use all 7, usually 3 is enough, therefore, by default, the RSI values are set to limit so that there is no effect on the settings of others. The step between bot orders is set in the settings. The code can of course be simplified, but it's better for understanding, I think.

ADX / RSI Strategy by Trade Rush (created by SirPoggy) This is one of many new strategies coming soon which were seen on Trade Rush
This one is the ADX / RSI Strategy seen here:
https:www.youtube.com/watch?v=uSkGE0ujyn4
While the strategy has been modified slightly to use the DMI instead of the ADX, the core of the strategy is essentially the same
Long signals are generated when the RSI is above 70, close is above the 200EMA, and the ADX is above 25 (added is the plus DMI over 25 and minus DMI below 20)
Stop loss is placed below /above the 21 EMA, however, there is a deviation required to ensure price is not too close to where a stop loss would be placed.
Short signals are generated when the RSI is below 30, close is below the 200EMA, and the ADX is above 25 (added is the minus DMI over 25 and plus DMI below 20)
I do not recommend using this strategy but I have provided this code for educational purposes.
Thanks!
Let me know which strategy you'd like coded next in the comments below.

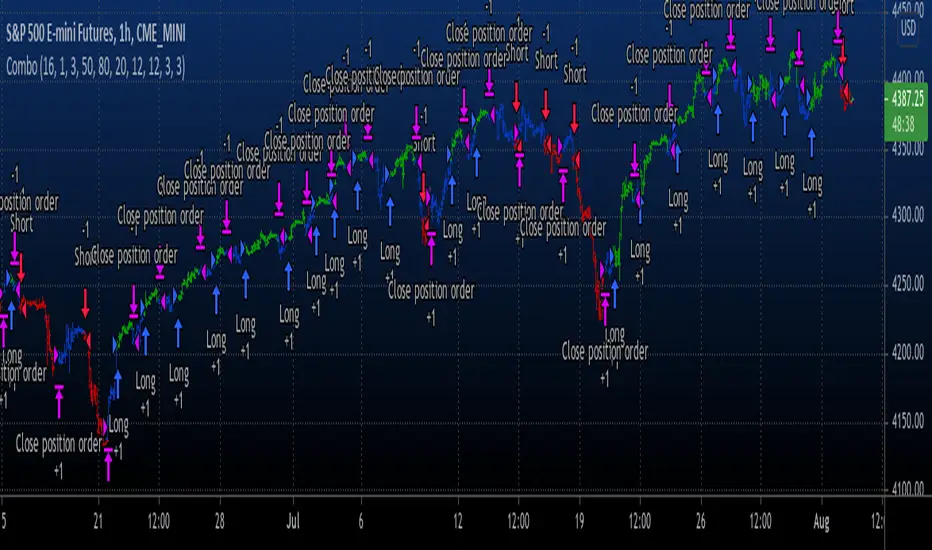
Combo Backtest 123 Reversal & Statistical Volatility This is combo strategies for get a cumulative signal.
First strategy
This System was created from the Book "How I Tripled My Money In The
Futures Market" by Ulf Jensen, Page 183. This is reverse type of strategies.
The strategy buys at market, if close price is higher than the previous close
during 2 days and the meaning of 9-days Stochastic Slow Oscillator is lower than 50.
The strategy sells at market, if close price is lower than the previous close price
during 2 days and the meaning of 9-days Stochastic Fast Oscillator is higher than 50.
Second strategy
This indicator used to calculate the statistical volatility, sometime
called historical volatility, based on the Extreme Value Method.
Please use this link to get more information about Volatility.
WARNING:
- For purpose educate only
- This script to change bars colors.

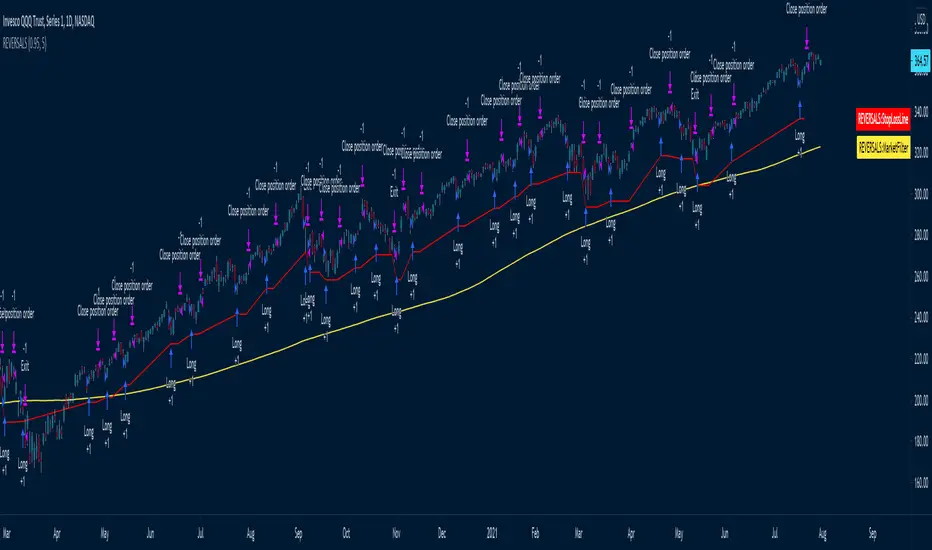
REVERSALS
The systems basically play reversals, it enters when the close is lower than its low of 5 bars ago to enter
It exits when the price is higher than the high of 5 days ago
Uses a 200 MA as a market filter, does not trade when the price is below its 200 Moving average
Uses a 5% stop, as per the red Stop Loss Line -- can be adjusted
The amount of bars it uses to look for reversals is set to 5 by default, but can be adjusted in settings.
Best to use on directional instruments where you know that the long term direction is up, for example:
TQQQ, SSO, SPX, SPY, or sector tickers -- but it would be best to include some more advanced filtering for sectors