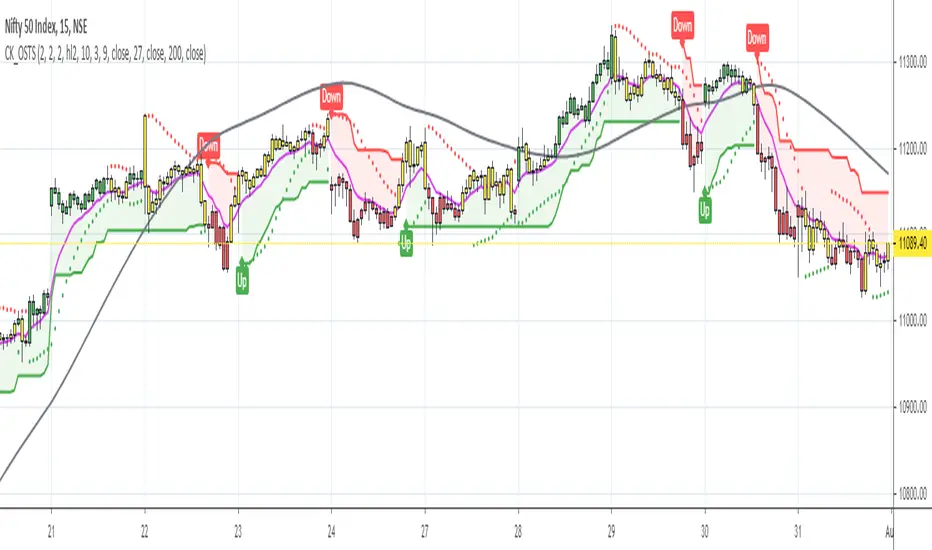
One-Stop Trading SetupOne-Stop Trading Setup:
This script designed to identify up, down, and sideways trends. 200 HMA, 9 EMA, PSAR, and ATR are used to identify the strength of any instrument.
Candle Colors - Simpler approach to follow:
Green color indicates for up side trade signals
Red color indicates for down side trade signals
Yellow color can be interpreted for stop, sideways, and counter trade trade signals
Multiple Trade Setups:
Green Zone - Trading green candles within green zone has better odds of long trades
Red Zone - Trading red candles within red zone has better odds of short trades
200 HMA - Candles above 200 HMA mostly for long trades. Candles below 200 HMA usually for short trades. But the zone also very important to consider
9 EMA - Cross over above 200 HMA in Green zone, look for long trades. Cross over below 200 HMA in red zone, look for short trades
PSAR - This can be used as potential initial warning sign. Also can be used to exit partial or wait for it goes to opposite side for taking trade decisions
Candle Above all - If Green candle and above all the indicators, then very good sign of long side. If red candle and below all indicators, then very good sign of short side.
Multiple Time Frame:
This works very well with any instrument and on any time frame. Always its better to do analysis on multi time frame before entry, exit, and trade execution. Back test it with this setup and also observe it on live market. That will give edge in taking trade decisions. All the best and happy trading.
Disclaimer:
This script and setup is written with the sole purpose of identifying the strength of any instrument. Interpretation, trade decisions, and changing inputs are up to each individual users/trades.
Parabolic Stop and Reverse (PSAR)
Jackrabbit.modulus.ParabolicSARThis is the Parabolic SAR (stop and reverse) for the Jackrabbit suite and modulus framework.
This indicator supports differential timeframe analysis and confirmational bias. Dynamic timeframes are supported.
The main indicatior and the confirmational indicator can both be individually tuned for the following:
Start, the starting value for the acceleration factor.
Increment,m, determines how fast to increase the acceleration factor.
Maximum, the maximum value of the acceleration factor.
The Jackrabbit modulus framework is a plug in play paradigm built to operate through TradingView's indicator on indicatior (IoI) functionality. As such, this script receives a signal line from the previous script in the IoI chain, and evaluates the buy/sell signals appropriate to the current analysis. The results are either combined with the signal line, or used as confirmation to the signal line. A new signal line is generated for the next script in the link.
This script is not designed or meant to function outside my framework.
By default, the signal line is visible and the charts are turned off. Signal line visibility is controlled by the Style tab, and the charts display is controlled by the indicator settings tab.
This script is by invitation only. To learn more about accessing this script, please see my signature or send me a PM. Thank you.

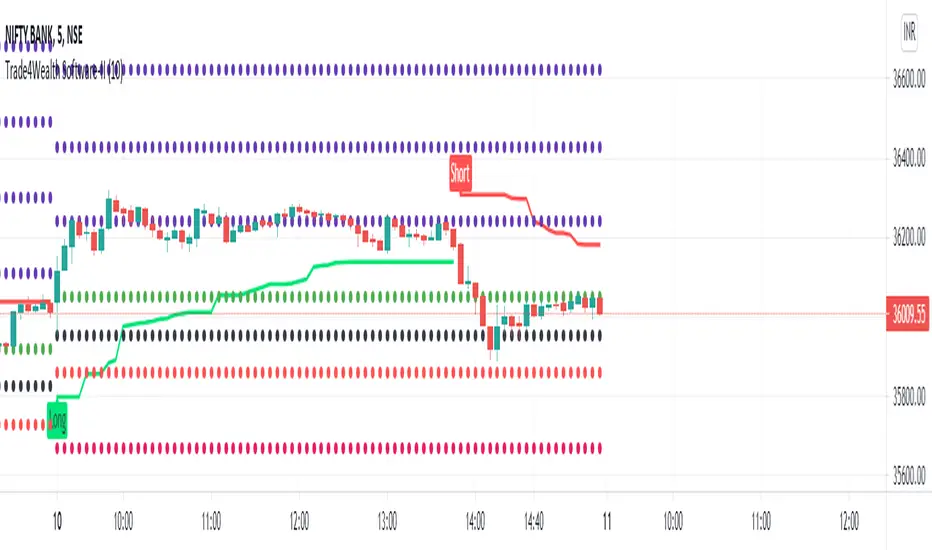
Trade4Wealth Software-IITrade4wealth Software-II
DESCRIPTION:
This Alert indicator utilizes the Heiken Ashi with non-lag EMA was a scalping and intraday trading. There is also included filtering on MACD direction and trend direction as indicated by two MA: SMA (20) and EMA (50). The Heiken Ashi candles are great as price action trending indicator, they shows smooth strong and clear price fluctuations with price.
Financial Markets: NSE/BSE/MCX
> Optimised settings for 3 min, 5 min and 15 min Time Frame.
Indicators used in calculations:
> MACD 2 colour (5,9,3)
> EMA, period 50
> SMA, period 20
> Non lag EMA , period 20
Generate Alerts use the following Trading Rules:
> Heiken Ashi with non-lag dot
> Trade only in direction of the trend.
> UP trend : MA 20 period is above EMA 50 period.
> Down trend : MA 20 period is below EMA 50 period.
How to use:
> Use software with Default Settings.
For Buy :
> If 20 SMA (i.e. Green Line) Crosses 50 EMA (i.e. Red Line) from lower to upper side than Buy.
> Zone & Parabolic Sar both must be Green for Buy.
For Sell :
> If 20 SMA (i.e. Green Line) Crosses 50 EMA (i.e. Red Line) from upper to lower side than Sell.
> Zone & Parabolic Sar both/ must be Red for Sell.
HINTS:
- Good positions occur when MACD crosses the Zero line.
- Large Heikin Ashi candles with small wicks in direction of trend are good strong trends.
How to get access:
Please click on the link in the signature or send me a private message to get access.
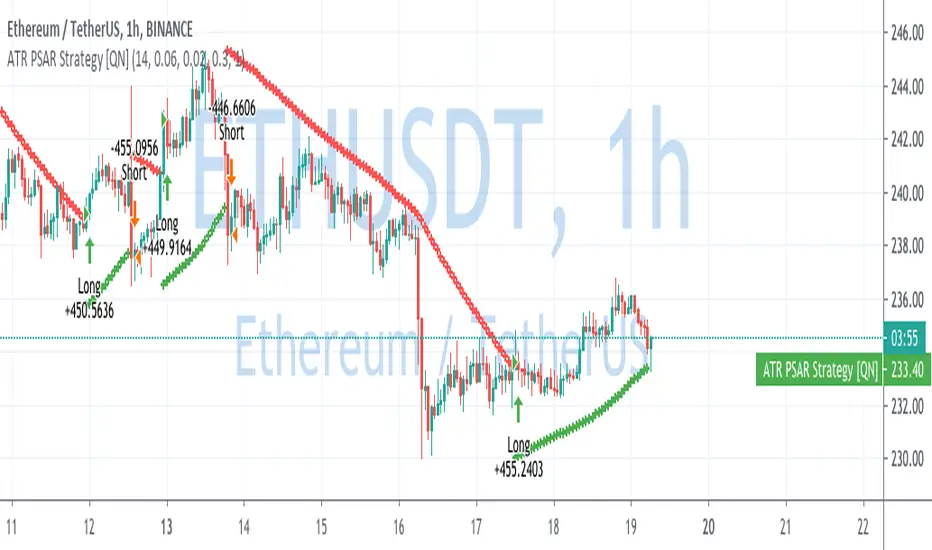
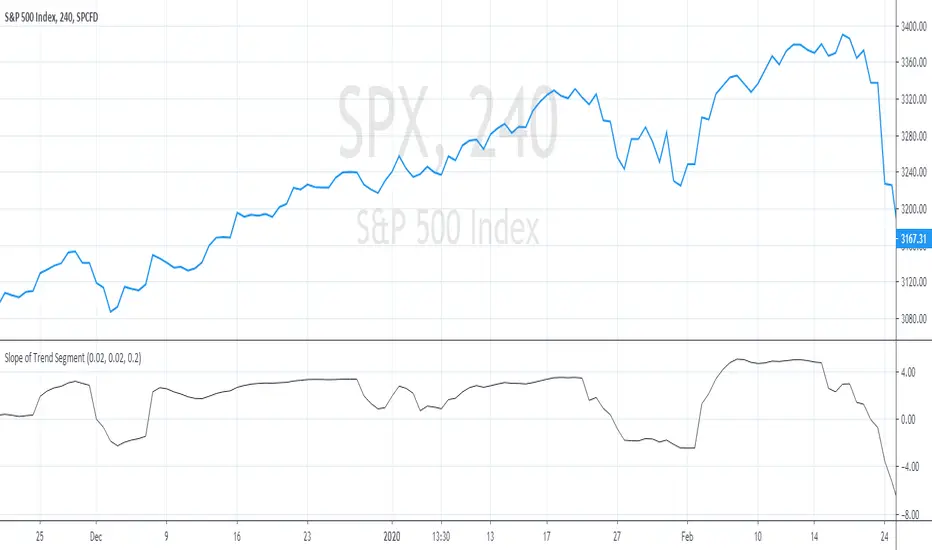
ATR Parabolic SAR Strategy [QuantNomad]I created a version of Parabolic SAR when I accelerate it not based on the difference from the extreme point but based on current ATR. So the idea is that for a more volatile market it should move faster.
Performance is calculated based on 25% equity invested and 0.1% commission.
What do you think about it? Does it make sense to do something like that?
Do you have in mind other ways I can accelerate it when the market starts to be more volatile?
Disclaimer
Please remember that past performance may not be indicative of future results.
Due to various factors, including changing market conditions, the strategy may no longer perform as good as in historical backtesting.
This post and the script don’t provide any financial advice.
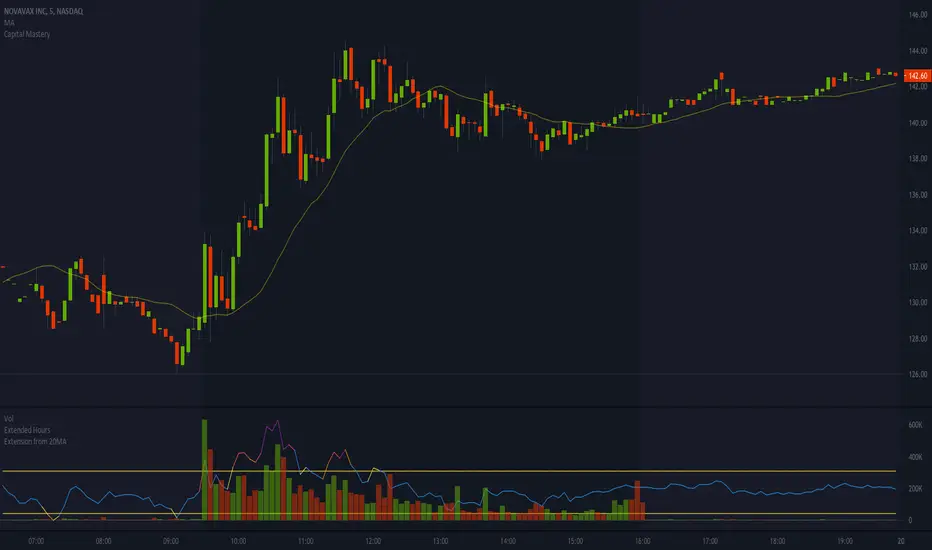
Extension from 20 Period Simple Moving AverageSimple indicator to help show when stocks are over extended intraday. It's based on the distance between a stock and it's moving average. The thesis being that, the farther away a stock is from it's 20 period simple moving average, the move extended it is. I've found that when a stock is more than 2-3% extended from it's 5min 20 period moving average, it's typically getting over extended, and can be a great time to start considering a short.
I primarily use this indicator when shorting intraday parabolic moves, while the stock is still on the frontside of the move. Note that this works best when the indicator is showing overextended AND there's a volume spike/mountain matching the overextension. In the attached example, you can see that I overlay this indicator on top of the volume panel because it helps me better visualize when the stock is getting over extended on heavy/elevated volume.
Hope this helps; any feedback is appreciated!
P.S. This works best on a 5min chart, but I'm sure it could be helpful on other timeframes, but may need to tweak the default outer bounds percentage.
mForex - 3 Moving Average - Parabolic SARScript identifies the uptrend and downtrend according to the average price of the MA and PSAR lines.
Rules of sale:
- Open short positions when:
MA12 cuts MA26 and MA52 from the top.
PSAR dots on the price line
- Stop loss:
At the dots of PSAR and use Trailing Stop facing up
On the nearest peak
- Profit-taking: Corresponding ratio of R: R (1: 2)
- Open long positions when:
MA12 cuts MA26 and MA52 from the bottom.
PSAR dots below the price line
- Stop loss:
At the dots of PSAR and use Trailing Stop facing down
Below the nearest peak
- Profit-taking: Corresponding ratio of R: R (1: 2)

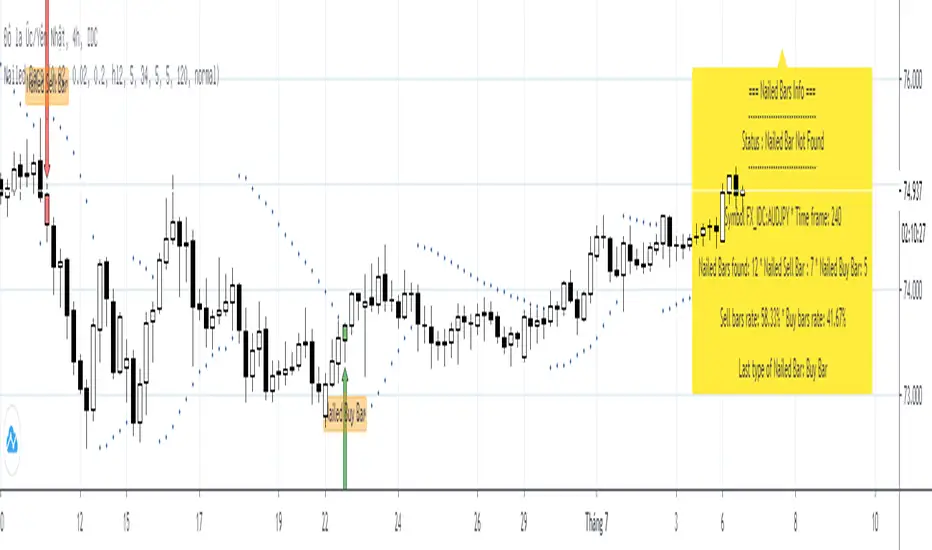
Nailed BarsNailed bars was introduced by Joy22 in an article "Pip Nailer Trading System" submit on forexstrategiesresources on 06/01/2012
Rule of Nailed Bars is below:
1. Nailed Sell Bar:
* PSAR appears above the bar
* The Awesome Oscillator (AO) turns red
* The Accelerator Oscillator (AC) turns red
2. Nailed Buy Bar:
* PSAR appears below the bar
* The Awesome Oscillator (AO) turns green
* The Accelerator Oscillator (AC) turns green
=== About this indicator: Nailed Bars ===
This indicator is detecting all nailed bars was appeared on chart and display infomations in a panel. So traders who are using "Pip Nailer Trading System" can easily control the trade.
Candle Color GeneratorCandle Color Generator:
This indicator is designed to highlight the candle colors based on the combinations of Parabolic SAR (PSAR) and 2 Hull Moving Averages (HMA).
Colors:
Yellow, Red, and Green colors are used to describe the candle colors depends on its position to PSAR and 2 HMAs.
PSAR:
PSAR position above or below candle position is differentiated by Red and Green colors
HMAs:
As default settings 20 HMA is considered as lower period and 50 HMA is considered period for the calculation
Trade What You See:
This indicator will help to see how the setup of particular instrument coming up. Users/Traders can use and trade based on what they see and interpret from it.
Disclaimer:
Idea of publishing this script is to identify the strength of the instrument using multiple confirmation.
Using this indicator, changing inputs (show/hide/change period), and trading decisions are up to the users/traders.
Courtesy:
Thanks to inventors of HMA (Alan Hull), PSAR(Welles Wilder) as these inputs are used to make some calculations

double Parabolic SAR strategy (Lirshah)double Parabolic SAR strategy is a strategy based on 2 parabolic indicator in short term and long term period
it trigger buy signals when both long term and short term SAR are on uptrend and similar scenario for selling signals.
the strategy has shown good results on Germany index in 5 min chart.
below overview is results of 1 contract +1.5$ commission per contract.
the parameters are as below:
1)long term parabolic setting
2)short term parabolic setting
3)take profit pips
4)stop-loss pips
in order to access script contact me directly

PRP - Pivot Reversal + PSAR Alerts [QuantNomad]This is study with alerts for my "PRP - Pivot Reversal + PSAR Strategy".
When creating alerts - choose "Once Per Bar Close"
It's a pro indicator, you can have access to it for a small fee. Link to my PRO indicators you can find in my signature.

PRP - Pivot Reversal + PSAR Strategy [QuantNomad]PRP is a combination of Pivot Reversal and PSAR Strategy. With this strategy, I tried to be in a position for big moves in the market.
The strategy uses Pivot Reversal entries with an additional condition that TR of entry bar should be at least X ATRs. This allows to filter out some false signals.
For exits, I recoded the PSAR indicator as trailing stop loss. So I start PSAR Y ATRs below the Pivot level price crossed at entry. After that PSAR behaves as usual.
For stability and easier execution, I check conditions only on the close, no stop/limit orders are used.

Power PSARParabolic SAR can reverse often in choppy environments. Power PSAR will indicate only when there's sufficient slope that cuts through the prior PSAR trend lines.

Validated PSARPSAR works well as trailing stop loss (or WinStop), but is often whipsaw'd as it detect trend changes over enthusiastically.
So, a filter to validate trend changes was added. It basically requires 3 straight bars completely breaking the prior saved PSAR level.
Enjoy!

WinStopSimple trend following indicator, trend defined by validated Parabolic SAR; Entry defined by Keltner channel and RSI. I call this "WinStop" as the exits are defined by the Parabolic SAR crossings, like a stoploss, but no losses involved lol.
Let me know if you need help trading with this.

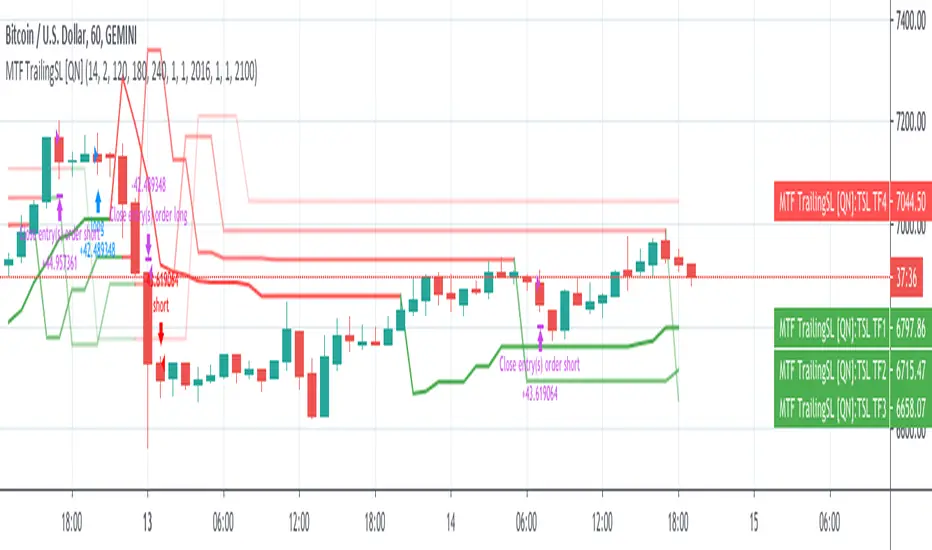
MTF Trailing SL Alerts [QuantNomad]These are alerts for my MTF Trailing SL Strategy.
Entry Long position if all 4 time-frames agree on the long signal.
Exit Long positions when at least 2 time-frames disagree on the long signals.
Entry to Short position if all 4 time-frames agree on Short signal.
Exit from Short positions when at least 2 time-frames disagree on Short signal.
Use "Once Per Bar Close" when creating alerts.
Link to the strategy:
TKP Short/Long IndicatorThis script uses T3 Moving averages and a modified Parabolic Sar Calculation to help Identify trend reversals, but can also keep you in the predominant direction of strong trending price action.

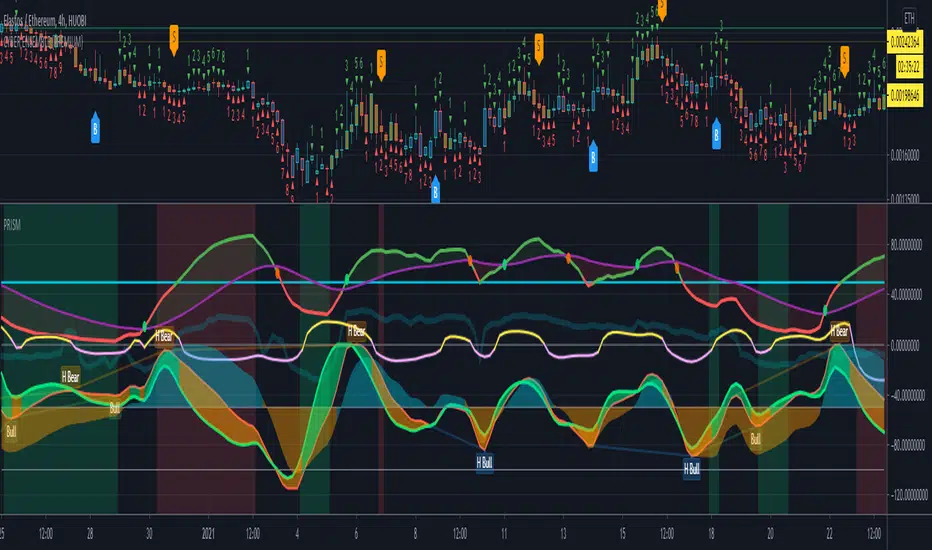
PRISM Oscillators Set {PREMIUM}The PRISM Oscillator Set consists of:
(1) A modified-pSAR derived main driving oscillator (P-Oscillator).
(2) With MAJeStic (Momentum, Acceleration, Jerk, Snap) Oscillators Set (M-, A-, J-, S-Oscillators respectively).
User can switch the main oscillator to RSI-mode (default), as well as reverting to configurable EMA/SMA MACD mode as well.
The P-Oscillator
The P-Oscillator (centered at 50 in the y-axis) indicates the instantaneous bullish/bearish cycle of the market, and the degree of which.
A MA-line is provided as well (VWMA-mode is set as the default, but user can choose to switch to SMA-mode).
The crossing of the P-Oscillator into its MA-line signals a significant turn in the P-Oscillator , similar to how the cross between MAs are being used to signal a golden/death-cross (example: P-Oscillator crossing down its MA-line indicates a probable shift into the bearish phase).
The MAJeStic-Oscillators
The MAJeStic-Oscillators are derived from the main P-Oscillator .
The M-Oscillator is the momentum oscillator, to more clearly visually indicate the current momentum phase of the main P-Oscillator -- i.e. when the oscillator is above the zeroline at -50, the P-oscillator is in an uptrend; and the magnitude of which indicates the velocity (or to be more precise, the speed) of the current momentum trend.
The AJ-Ribbon consists of the acceleration and jerk oscillators, to indicate the hidden underlying trends in the momentum. They can be thought of as the hidden force/hand that pushes and pulls the momentum oscillator upwards or downwards.
Both the M-Oscillator and the AJ-Ribbon are y-shifted down with its zeroline set at -50, simply for the purpose of clarity of presentation for this multiple-oscillator script.
The S-Oscillator is centered about the 0 as its zeroline. It is a highest-order indicator, derived from the AJ-Ribbon , and is an extremely sensitive indicator -- which is able to dig up even the more subtle market trends that may later cascade into a more macro trend. For example: when it crosses from the negative into the positive (especially with a steeply positive slope) and holds above the zeroline, it is then likely that price will see some upside movement ahead (depending on the magnitude of the oscillator as well), even if it may presently be simply moving sideways or even downwards (i.e. a divergence in the S-oscillator wrt the current price movement).
The alignment of the various indicators gives the clearest signal of the market trend, however, that naturally isn't always the case. Hence, when signals from the oscillators looks conflicted, the higher order oscillators (i.e. the AJ-Ribbon, and the S-Oscillator) will be helpful indicators of possible movement incoming; alternatively looking for divergence and hidden divergence of the P-Oscillator (set to RSI-mode) is also an effective strategy.
This oscillator set is suitable to be applied on any timeframes and on any charts.
This oscillator does not give precise price targets, but only offers a qualitative view of the present as well as the probable incoming price action.
To (attempt to) predict price targets, I personally use the PRISM Oscillator Set in conjunction a combination of various support & resistance analytical strategies: e.g. VPVR-levels, moving averages, trend-lines, Ichimoku Cloud, etc. and looking/waiting for sufficient candle closing and break-outs for confirmation, etc.
The PRISM Oscillator Set provide a momentum-focused perspective of the current market.
While my other script, Cyber Ensemble ( which generates buy/sell signals base on the scoring of a large ensemble of technical indicators + and modified by a series of filters ), provides a technical perspective of the current market; and which I frequently use conjunction with the PRISM Oscillator Set .
~ * ~ * ~ * ~ * ~ * ~ * ~ * ~ * ~ * ~ * ~ * ~ * ~ * ~ * ~ * ~ * ~ * ~ * ~ * ~ * ~
Note:
In no way is this intended as a financial/investment/trading advice. You are responsible for your own investment/trade decisions.
Please exercise your own judgement for your own trades base on your own risk-aversion level and goals as an investor or a trader. The use of OTHER indicators and analysis in conjunction (tailored to your own style of investing/trading) will help improve confidence of your analysis, for you to determine your own trade decisions.
~ * ~ * ~ * ~ * ~ * ~ * ~ * ~ * ~ * ~ * ~ * ~ * ~ * ~ * ~ * ~ * ~ * ~ * ~ * ~ * ~
Please PM me for access information.
© cybernetwork
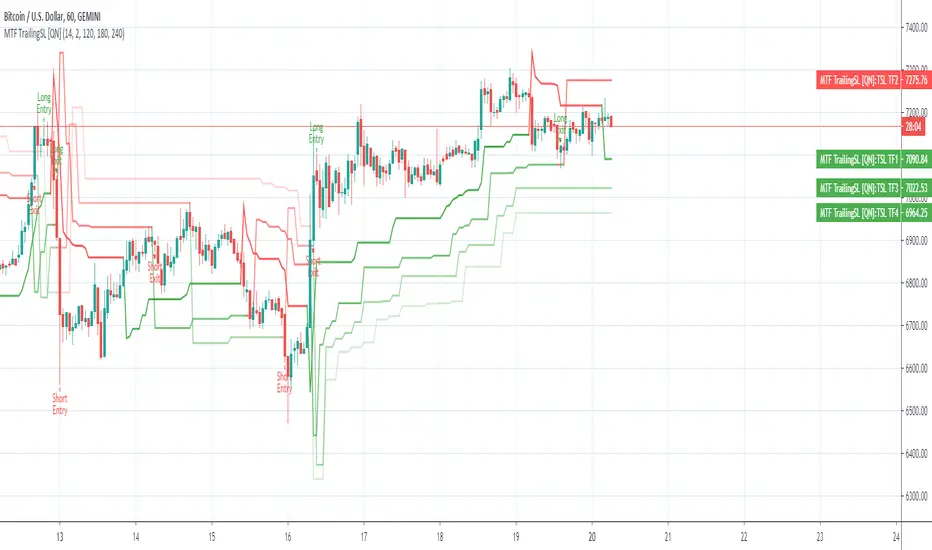
MTF Trailing SL Strategy [QuantNomad]This is a Multi-Timeframe version of my Trailing SL Strategy.
Few weeks ago I published Trailing SL Strategy. There I used only basic Trailing SL to enter positions.
It worked pretty well so I tried to work on it a bit. I thought what if you can use the same ATR TSL on different timeframes and combine them into one signal.
In this strategy you can use only ATR stops and choose 3 other higher timeframes in addition to your current timeframe.
You'll see Trailing SL plotted on the chart form all these timeframes.
Entry Long position if all 4 time-frames agree on long signal.
Exit Long positions when at least 2 time-frames disagree on long signal.
Entry to Short position if all 4 time-frames agree on Short signal.
Exit from Short positions when at least 2 time-frames disagree on Short signal.
Here is the link to my basic Trailing SL Strategy:
Parabolic SAR Alerts (on close) [QuantNomad]This is study with alerts for my previously published strategy:
Use "Once Per Bar Close" alerts.

BTC efficient TF 1 min scalping strategyThis strategy is optimized for bitcoin (XBTUSD on bitmex)
It catch fast trades going with the trend, so it should work in trends like in consolidation.
This strategy is based on S/R mixed with parabolic SAR, the point is to catch a movement when it's starting and confirmed.
It's optimized for 1 min timeframe, you might try it on other other tf but change the SL/TP too.
You should used it for few minutes scalp, fast enter and exit, on 1 min TF.
Rules:
- Use small position, max leverage x5
- Place TP between 55 and 60 $
- Place SL at 150$
- Entre in position by limit, you get paid for it
Enjoy, test it and make some money :)
No repaint.

Trailing SL Alerts [QuantNomad]It's alerts version of my Trailing SL strategy:
Use "Once Per Bar" param when creating alerts.
Easy Loot Trailing Stop Bot - (PSAR) StrategyHello World,
Today I am bringing you a Parabolic Stop and Reverse Strategy that uses a 5% trailing stop loss.
Tested the strategy on the 1D timeframe of Bitcoin from the time period starting from 2018 onwards.
As you may know the price in the start of 2018 for Bitcoin was around $11,000 meaning if you bought and HODL'd since then you'd be down a good %, as current price is $8650.
Below is the strategy testing results, up 844% profits in the last two years.
Easy Loot Members Only, contact me if you'd like access to the strategy.
Parabolic Stop and Reverse (PSAR) Strategy
Parabolic SAR is a time and price technical analysis tool primarily used to identify points of potential stops and reverses. In fact, the SAR in Parabolic SAR stands for "Stop and Reverse". The indicator's calculations create a parabola which is located below price during a Bullish Trend and above Price during a Bearish Trend.
Trailing Stop Loss
A trailing stop-loss order is a special type of trade order where the stop-loss price is not set at a single, absolute dollar amount, but instead is set at a certain percentage or a certain dollar amount below the market price.
