Parabolic Stop and Reverse (PSAR)

Trend Lines and MoreMulti-Indicator consisting of several useful indicators in a single package.
TREND LINES
-By default the 20 SMA and 50 SMA are shown.
-Use "MOVING AVERAGE TYPE" to select SMA, EMA, Double-EMA, Triple-EMA, or Hull.
-Use "50 MA TREND COLOR" to have the 50 turn green/red for uptrend/downtrend.
-Use "DAILY SOURCE ONLY" to always show daily averages regardless of timeframe.
-Use "SHOW LONG MA" to also include 100, 150, and 200 moving averages.
-Use "SHOW MARKERS" to show a small colored marker identifying which line is which.
OTHER INDICATORS
-You can show Bollinger Bands and Parabolic SAR.
-You can highlight key reversal times (9:50-10:10 and 14:40-15:00).
-You can show price offset markers, where was the price "n" periods ago.
That last one is useful to show the level of prices which are about to "fall off" the moving average
and be replaced with current price. So for example, if current price is significantly below the
200-days-ago price, you can gauge the difficulty for the 200 MA to start climbing again.

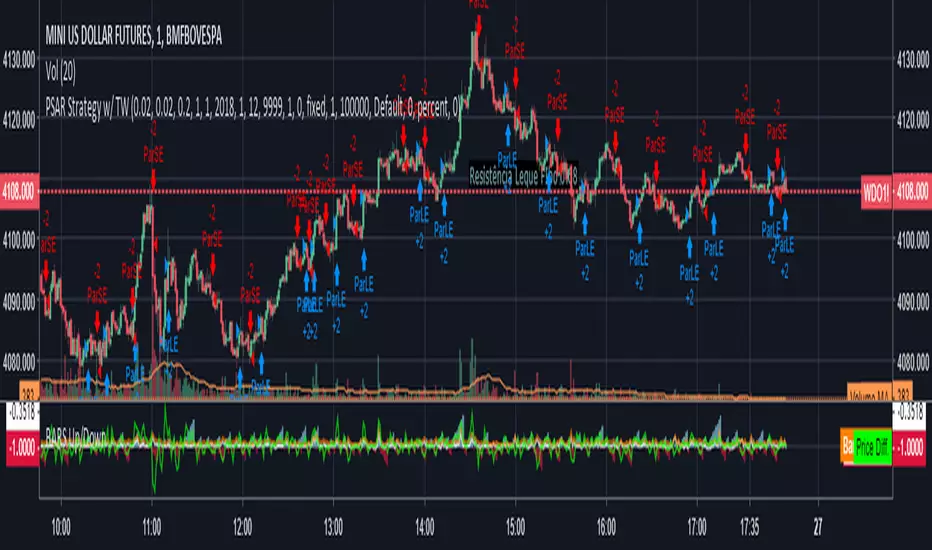
Kozlod - Parabolic SAR Strategy AlertsAlerts for standard Parabolic SAR Strategy.
It works best with "Once per bar" option.

Parabolic SAR & Arnoud Legoux Moving Avarage StrategyIn the first short signal example, after price closes below the ALMA and the parabolic SAR plots above the price high, sell signal is opened with the stops trailed to the PSAR values until the trade is stopped out.
Similarly, you can see a long position where price cuts above the ALMA and the Parabolic SAR plots below the price low. Using these values as the trailing stop levels, we can stay long into the trade until the trade is stopped out.
Find out optimal values by trying. May not produce accurate results in horizontal markets. Thank you.

makemoneyThis system design for you in order to make you money :) I hope...
1. the donochian channel is based on color of high and low price (easy to see where the bars exist)
2. resitance and support are drawn by bolinger system (black and red dots)
3. buy and sell are based on volume model (B and S ) with alerts
4. when PSAR and the buy or sell are in agrreement this are called strong buy or sell points shown in green and red trinangle
5. you can use stop loss or take profit based on system in volume model
using the system very easy and I hope you make noney on it either shorting or longing
I normaly use 1 hour and 30 min charts . you can try another time frames if it work to you
the code is open so you can modify , chane or do what ever you want with it

poki buy and sell Take profit and stop lossThis indicator is based on modelius model of lazy bear weis model with ATR for the buy=B sell =S
in addition there is Take profit and stop loss in % both for short and for long
next stage is to know the resistance level and support based on bollinger marked in blue and red dots
Also included Parabolic Sar (blue and red dots rising up or down)
The color of bulish or bearish zone is based on the cross of Hull avreage and linear regression ( for each time set may need different setting for accuracy )
So how to use this scrupt to better profit
1. if you have B signal and its on lower support level then its good starting place for buy. look at the Parabolic Sar if its in agreement. The exit can be either by S =sell, Take profit that you decide on % or by end of Parabolic SAR upward
2. exact the oposite for short
Play with setting for the desired results or change modify this script for your purpose


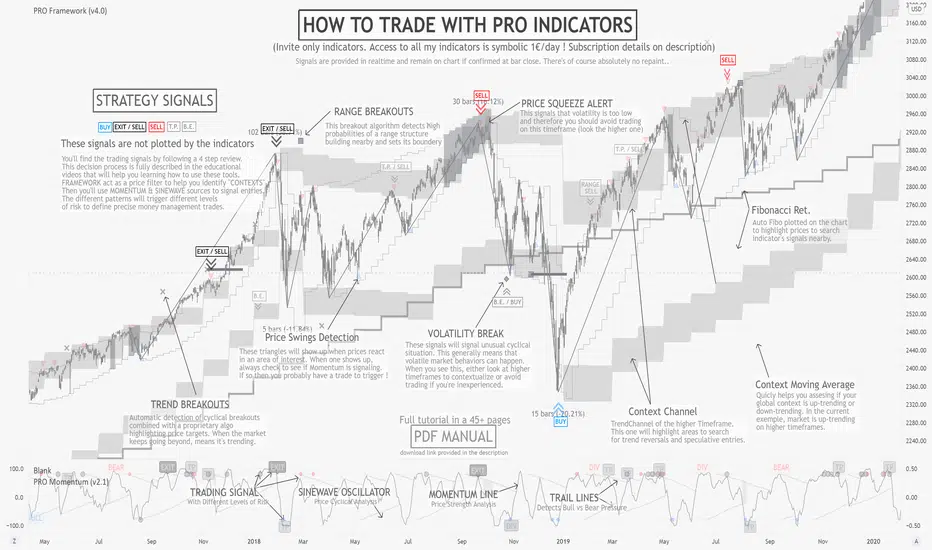
PRO FrameworkINVITE ONLY SCRIPT:
FEATURES:
As its name suggests, Framework is here to offer a non-subjective frame of reference to traders. Effectively filtering 90% of prices offering poor risk management opportunities. More importantly this is a multi-timeframe tool that will scan across three time frames all at once, offering a final synthesized rendering. Our goal was to provide a professional grade dynamic price analysis without bloating the chart with numerous plots. Nevertheless they are complex tools requiring extensive learning. To support students in their journey, there is a wide open online community of users in our Discord channel, providing peer-to-peer assistance to progress with the strategy as well as tutored courses.
OUTPUTS:
To share a brief description of the indicators functioning, we will scroll through the major set of outputs that are presented to the user. Please note that the indicator is meant to assist from Junior to Senior expertise, to achieve this we have set different base templates right into the indicators. To keep this description simple, we will present the outputs you’ll see with the beginner setup:
Context Channel: composed of two “ribbons” one above the price and one below. It represents the dynamic zones of supply and demand, where prices are likely to find support and resistance for the given chart timeframe. They are representing complex algorithmic versions of channels evolving over time, while adapting to both ranges and trend conditions. Allowing to visualize the current price channel which the price is trading within, but also review the history of past dynamics. Ultimately, studying both the recent and past context behavior tells us everything we need about the price structure.
Average Price: Corresponding to a simple 20 period moving average synchronized with the context channel reference timeframe. Looking at the channel’s position relative to this average will help us define the “context” of the market, thereby filtering the patterns we will be able to apply to this chart (range, trend, volatility).
Breakout Targets: represented by small plots on the chart (cross, square, diamond) they inform the trader that the market is attempting to move in a particular direction. Given the predetermined context in which that pattern triggers, this will help us in managing the risk.
Price Confirmations: corresponding to the small triangle plots on the chart, they are automatically calculated to determine areas where other traders might have taken actions. These triangles aren’t a trading signal per say, they will be the trigger for our trades with the PRO Strategy, but only when patterns are active (meaning we are in the right context, and have enough risk limitation elements to justify entry).
Auto-Fibonacci: As most of our patterns include certain retracement rules, we decided to include a built-in fibonacci plotting tool. The outputs will automatically update with new prices, allowing users to use it as a trigger for the TradingView alerts system.
Automated Context Detection: the actual real Intellectual property and added value of PRO Indicators resides in our semi-automated system, based on the complex algorithmic detection of potentially favorable contexts to apply the strategy on. This also means that you can set alerts, and let the cloud monitor the market and be notified when the conditions are deemed viable. As you progress to more Senior contexts and adjust the indicators’ template setup, more complex alerts will be detected.
GENERAL STRATEGY:
Overall, the PRO Strategy combines two “core” indicators, Framework and Momentum. Framework is plotted on the main chart section as an overlay, it is definitely the most important as it guides the user through the hard process of filtering prices and timeframes that are suitable for technical analysis. On the other hand, PRO Momentum is on a separate oscillator tab under the chart section, it will study the momentum and cyclical structure, also offering automated pattern detection. Ultimately, our strategy is based on collecting and processing non-subjective rules, emanating from the indicators outputs. Essentially, this means that the indicator actually takes care of producing all the necessary binary outputs, leaving you with the remaining task of combining them correctly following the strategy’s patterns.
RISK LIMITATION:
Even if we provide semi-automated detection of viable contexts, there is no “one-click” or "easy-win” solution, the user still needs to carefully review the elements. When applicable pattern rules are confirmed, the user will gather risk-limitation information (breakout targets, price confirmations, momentum and cyclical coordination) and decide whether or not to trade according to its own risk profile. If so, the position sizing, stop-loss positioning, risk management and profit targets will all be defined according to the same indicator’s outputs. This effectively suppresses most behavioral and personal biases the trader could introduce, creating a stable and statistical risk management structure aiming for a durable profitability.
Pivot Boss 4 EMA + Bollinger Bands + Parabolic SARA combination of some of my favorite indicators.
All credit to original authors.
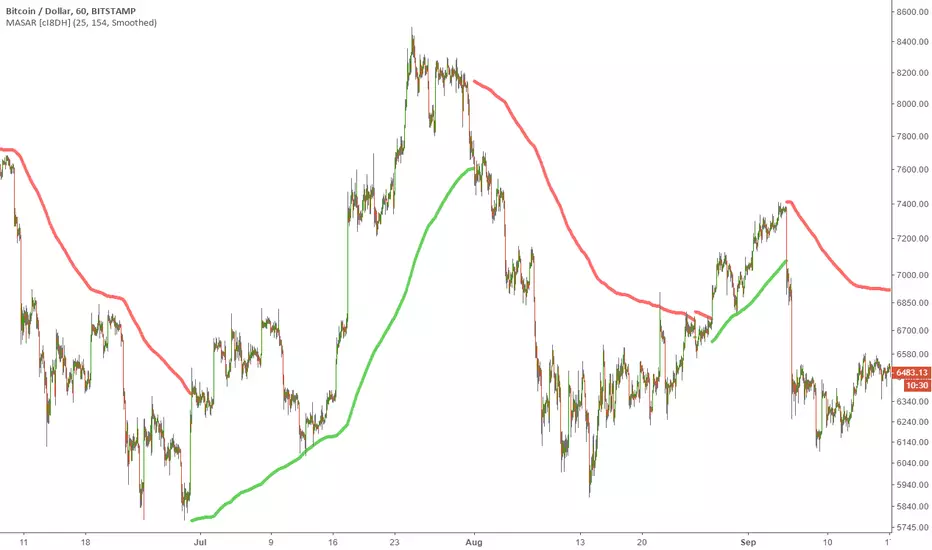
Moving Average Stop and Reverse v2 (MASAR) [cI8DH]This indicator is an alternative to Parabolic Stop and Reverse indicator. It is primarily used to identify points of potential stops and reverses.
Instead of using a static parabolic curve, this indicator adjusts dynamically. Read here to learn more about the usage of this indicator.
I tested the strategy version of this indicator on Coinbase:BTCUSD and compared the results to the Parabolic SAR . I changed the settings on both indicators to achieve the best results on each indicator. This indicator outperformed the Parabolic SAR by a large margin.
You need to calibrate the indicator depending on the asset and time frame. Default options are calibrated for 1h on BTCUSD. It works best in trending markets.
This indicator has a multi timeframe feature as well.
Here is a TL;DR list of my indicators to save you some time from looking at my obsolete indicators.

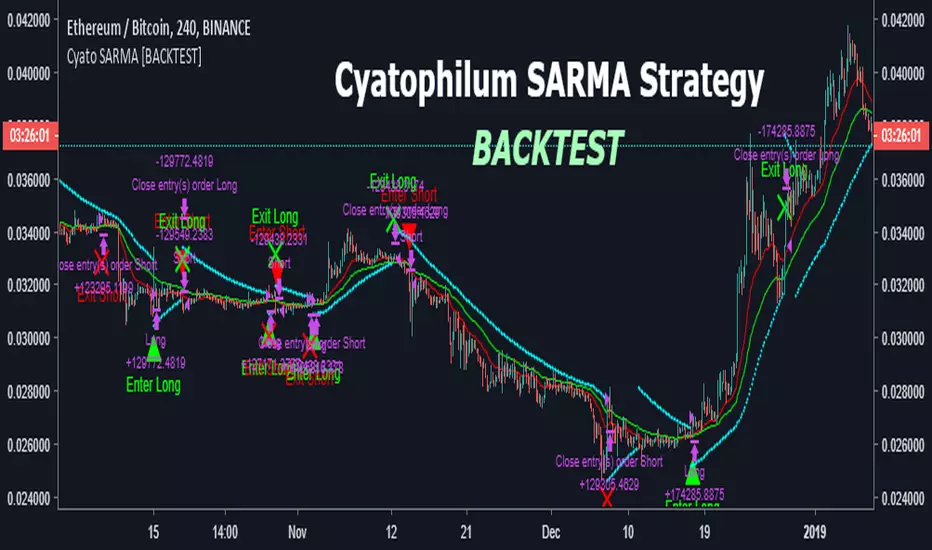
Cyatophilum SAR-MA Strategy [BACKTEST]An Automated Strategy based on Parabolic SAR and EMAs. Works on any timeframe and market.
Backtest is done using the largest period TradingView has to offer for 1H. Net profit is calculated using the Strategy Tester, with only long entries at Green triangles and exits at red triangles. Profit can be greater if you short Sell signals (red triangles). Commission used is 0.05%.
This strategy is going to be on my website later because it was commissioned by a customer and I had to publish it quickly. You can get access if you purchase the Cyatophilum Indicators. blockchainfiesta.com
I will publish an Alert Setup version soon.
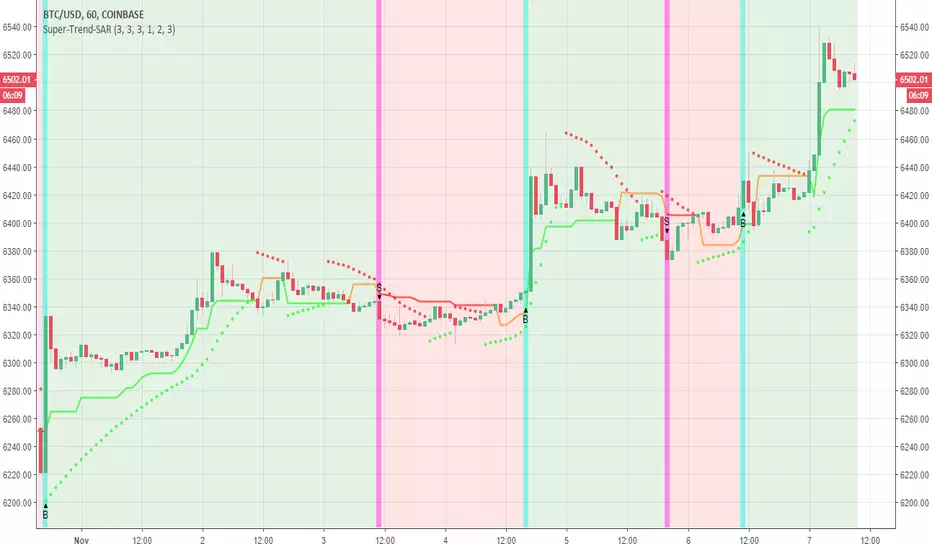
Combo Basic IndicatorsThe indicator consists of multiple time frame SMA and PSAR, the very basic indicator but could be profitable.
SMA can be used as dynamic Support-Resistant levels, and value of higher time frame are considered more significant (major level).
For example, Bitcoin currently has weekly support at 6568$, and regarding to SMA of lower time frame (Day, 4H,..) that are near then concluded as sideways condition.
However, trading opportunities still can be found for short term and tight range (scalping).

Moving Average Stop and Reverse Strategy (MASARS) [cI8DH]This is a backtest script for an advanced version of my MASAR indicator. I could find a (local) optimum for 1h time frame on Coinbase:BTCUSD which yields 176k% profit when the position size is set to 100% of total equity (going all-in in each trade). Other trade settings are set to default. You can probably find better settings if you play around with the settings (ping me if you did). It performs best in trending markets and performs worst in barting markets.
If you want to use this for other assets or time frames, please calibrate the settings. I reduced the number of parameters (compared to the one I use) to minimize overfitting and make it easier to calibrate (fewer parameters to tune).
Current version is sensitive to wicks. I will try to fix this issue in future versions. Please don't use it in real trades without validating it.
To get access, read the description in this TA

Moving Average Stop and Reverse (MASAR) [cI8DH]This indicator is an alternative to Parabolic Stop and Reverse indicator. It is primarily used to identify points of potential stops and reverses.
Instead of using a static parabolic curve, this indicator adjusts dynamically based on the changes in moving average of the price. Read here to learn more about the usage of this indicator .
I tested the strategy version of this indicator on Bitstamp:BTCUSD and compared the results to the Parabolic SAR. I changed the settings on both indicators to achieve the best results on each indicator. This indicator outperformed the Parabolic SAR by a large margin.
You need to calibrate the indicator depending on the asset and time frame. It works best in trending markets.
Keltner Channels+Parabolic Sar+Fractals+MACDA mixture of 4 indicators on the same overlay. Keltner Channels, Parabolic Sar, Fractals. MACD is integrated for yellow candles in order to show huge macd and trigger line gaps. MACD integration focuses on hist line by determining negative upper level and positive bottom level.

Parabolic DanyThis script is based on a strategy that includes the following indicators:
EMA at 100 periods;
RSI at 14 periods;
Parabolic SAR;
For the signals to occur the requirements are:
The price must cut the exponential moving average to 100 periods and close over;
The next spark plug must be of the same direction as the one that cut the moving average;
You must break the support or resistance generated by a swing within 20 previous spark plugs;
The Parabolic SAR must be in favor of operation;
The strategy is that you enter the market at the opening of the candle after the signal with a STOP LOSS of 25 pips and a Risk / Yield of 1 or 1.5 and maybe follow the Trailing Stop operation.
Good trading at all.


Bolinger Bands & Parabolic SARYou can use Bollinger Bands and Parabolic SAR at the same time.
You can choose BB Moving Average Type from SMA, EMA, RMA, WMA.
(if you want to use another type of MA , let me know)
ボリンジャーバンドとパラボリックSARを同時に描画します。
BBの中心線はSMA、EMA、RMA、WMAから選択できます。
(ほかに使いたい中心線があれば相談ください)

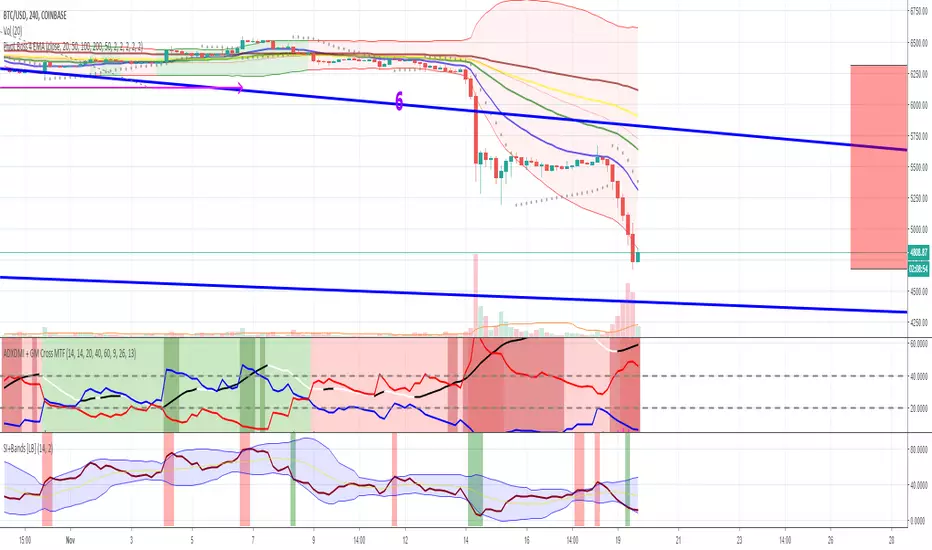
LinearSARThis is colur coding of linear model and Sar . it good for a template to make upon it better models
also it a great model for long or short on bitmex
so have fun

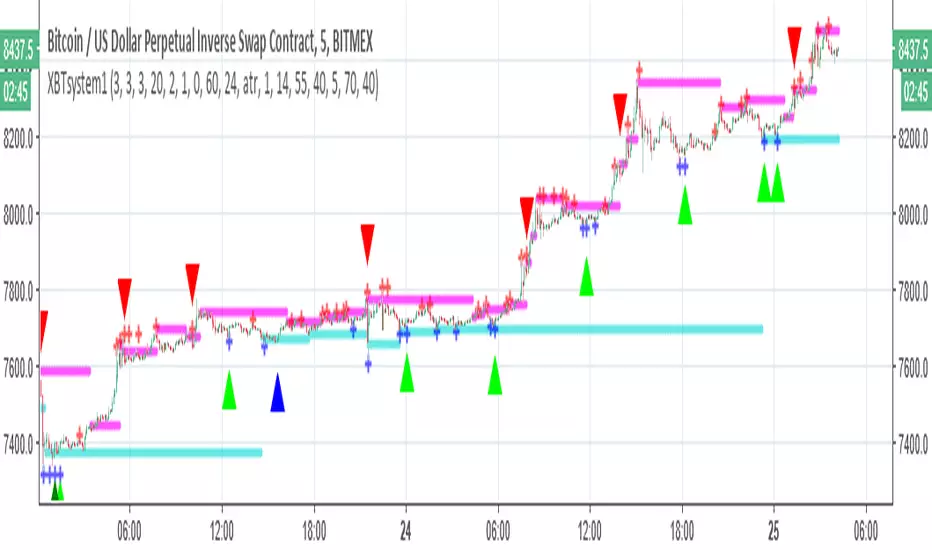
XBTsystem1 I add sar to the system so I think this one better
This is 5 min system for XBT on bitmex. for different time frame just change the setting
it a semi auto system and you need to follow the rules exact in order to be in the profit
1. the system show you the line of support and resistance of XBT
there are 3 buy points (strong green based on rsi ,lime based on cross up ATR donochian channel and blue based up on crossing up the support and system.
the arrow is just to help you to find your way and to give you alerts when it happen.
the exit is based on the resistance level shown in red triangle.
2. you buy at arrow cross up. take profit is the next line of resistance (pink) . if it breaking it up set your take profit to next resistance level
there are warning made by blue and red crosses this is based on ATR . you use them as a guide for fast exit if need or entry . there is no alerts for it.
3. each support level is the lower point exists to guide you for your stop loss ' put bellow it
4. set your take profit correctly