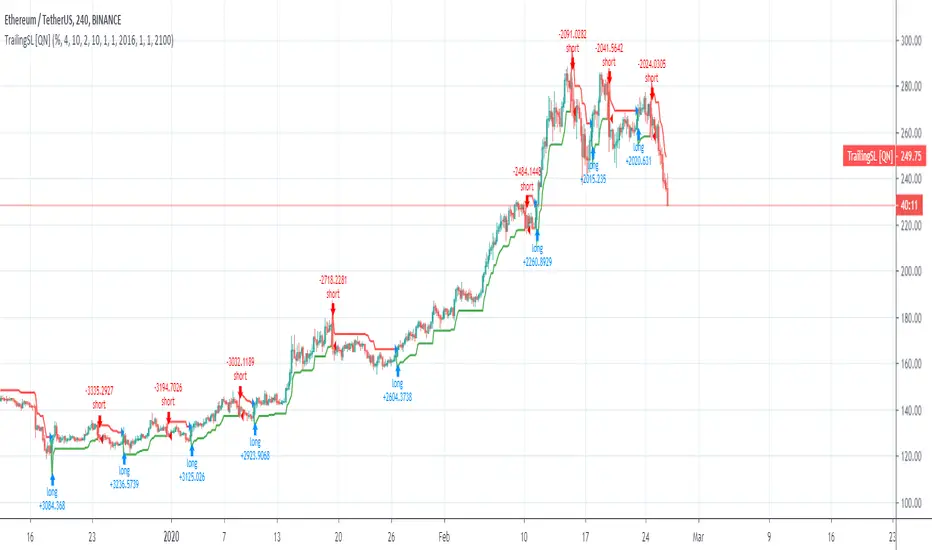
Trailing SL Strategy [QuantNomad]I'm a big fan of simple strategies.
This one is a very simple one. So it consists only from one Trailing SL. When SL is hit, the position is reversed and SL is tracked for a new position.
You can choose one of 3 types of SL:
% of your price
ATR - it is calculated as current ATR * multiplier
Absolute
As you can see even this simple strategy can show pretty good results.
Parabolic Stop and Reverse (PSAR)
Pivot Boss 4 EMA + BB + Parabolic SAR + IchimokuA combination of a few of my favorite indicators.
1) Pivot Boss 4 EMA
2) Bollinger Bands
3) Parabolic SAR
4) Ichimoku Cloud
All credit to original authors.

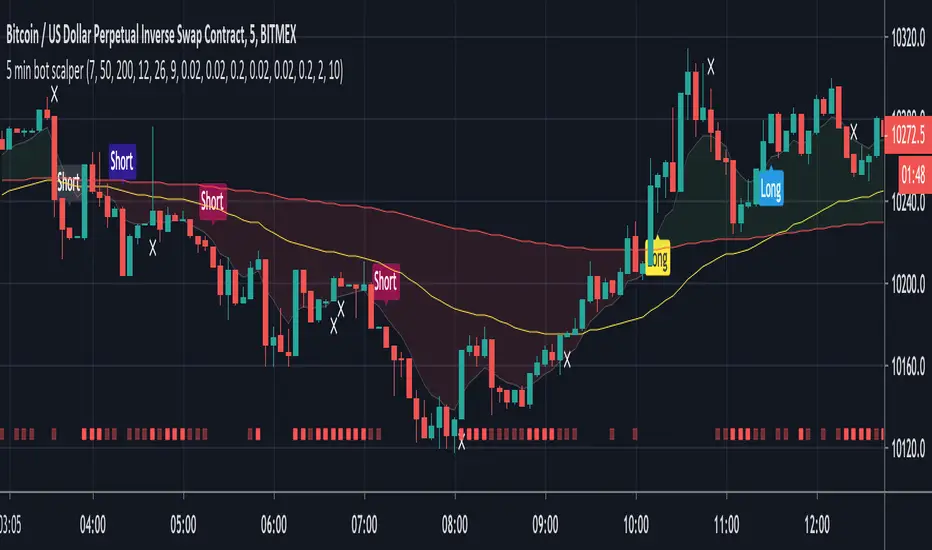
5 min bot scalperSAR signals (Parabolic and Lucid) combined with UT pivots, all filtered by the 200 MA. Golden and death crosses are also included to catch larger moves out-with long/short trends. These are filtered by my chop indicator to remove sideways signals.
This is designed for the 5 minute chart but may be useful elsewhere with some tweaking.
Alerts are included for long, short and exit signals.
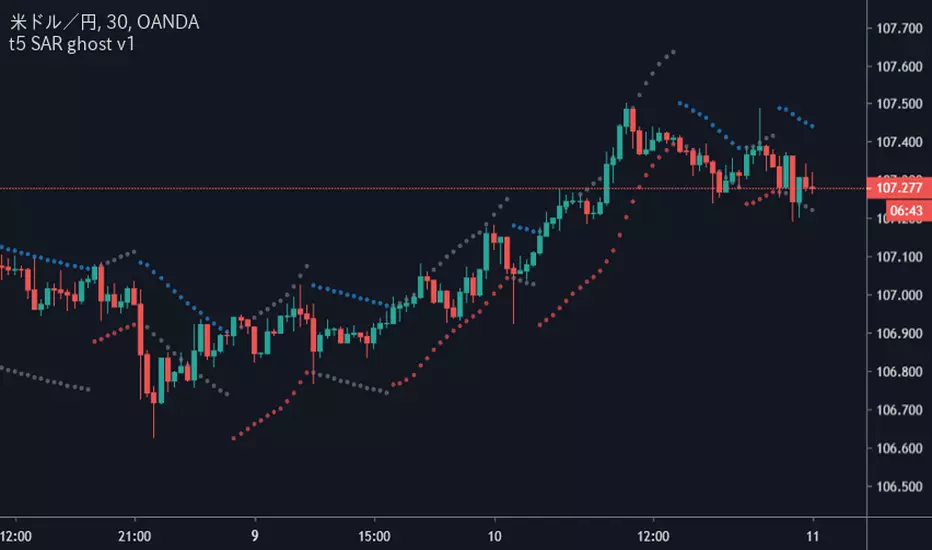
Legacy PSARThis indicator is a porting to the new Pine scripting language from TradingView, leveraging the old official TradingView's Java-based SAR indicator. The accuracy of their new and current official algorithm is being disputed, behavior changed in february 2020 and there's a fundamental flaw in implementation.

TOPDOG SCALPING-BANDS****this indicator is an implementation of the Bollinger Band
scalping system.
This technique is for those who want the most simple method that is
very effective. It is BEST traded during the busiest trading hours,
This method doesn't work in sideways markets, only in
volatile trending markets.

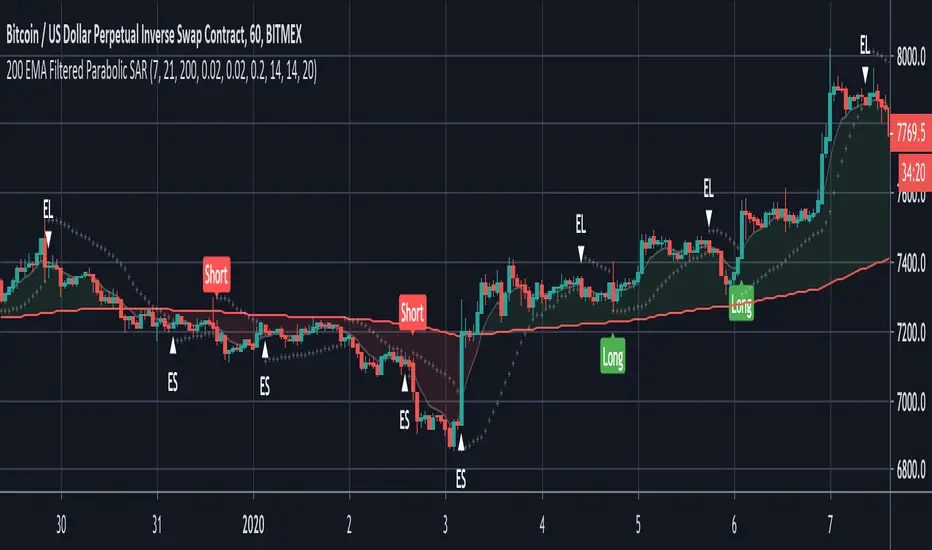
200 EMA Filtered Parabolic SARThis script uses Parabolic SAR with the 200 EMA to determine long and short trends. Only long signals are given when the price is above the 200MA and shorts when it is below. Signals are further filtered using ADX to reduce noise.
Suitable for trading bots where open positions in the same type are set to be ignored.
Alerts are built in.
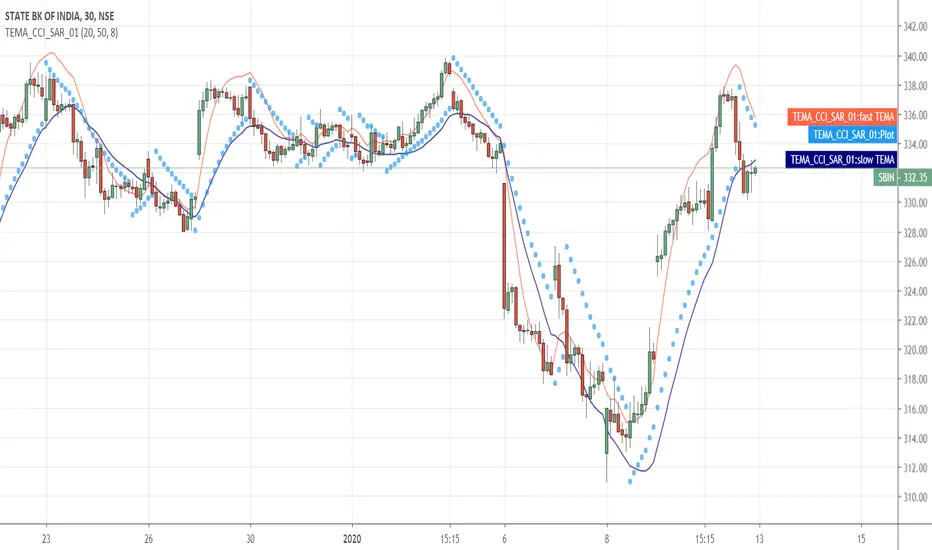
TEMA_CCI_SAR_01This strategy is using TEMA and PSAR for buying selling. Educational.
Disclaimer: if you this tool for trading which may cause losses and profits which myself or Tradingview and its partners wont responsible for it.
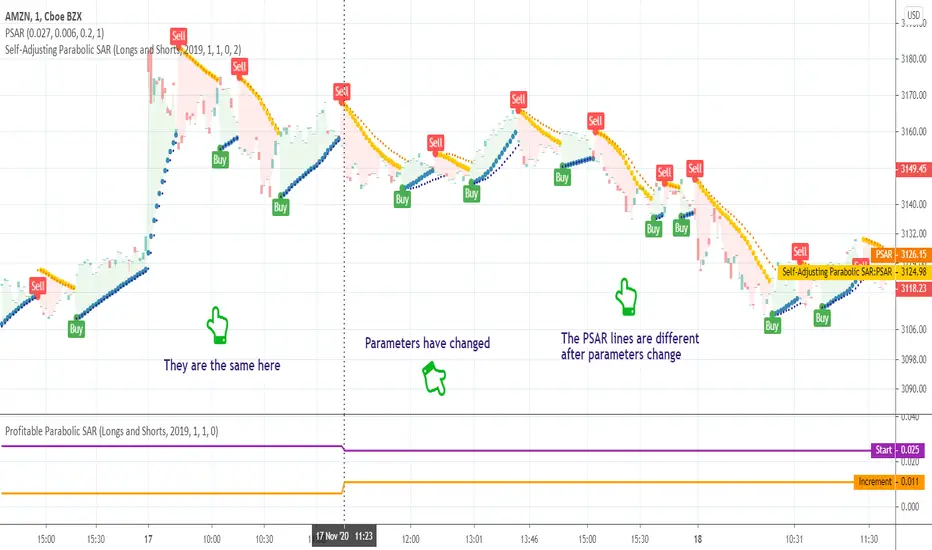
Self-Adjusting Parabolic SARWhat is this tool?
This is an implementation of the well-known Parabolic SAR indicator that can adjust parameters on the fly to achieve a better profitability.
The algorithm was borrowed from Profitable Parabolic SAR and connected to the basic Parabolic SAR implementation. So, now it will switch parameters automatically without any manual work required.
Profitable Parabolic SAR indicator can be found here:
Parabolic SAR indicator can be found here:
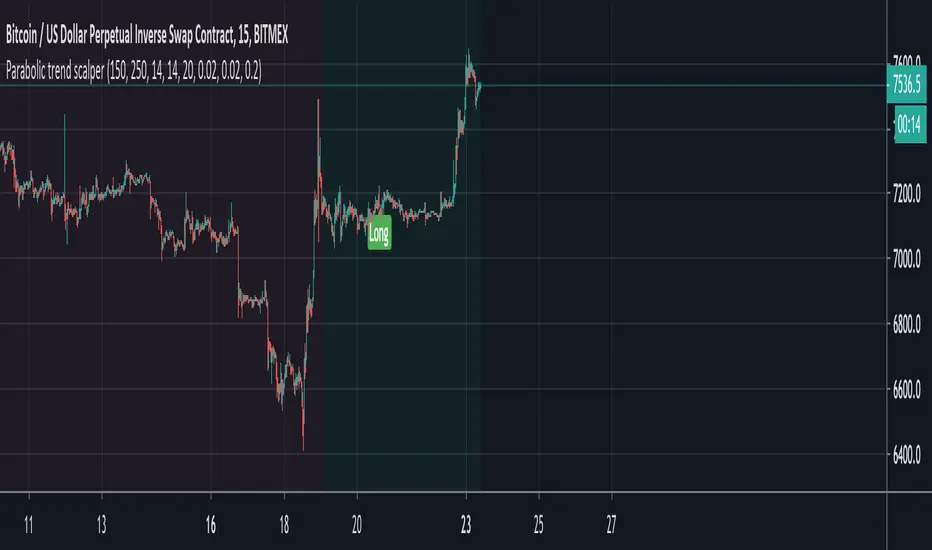
Parabolic trend scalperThis is based on a well known 5 min forex scalping strategy that analyses the general trend and goes long/short in that direction. Trades are filtered against a number of fundamentals to minimise the chances of weak signals.
Dark green = Upward trend
Light green = Long signal
Dark red = Downward trend
Light red = Short signal
Alerts are built in and should be set to 'once per candle' if trading with a bot. Ensure that your setup ignores alerts for positions already open in the same direction.
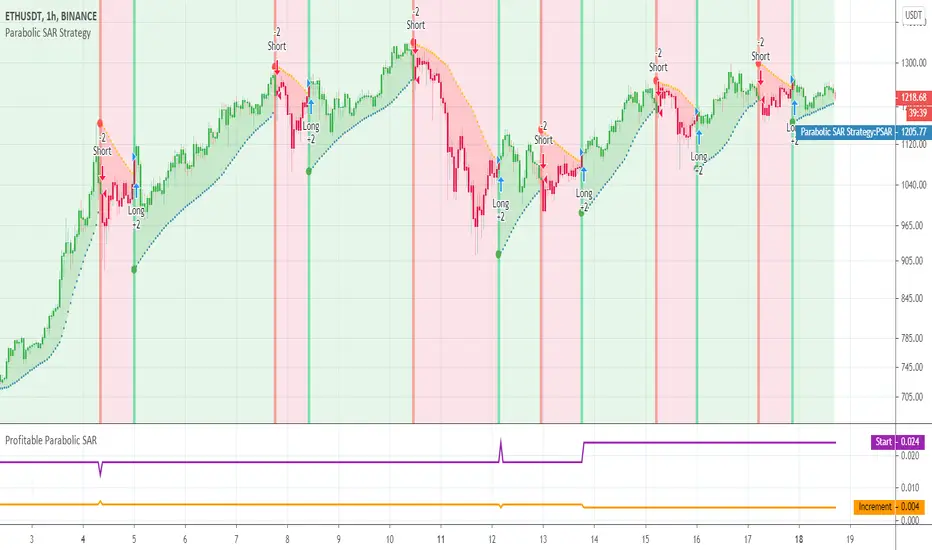
Parabolic SAR Strategy (on close) [QuantNomad]Created a Parabolic SAR strategy where price has to close under/above the level before for it to reverse. This way it should be a bit more stable and protect you from false breakouts.
It was impossible to adjust the built-in "sar" function so I implemented PSAR from scratch. So if you're interested in how it's work inside you can check the code and probably adjust to your need if you have a custom modification of PSAR in your mind.
EMASARPLEASE READ THE FULL DESCRIPTION BEFORE BUYING OR USING THIS INDICATOR
EMASAR (pronounced Emma-sar) is a strategy based on Exponential Moving Averages and the Parabolic SAR . This is a position trading approach that is derived from Tyler Jenks’ Consensio.
This strategy was developed with four objectives in mind: (1) managing risk (2) protecting from missing out on major moves (3) maximizing risk:reward (4) staying in a trending market and taking profit before it fully reverses.
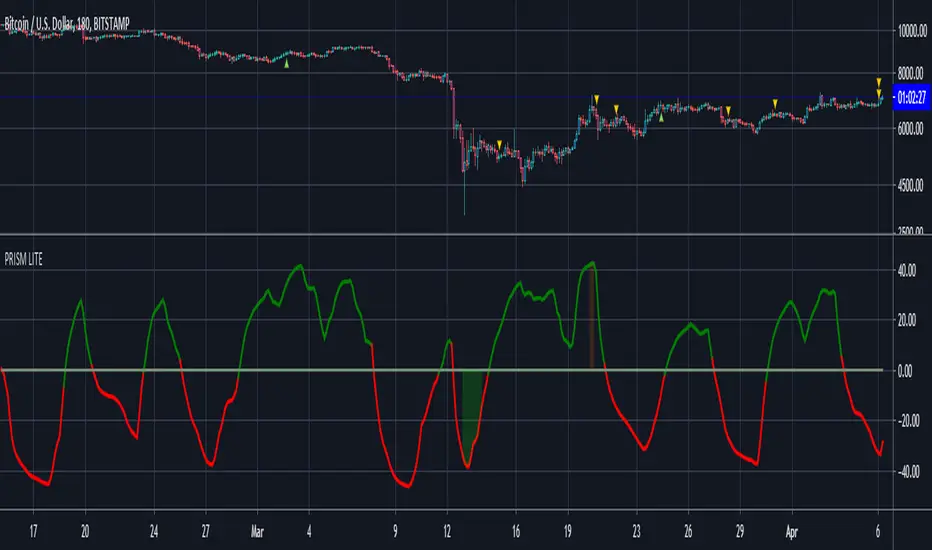
EMASAR does a great job at accomplishing all of the above through the buy and sell signals that are generated. The data provided below is from the signals that occurred on Bitcoin (Bitstamp) from January 1, 2015 to present (November 11, 2019).
(1) Risk is tightly managed, relative to the winners, and losing positions will be exited before the market moves too far against.
The biggest losing trade on Bitcoin, for the time period outlined above, is -18.47%.
(2) Following the EMASAR buy and sell signals guarantees that one will not miss out on a major trend. As a result of the indicators used for this system it is mathematically impossible for a major trend to occur without providing a buy or sell signal. This system isn't meant to catch exact tops or bottoms but it will do a great job of capturing ~85% of a trend.
(3) On average the winning trades will be 5.55 times the losing trades. There will be stretches where the losers are bigger than the winners and this could last for many months, maybe even a year. However, over the long run the average reward is expected to be 5.55 times the average risk*.
*Past performance does not guarantee future results!
(4) This indicator was designed to capitalize on parabolic markets, specifically Bitcoin and alt coins. Crypto markets have a tendency to get moving so fast that many indicators become all but useless.
Entries can get signaled too late and exits will get signaled way too early. This is specifically true when using oscillators that are designed to identify overbought or oversold environments. EMASAR does a great job of keeping us in a position for the duration of a trend and this includes the major parabolic runs that Bitcoin has a tendency to go on.
Take a look at the two charts below which illustrates the buy and sell signals that occurred at the beginning and end of the 2017 and 2019 parabolic moves. Green = Buy | Blue = Exit | Red = Short
Long signaled at $4,190.27 on September 29th, 2017
Exit signaled at $13,647 on January 14th, 2018
Short signaled at $12,050 on January 16th, 2018
Close Short signaled at $3,684 on February 18th, 2019
Long signaled at $3,684 on February 18th, 2019
Exit signaled at $9,614 on July 16th, 2019
Short signaled at $10,328 on July 22nd, 2019
When Bitcoin, or other alts, really get moving it can be very difficult to distinguish between a correction and a full reversal. We do not want to be exiting during a minor correction, instead this is a time when we want to be holding on or looking to buy the dip.
This is a very fragile balance. The market has a very strong tendency to make corrections looks like reversals and to make reversals look like corrections. Therefore it is very important to have a tool(s) that you trust to distinguish in between the two.
I believe that EMASAR is the best way to find that balance - if I knew of a better way then I would be using it instead!
Following these signals will help us to hold onto positions while the market is still trending in our favor when most think that it has moved too far / too fast, and it will also get us out before a market fully reverses.
Keep in mind that there will be times when we exit a market that is in danger of reversing, only to buy back higher later on. That is okay because it enables us to properly manage risk during times of uncertainty and buying back in at a higher price is more than worth the opportunity cost.
Lets look at the signals above in chronological order:
1) Close Long: $2,274
2) Open Short: $2,347
3) Exit Short: $2,934
4) Open Long: $2,766
5) Close Long: $3,124
6) Enter Long: $4,190
A long was closed at $2,274 after Signal #1 and was re-entered after Signal #4 at $2,766. Additionally a long was closed at $3,124 after Signal #5 and was re-entered on the following signal at $4,190. These are examples of some of the bad signals that will occur. Something to pay attention to is the ratio of the risk to the reward. When the market turns against us EMASAR will quickly signal an exit or a re entry.
EMASAR also works great in traditional markets. The S&P 500 has been on a tear lately after creating new all time highs in October of 2019. It has resumed it's strong bull trend and therefore it is a great market to have long exposure to. That being said we are well overdue for a correction and most people, including myself, expect the next bear market to be much more severe than the last two. Therefore I would not want to have long exposure unless equipped with a very reliable method for taking profit before it fully reverses.
Let's take a look at the S&P 500 weekly EMASAR signals using the preferred settings outlined below:
In August of 1990 EMASAR signaled a 'Close Long' at $308. At that time the market was in danger of fully reversing. When that didn't happen EMASAR gave a signal to re enter at $369 which resulted in losing 19.8% in opportunity cost. That is quite okay because it would have allowed us to properly protect ourselves in the event that the market proceeded to crash. Instead we entered a massive bull market that culminated in the dot com bubble. Notice how EMASAR kept us in for the entire duration of that bull run and then signaled an exit very close to the top at $1,294. It got us back in by the end of 2004 after the market had bottomed. Yet again it kept us in for the following multi year bull market before signaling an exit very close to the top at $1,270.
The action that followed in 2016 looks very similar to what happened in 1990 - 1991. An exit was signaled when the market was in danger of fully reversing. When that didn't happen a re entry was signaled 14% higher. Now the market appears to be taking off in another parabolic advance. There is no way to know how far this next run will go or how long it will last. Nevertheless I feel highly confident that I will be able to hold on for the majority of the trend and then get fully out before it reverses thanks to the signals provided by EMASAR.
When looking at the signals on Gold we will notice striking similarities to the signals in the S&P 500 as well as Bitcoin.
Notice how an entry was signaled very close to the bottom at $323 in June of 2002. An exit was also signaled very close to the top at $1,441 in April of 2013. Throughout that runup there was one bad signal that cost some opportunity. It's very important to understand that missing out on opportunity is well worth the price because it allows us to effectively manage risk. EMASAR also recently provided a long signal at $1,401 which preceded this recent runup.
Settings
Default settings work best for crypto, however the time multiplier should be adjusted for markets that are not open 24/7. For commodities and FOREX my default is 40 and for stocks I use 24. The Moving Averages can be adjusted as well. The period can be changed and you can also select SMA or EMA. I always use the EMA's and strongly prefer the 50 and 200. We have noticed good results with the 9 and 54 EMA's as well. The shorter the period that the Moving Average is set to the more frequent the signals will be. This will generally improve risk:reward while decreasing strike rate. For crypto the best time frames are the 4h and 6h. For traditional markets the best time frames are the Daily, 3D and Weekly. EMASAR can be used on smaller time frames as well, specifically in crypto. The 15m and 1h have shown good results.
Risks
The biggest risks with trading EMASAR revolve around disobeying the signals. Risk management is built into this system with the exit signals that will occur, however it is up to the individual to execute those signals. Passing on an exit signal could lead to a big loss which would have a dramatic impact on the ROI. Most trading systems will have small and medium losses with small, medium and large wins. That is exactly how this works. The small - medium losses and wins will mostly be a wash and will account for roughly 80% of the trades. The large wins will happen about 20% of the time and will make up 80% - 90% of the profits.
Therefore the two biggest risks are passing on signals entirely, or exiting preemptively. Getting chopped in and out of a market can be quite frustrating. If you become overwhelmed with negative emotions then it could cause you to pass up on the next signal. That signal will often be the one that more than makes up for the small - medium losses that preceded.
On average EMASAR will provide one signal every 6 weeks when using the default settings on the 4h chart. Therefore missing one entry could turn an otherwise profitable year into a loser. If electing to trade a system, whether it is EMASAR or another, it is crucial to commit to taking every signal regardless of outside variables (namely your personal bias about market direction or frustration that follows a losing stretch).
Another major risk with this system is taking too much profit too soon. When getting into a trade that has the potential to be a big winner it can be challenging to continue holding through the swings. Anyone that has watched paper profits vanish will be inclined to start exiting after the market makes a big move in his or her favor. While this is better than watching profits completely evaporate, this mistake can be enough to turn a profitable system into one that loses to the market. If 80% - 90% of our profits come from 10% - 20% of our trades then it is vital we do not cut those positions off at the knees.
If taking too much profit too soon then you will consistently turn potential large winners into medium winners. This may lead to making money over the long run which will make it very difficult to realize that anything is wrong. However making money and beating the market are two very different things. Exiting early and making money is nearly as big of a risk as missing entries entirely.
If you have the discipline to execute signals in a timely manner after they are triggered and the emotional control to let the winners run despite the appearance of a vastly overbought / oversold market, then you should have what it takes to beat the market with EMASAR.
If you are not an experienced trader then it is very important to start out small. The only way to learn is to trade in a live environment and the only way to succeed is to risk much less than you can afford to lose. If you have $2,000 to trade with then start with a maximum position size of $20 - $50 and don’t be shy about scaling that down even further. Focus on ROI instead of actual dollars made. If you can return 100% on a $20 roll then you should be able to do the same with a $2,000 roll.
Important Notes
Make sure that you read / understand the risks outlined above. If you jump into this without understanding the unique risks that this system entails then you are going to have a bad time.
This indicator was developed around the 4h and that is where it works best. For crypto adjusting to higher TF’s will cause for bad results as the entries / exits will be late to the party. For traditional markets the Daily - Weekly time frames are preferred. It was not originally intended for smaller TF's but we have seen some good results on the 15m and 1h. The RSI can be a great compliment when using on smaller TF's. Adding a rule for not entering when RSI > 75 or < 25 and instead entering when RSI retests 50 will help to avoid some bad signals.
Alerts can be set for this indicator. Simply make sure that it is visible on the chart, then click the alert icon on the top panel. In the first dropdown set 'Condition' to 'EMASAR' and the second 'Condition' for the upcoming signal. For example if just entered long then set the second condition to 'Close Long' and you will be notified as soon as that signal occurs. If waiting for the next long entry then set the second condition to 'Open Long' so on and so forth. There is an 'All in One' alert that is also available. If you select that then you will be alerted any time that a signal occurs. The message will tell you to check the chart to see which signal caused the alert.
How to Buy
The EMASAR Indicator is available for purchase on my website. The link can be found in my signature or in the tagline of my Trading View profile.
The price is $500 per year which is only payable in Bitcoin. That also includes access to a private Telegram group.

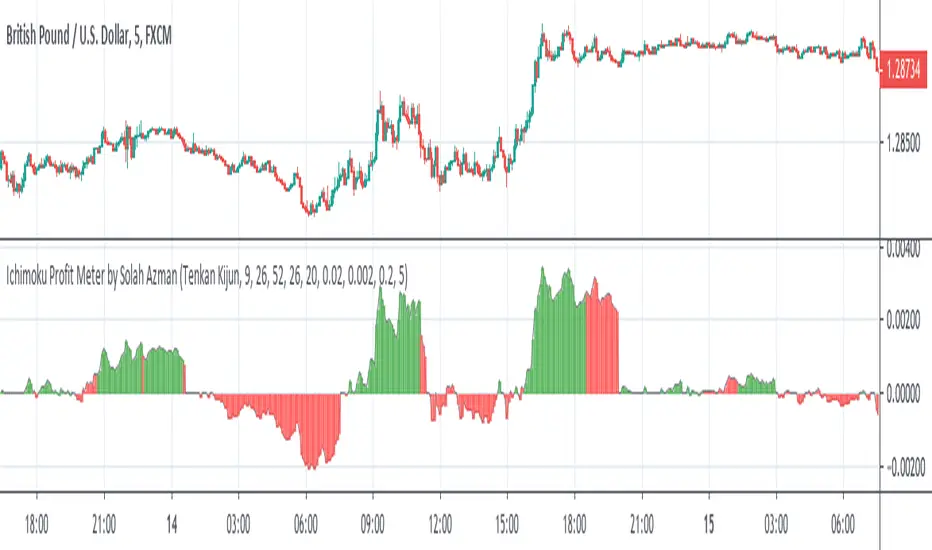
Ichimoku Profit Meter by Solah AzmanAims to simplify Ichimoku Cloud and filter out market consolidation. The graph shows price movement outside the Kumo(Cloud), i.e. if price crossover cloud at $1 and enters back the cloud at $1.50, the graph will show that price has moved $0.50. Tenkan Kinjun is the default SAR type but you may change it to your liking.
Dr_All indicators V1.0Free users have many restrictions on their use in TradingView.
I put together a lot of indicators I use often.
5 moving average
1 parabolic SAR
1 bollinger band
1 ichimoku cloud
(but it's only cloud)
as always
It's open source.
enjoy!

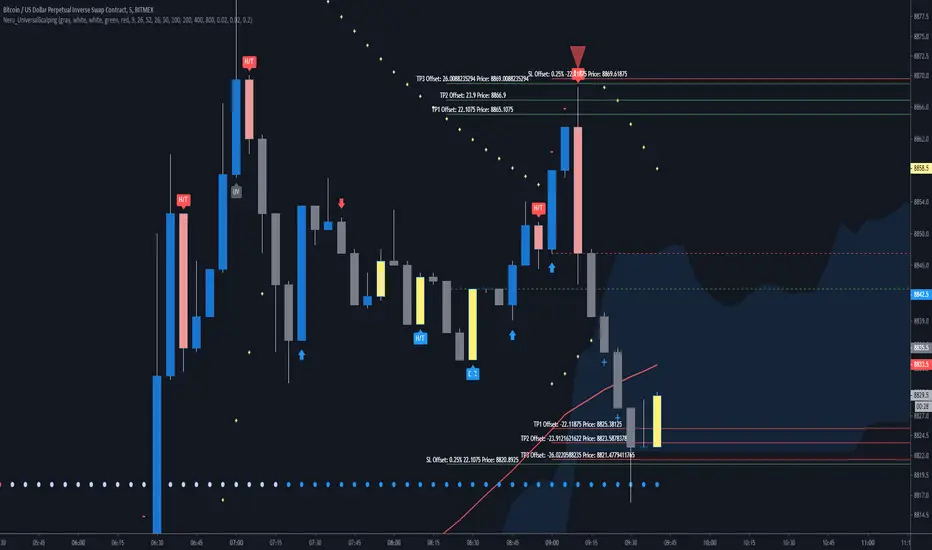
Neru_UniversalScalpingNeru_UniversalScalping - Tool
Markets: All markets, this is a universal tool which is using 100% standard settings for all built-in indicators.
Interval: 3 minutes to maximum 2 hours.
Built-In indicators:
- Basic Candlesticks (E/R as stronger one and H/T as weaker one)
- Stochastic breakups and breakdowns shown in different candle colors (close, 20 and 80)
- Extreme overbought and oversold conditions marked with a + an - (Stochastic >95 and <5)
- Daily and 4H Pivot Points
- Ichimoku Cloud (including Senkou´s, Tenkan + Kijun)
- 5 SMA´s (50,100,200,400 and 800)
- TrendEvaluator at the bottom, showing a basic trend (calculated from the cloud and 3 Moving Averages, 50, 100 and 200)
- Temporary buying + selling pressure labelled as arrows above and below candles
- Standard Parabolic Sar built-in
Risk Management:
You have the option to plot a basic risk calculation into the charts, based on the assumption, you don´t use a leverage and 100% equity.
Shown is a stop loss offset, the % and the price. Same goes for 3 take profits. Fees and spread are NOT included in this calculations.
You can choose between 0.25%, 0.5%, 1% and 1.5%, obviously the smaller the timeframe, the smaller risk you need to consider.
General Information:
All settings are adjustable, also in color and position.
This is not an automated system, that is generating entries and exits. With help of the built-in alarms you will have always to consider
the environment such as the trend, the relative position to the Pivot Points, the relative position to the Moving Averages and for example
conditions such as oversold / overbought and key-levels. It´s not replacing a human.
Please always be aware that counter trades on pullbacks are always more risky than trend-follow trades and a beginner should stick to less risk.
Warm regards, Neru
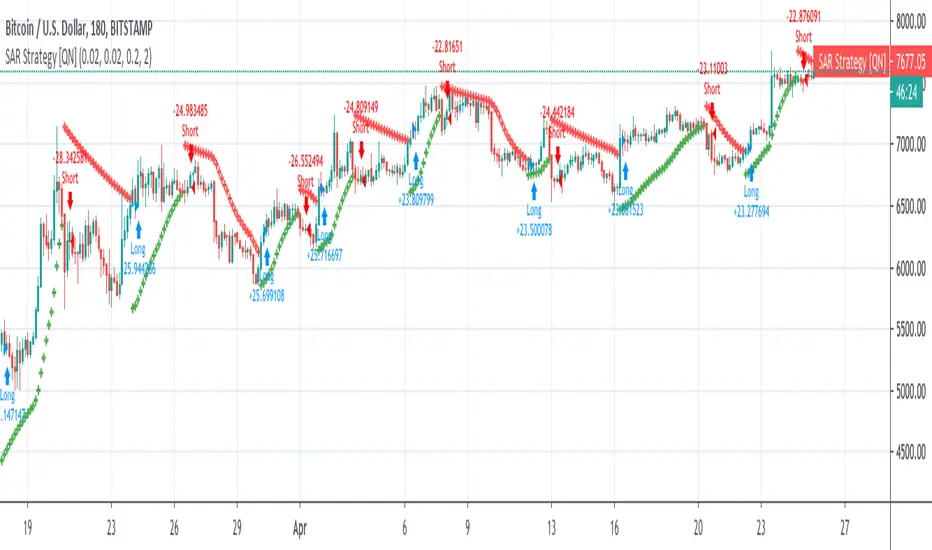
[STRATEGY] Parabolic SARA private strategy from the Profitable Parabolic SAR preview for backtesting purposes.
Moving Averages (21, 55, 200) with Parabolic SAR and Support/ ReA Simple indicator combining 3 of the most popular simple moving averages; (21,55, 200) with a tweaked Parabolic SAR as well as recent support & resistance points.
Developed to help see key areas of interest on COINBASE:BTCUSD quickly without needing to draw many manual trendlines in order to trade breakouts or bounces at key levels. But should be useful for any market.
This indicator is best used in combination with oscillators such as the MacD or RSI and also volume.


PRISMpSAR derived oscillator with its set of RSI & StochRSI and MAJestic (Momentum, Acceleration, Jerk) Oscillators Set
pSAR and MAJ oscillators can be disabled and hidden.
~ * ~ * ~ * ~ * ~ * ~ * ~ * ~ * ~ * ~ * ~ * ~ * ~ * ~ * ~ * ~ * ~ * ~ * ~ * ~ * ~
Note:
In no way is this intended as a financial/investment/trading advice. You are responsible for your own investment decisions and trades.
Please exercise your own judgement for your own trades base on your own risk-aversion level and goals as an investor or a trader. The use of OTHER indicators and analysis in conjunction (tailored to your own style of investing/trading) will help improve confidence of your analysis, for you to determine your own trade decisions.
~ * ~ * ~ * ~ * ~ * ~ * ~ * ~ * ~ * ~ * ~ * ~ * ~ * ~ * ~ * ~ * ~ * ~ * ~ * ~ * ~
Please check out my other indicators sets and series, e.g.
LIVIDITIUM (dynamic levels),
AEONDRIFT (multi-levels standard deviation bands),
FUSIONGAPS (MA based oscillators),
MAJESTIC (Momentum/Acceleration/Jerk Oscillators),
PRISM (pSAR based oscillator, with RSI/StochRSI as well as Momentum/Acceleration/Jerk indicators),
PDF (parabolic SAR /w HighLow Trends Indicator/Bar-color-marking + Dynamic Fib Retrace and Extension Level)
and more to come.
Constructive feedback and suggestions are welcome.
If you like any of my set of indicators, and it has benefited you in some ways, please consider tipping a little to my HRT fund. =D
cybernetwork @ EOS
37DzRVwodp5UZBYjCKvVoZ5bDdDqhr7798 @ BTC
MPr8Zhmpsx2uh3F5R4WD98MRJJpwuLBhA3 @ LTC
1Je6c1vvSCW7V2vA6RYDt6CEvqGYgT44F4 @ BCH
AS259bXGthuj4VZ1QPzD39W3ut4fQV5giC @ NEO
rDonew8fRDkZFv7dZYe5w3L1vJSE51zFAx @ Ripple XRP
0xc0161d27201914FC0bAe5e350a193c8658fc4742 @ ETH
GAX6UDAJ52OGZW4FVVG3WLGIOJLGG2C7CTO5ZDUK2P6M6QMYBJMSJTDL @ Stellar XLM
xrb_16s8cj8eoangfa96shsnkir3wctdzy76ajui4zexek6xmqssweu85rdjxrt4 @ Nano
~ JuniAiko
(=^~^=)v~
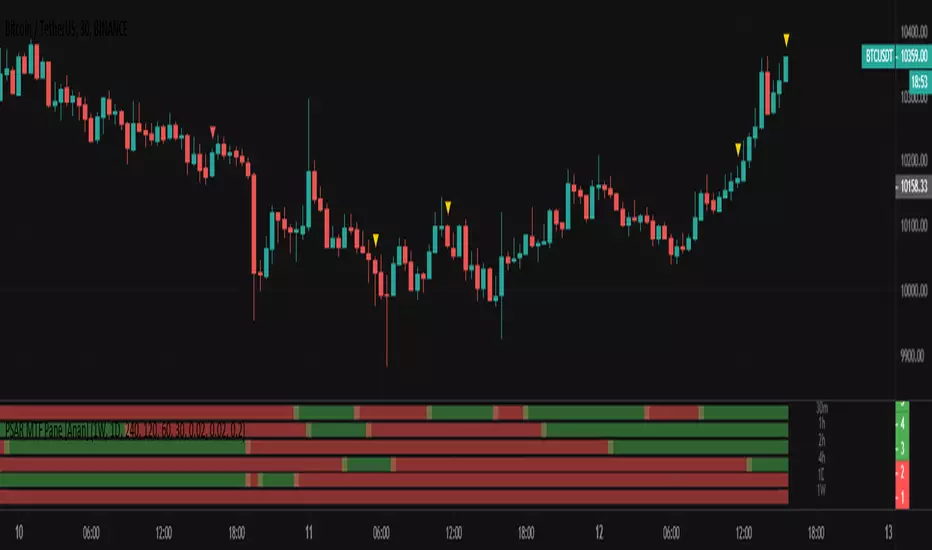
PSAR MTF Pane [Anan]Hello Friends,
My lovely pane now for built-in Parabolic SAR
Green : Bullish Parabolic SAR
Red : Bearish Parabolic SAR
No Green/No Red : The turning point
PDF {pSAR /w HiLo Trends + Fib Retrace/Extension Levels}parabolic SAR /w HighLow Trends Indicator/Bar-color-marking + Dynamic Fib Retrace and Extension Level
~ * ~ * ~ * ~ * ~ * ~ * ~ * ~ * ~ * ~ * ~ * ~ * ~ * ~ * ~ * ~ * ~ * ~ * ~ * ~ * ~
Note:
In no way is this intended as a financial/investment/trading advice. You are responsible for your own investment decisions and trades.
Please exercise your own judgement for your own trades base on your own risk-aversion level and goals as an investor or a trader. The use of OTHER indicators and analysis in conjunction (tailored to your own style of investing/trading) will help improve confidence of your analysis, for you to determine your own trade decisions.
~ * ~ * ~ * ~ * ~ * ~ * ~ * ~ * ~ * ~ * ~ * ~ * ~ * ~ * ~ * ~ * ~ * ~ * ~ * ~ * ~
Please check out my other indicators sets and series, e.g.
LIVIDITIUM (dynamic levels),
AEONDRIFT (standard deviation bands),
FUSIONGAPS (MA based oscillators),
MAJESTIC (Momentum/Acceleration/Jerk Oscillators),
PRISM (pSAR based oscillator, with RSI/StochRSI as well as Momentum/Acceleration/Jerk indicators),
and more to come.
Constructive feedback and suggestions are welcome.
~ JuniAiko
(=^~^=)v~

