JaeRSI+What is JaeRSI++
🥇 It is an indicator that detects and displays the RSI of the upper frame one step at a time
- It is no different from normal RSI but, u can see the RSI of the upper frame together
- Works based on 5m 15m 1h 4h 1d 1w
🥇Also, if the RSI is (over 70↗️) or (less than 30↘️), changes the background color
- If the background color is continuous, it is recommended to check the frame one step higher
🥇 Meaning of table (table)
- "🌈", RSI, Main, Danger in order
- RSI: It is divided into 5, 15, 60, 240 and indicates the current RSI of each frame (the background color is different from RSI : 33.0 below / 67.0 above)
- Main: Estimate the mainframe
If the previous 14 candles have entered the Danger zone (RSI : below 33.0 / above 67.0) or oversold/number, the corresponding frame is marked as the main frame.
- Danger: If abnormal RSI motion is detected (beam shape) due to sudden surge/fall in a frame, it warns that the frame may be the main frame.
==================================================================================
JaeRSI++란?
🥇 상위 프레임의 RSI를 추가로 표시해 주는 RSI 지표입니다
- 일반 RSI와 알고리즘의 차이가 없으나 상위 프레임의 RSI를 함께 볼 수 있습니다 (빨간 선으로 표시)
- 5m 15m 1h 4h 1d 1w 기준으로 작동합니다
🥇또한 RSI가 (70 이상↗️) 또는 (30↘️)인 경우 배경색을 변경합니다
- 배경색이 연속적인 경우 프레임을 한 단계 높게 확인하는 것이 좋습니다
🥇표(테이블)의 의미
- 순서대로 시간프레임 , RSI , 메인 , 위험
- RSI : 5, 15, 60, 240으로 나뉘어져 각각 프레임의 현재 RSI를 나타낸다 (33.0 아래 / 67.0 위 부터 배경색이 달라짐)
- 메인 : 메인프레임을 추정한다
이전 14개 캔들안에 꺵판존(33.0 아래 / 67.0 위) or 과매도/수에 들어간 적이 있다면 해당 프레임을 메인프레임으로 표시한다
- 위험 : 어떤 프레임에서 급등/급락하여 비 정상적인 RSI의 움직임이 감지된다면(빔 형태) 해당 프레임이 메인 프레임일 수 있다고 경고한다
Relative Strength Index (RSI)

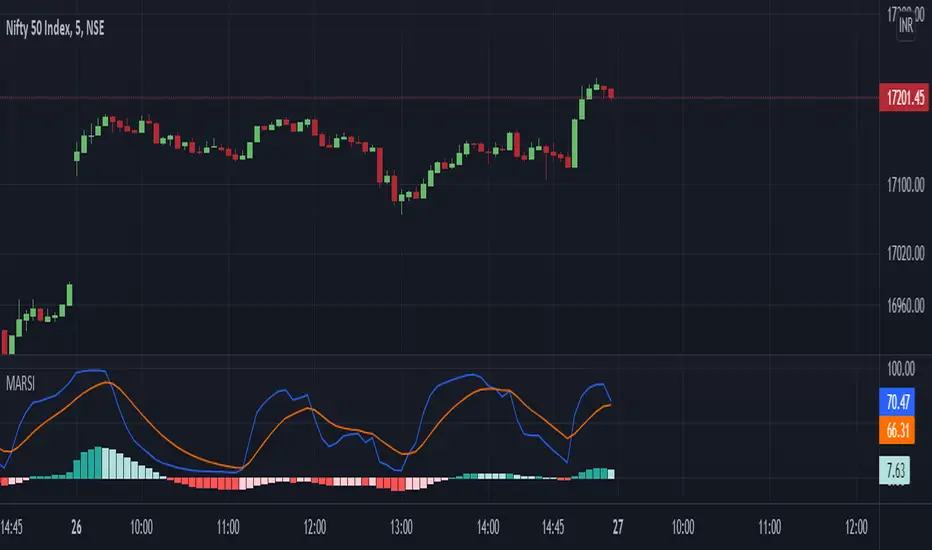
MARSIAn advanced version of MACD and RSI combined, where moving averages gives quality early signals along with the strength of Histogram. This Version of MACD helps traders to understand strength in the Histogram and possibilities of a reversal. Indicator also gives Early Indications of trend shift.
MACD input options Given to User
The Indicator draws MACD and MACD Histogram
Based on histogram Value RSI is Plotted and RSI Based EMA is Plotted as MARSI line and Signal Line
Calculations :
MACD Line: (12-day EMA - 26-day EMA)
Signal Line: 9-day EMA of MACD Line
MACD Histogram: MACD Line - Signal Line
MARSI Line : RSI Value of MACD Histogram
Signal Line : 9-day EMA of Marsi Line
Just Another RSIThis is slightly different implementation of RSI using arrays. But, it also comes with a twist.
Formula for standard RSI can be found here: www.investopedia.com
If there is green candle, gain for the candle is equal to price movement from previous bar and loss for that candle is 0. Similarly in case of red candle, loss is considered to be movement from previous candle whereas gain is 0. Also, as mentioned in step2, on each bar, average of previous bar gains/losses are merged with present candle gain/loss.
New Process
Gain is considered only on green candles. Hence, there is no zero gain candles
Loss is considered only on red candles. Hence, there is no zero loss candles
Average or median of last N gains and losses are considered. Hence, the movement mainly tell us the strength between bullish and bearish candles.
Let us forget about seeing it as overbought and oversold area and look at it as bullish and bearish region.
How it is different
Since, gain and loss are only considered if there are gain and loss, this index represents the strength between bullish and bearish candles without looking at price movement. Hence, the index has capability to go in opposite direction of the price representing price movement is not supported by strength.
Another advantage of this implementation is it allows using variable length for the method. In case of RSI, length has to be constant. It cannot be variable which can change every bar. But, we do not have that constraint in this implementation due to use of arrays.
At present, this is purely experimental. I will look forward to study this more with respect to divergence and for use in trend following methods.
RSI MTF Ob+OsHello Traders,
This indicator use the same concept as my previous indicator "CCI MTF Ob+Os".
It is a simple "Relative Strength Index" ( RSI ) indicator with multi-timeframe (MTF) overbought and oversold level.
It can detect overbought and oversold level up to 5 timeframes, which help traders spot potential reversal point more easily.
There are options to select 1-5 timeframes to detect overbought and oversold.
Aqua Background is "Oversold" , looking for "Long".
Orange Background is "Overbought" , looking for "Short".
Have fun :)

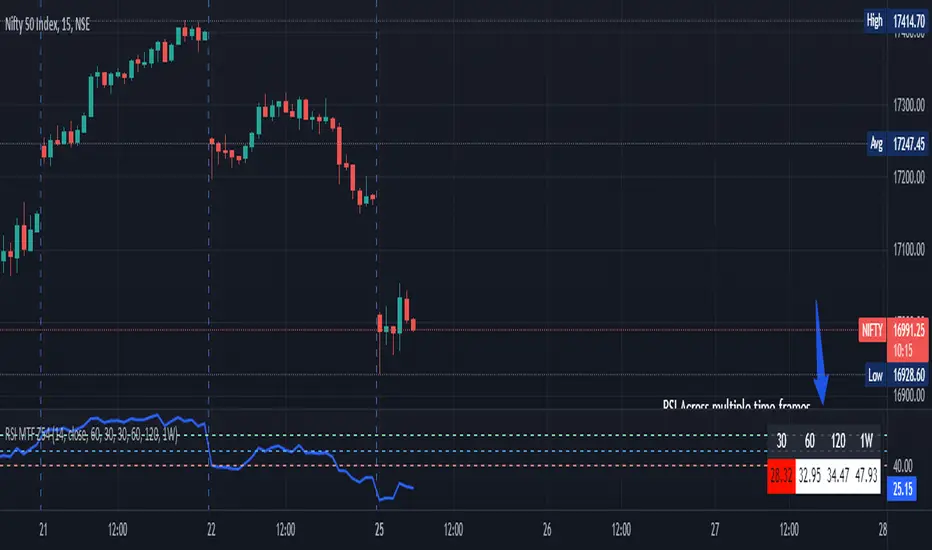
RSI Multi Time Frame (MTF). Fully customizable. [Zero54]NSE:NIFTY
An easy to read Multi Time Frame RSI that does not take too much space. All parameters and colors are customizable. Please feel free to give your suggestions. Feel free to modify the code as per your liking. Like this if you find this useful.
TMA-LegacyThis is a script based on the original TMA- RSI Divergence indicator by PhoenixBinary.
The Phoenix Binary community and the TMA community built this version to be public code for the community for further use and revision after the reported passing of Phoenix Binary (The community extends our condolences to Phoenix's family.
The intended uses are the same as the original but some calculations are different and may not act or signal the same as the original.
Description of the indicator from original posting.
This indicator was inspired by Arty and Christy .
█ COMPONENTS
Here is a brief overview of the indicator from the original posting:
1 — RSI Divergence
Arty uses the RSI divergence as a tool to find entry points and possible reversals. He doesn't use the traditional overbought/oversold. He uses a 50 line. This indicator includes a 50 line and a floating 50 line.
The floating 50 line is a multi-timeframe smoothed moving average . Price is not linear, therefore, your 50 line shouldn't be either.
The RSI line is using a dynamic color algo that shows current control of the market as well as possible turning points in the market.
2 — Smoothed RSI Divergence
The Smoothed RSI Divergence is a slower RSI with different calculations to smooth out the RSI line. This gives a different perspective of price action and more of a long term perspective of the trend. When crosses of the floating 50 line up with the traditional RSI crossing floating 50.
3 — Momentum Divergence
This one will take a little bit of time to master. But, once you master this, and combined with the other two, damn these entries get downright lethal!

Stochastic RSI HeatmapStochastic RSI presented as a heatmap starting from the oversold (20) / overbought (80) levels respectively. The more oversold / overbought the price, the more intense the color (blue / fuchsia).

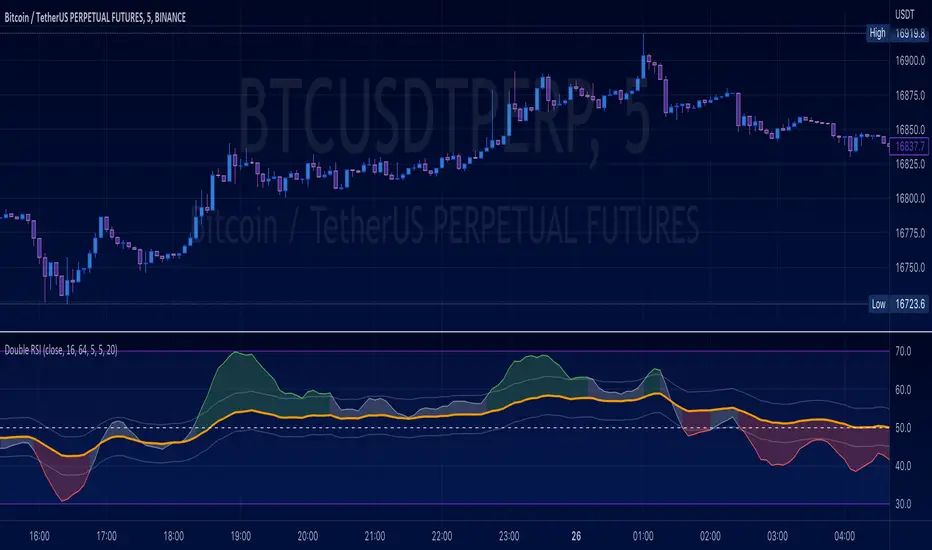
Double RSI Fast & Slow
Double RSI, fast & Slow.
This indicator is intended to track trends based on RSI with a threshold for proximity.
Oversold, overbought channel.
Threshold for proximity.
Color coded line values.
RSI Local TrendA simple indicator using two RSIs.
Conditions for buy:
RSI(slow) < RSI(fast) and RSI(slow) < long_trigger
Conditions for sell:
RSI(slow) > RSI(fast) and RSI(slow) > short_trigger
It is recommended to use in small timeframes for scalping.
Recommended settings:
slow = 3
fast = 14
long_trigger = 30
short_trigger = 70
In markets where there is very high volatility, it is recommended to change the trigger parameters:
long_trigger = 20
short_trigger = 80

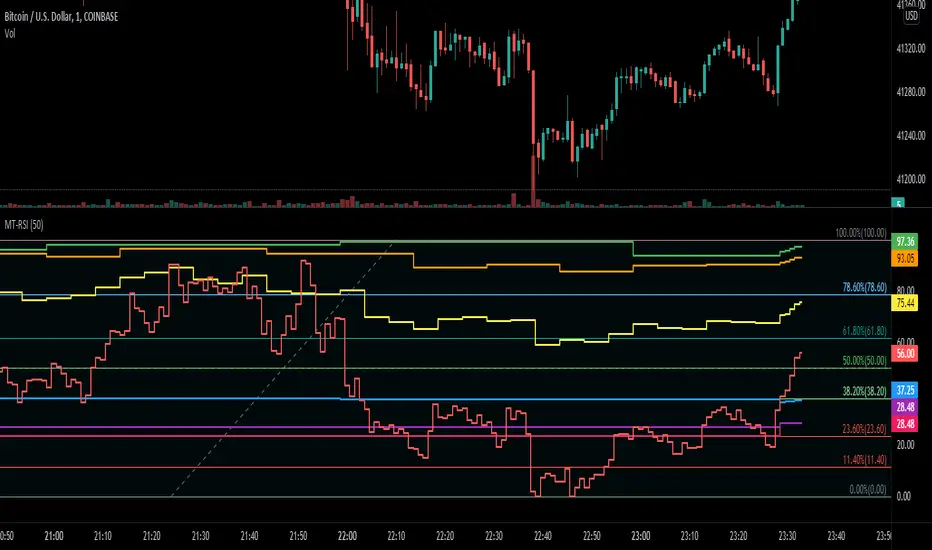
MT-RSIThis script shows a "Multi Timeframe RSI" for a range. You could use this script to quickly detect if the RSI of the higher and lower timeframes are overbought or oversold.
RSI is relative to a lower timeframe. So 1H is relative to the 4H and the 4H relative to the 1D chart etc...
In this example you can see that the 1H timeframe (green line) is performing well but is in overbought territory, but the 4H timeframe (blue line) dit not perform that great relative to the 1H timeframe.
TotalCap RSI and Pressure CandleCandles and areas where force is applied.
Special to see divergences and possible Order Blocks
The RSI is applied on the TOTALCAP to be able to visualize when the entire market is in turning conditions

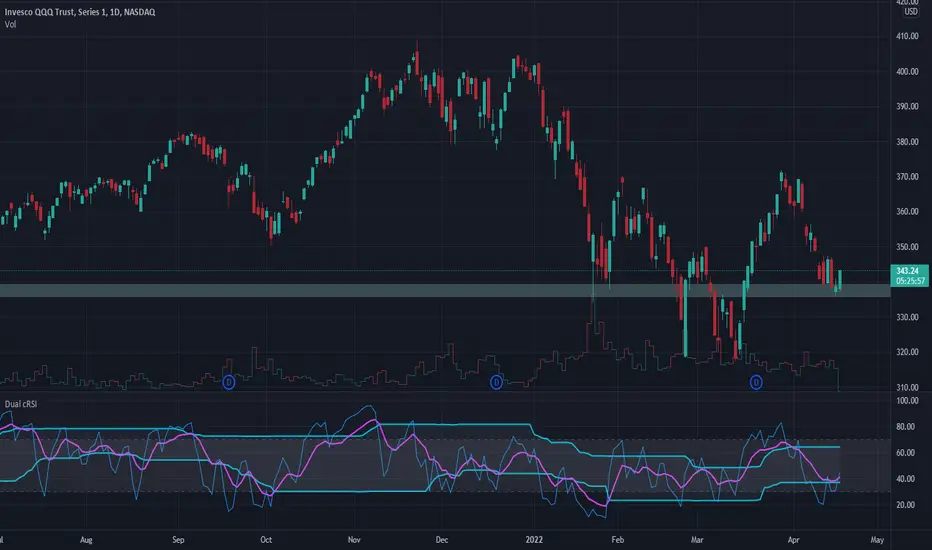
Dual RSI cyclic smoothedThis script is an updated version of the cRSI.
It add a short cycle (5 period) RSI to the mix, so see the violent move.
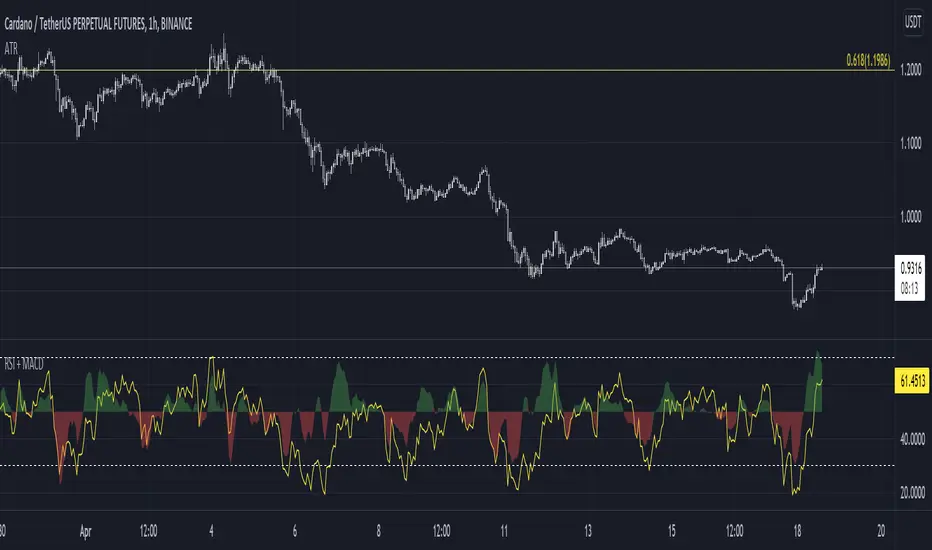
RSI + MACDRSI and MACD in one simplified indicator. Why? Because :
1. Save chart space, declutter, make decision making better, faster
2. MACD is not scaled to RSI range, now it is so you can have side by side comparison
Example how to use:
Enter on RSI oversold or overbought level, then exit on MACD crossover
See if there is an extra confluence to enter, hold or exit your trades, i.e oversold and falling macd is better than oversold and rising macd for short trades potentially.
RSI Wave SignalsQuick Description: Smoothed RSI with optimized trailing moving average. Look for cross above or cross under signals for buy and sell orders respectively.
VIDYA moving average of RSI incorporated with "optimized trend tracker" system. Thanks to kivancozbilgic and anilozeksi for implementing this great idea on Tradingview. The indicator adds "1,000" to the RSI MA values for more natural and accurate percentage trailing.
Settings:
- Period MA is the moving average length of the blue line
- Trailing Percentage of MA adjusts the percentage (sort of) trailing level of the moving average.
- RSI Length adjusts the rsi length in calculation.
Trading Tips:
- System might be enhanced by taking signals only on "oversold" or "overbought" territories (i.e <~1020 or >~1080)
- Adjust position size of by 4 times of atr(length=14)
- Take 50% of position as profit when position reaches the 4*atr TP Level (breakeven)
- Let the rest ride.
- Best performing on short frequencies such as 1, 3, 5 mins.

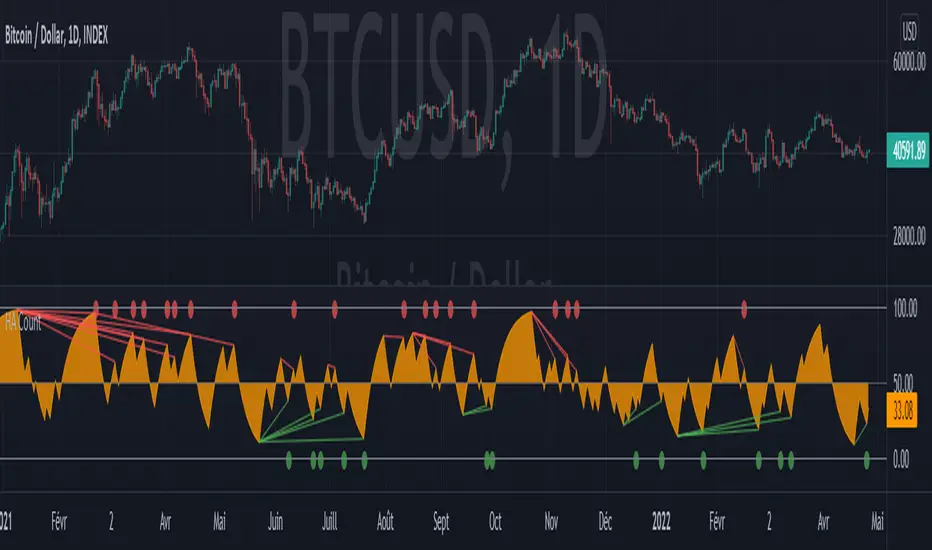
Heikin Ashi CountObjective:
This indicator aims to obtain an oscillator indicating the trend of a market by minimizing noise through the use of Heikin Ashi candles.
The idea is to make the oscillator tend towards 100 at each bullish Heikin Ashi candle, and inversely towards 0 when bearish.
The advantage is that this indicator has little noise compared to the RSI, but also little lag compared to the Schaff Trend Cycle, which are the two indicators that inspired me to create this one.
Usage:
As a general rule, below 15, HA Count indicates an oversell and above 85 an overbuy.
Setting the length for the candle count results in an indicator that is less sensitive when close to 1 and more sensitive when it is at 2 or higher.
Chosen as the default value, 1.15 seems to give the best indications, regardless of the market or time period.
Also it looks very similar to the values that the RSI could give set over 14 periods, so it can be used in the same way. Especially with regard to divergences.
---- FR ----
Objectif :
Cet indicateur vise à obtenir un oscillateur indicant la tendance d'un marché en minimisant le bruit grace à l'utilisation des bougies Heikin Ashi.
L'idée est de faire tendre l'oscillateur vers 100 à chaque bougie Heikin Ashi haussière, et inversement vers 0 lorsque baissière.
L'avantage est que cet indicateur a peu de bruit comparé au RSI, mais peu de lag aussi comparé au Schaff Trend Cycle, qui sont les deux indicateurs qui m'ont inspiré pour la création de celui-ci.
Utilisation :
En régle général, en dessous de 15 HA Count indique une sur-vente et au-dessus de 85 un sur-achat.
Le paramétrage de la longueur pour le comptage de bougie permet d'obtenir un indicateur moins sensible lorsque proche de 1 et plus sensible lorsqu'il est à 2 ou supérieur.
Choisie comme valeur par défaut, 1.15 semble donner les meilleures indications, peu importe le marché ou la période de temps.
En outre cela ressemble beaucoup aux valeurs que pourrait donner le RSI régler sur 14 périodes, ainsi il peut être utilisé de la même manière. Notamment pour ce qui est des divergences.
Hotch DMI+OBV+RSI ConfluenceThis Indicator uses the Relative Strength Index, On Balance Volume, and ADX to identify viable trading trends.
A quick description of what is on display:
1.) Green Triangle = OBV crossing over OBV MA
2.)Red Triangle = OBV Crossing under OBV SMA
3.) The background coloring between the RSI Oversold and Overbought Values has multiple conditions.
----It is green when the DI+ > DI-
----It is purple when the DI+ < DI-
----the brightness represents the ADX value. Darker areas(or more transparent) show a weak ADX value(4). Brighter (or less transparent) show a stronger ADX value(3)
5.) RSI and RSI moving average, including a divergence indicator.
6.) A histogram representing the normalized value of OBV-OBVMA to show changes in value while remaining readably in range on the chart with other indicators.
In the included chart screen shot is an example of an applicable strategy. This example is no guaranteed success and is also not the only strategy applicable to the indicator.

RSI Swing Trading Setup (2-Period)A simple script that adjusts the RSI visibly in order to better accommodate swing trading and certain swing trading setups/strategies.
--------------------------------------------------------------------------------------------------------------------------------------------------------
Best used in conjunction with "Linear Regression Channel by LonesomeTheBlue" with 2.2σ (std.dev) and Show Fib Levels.
^Click image for a redirect to that script.
--------------------------------------------------------------------------------------------------------------------------------------------------------
In certain price action patterns:
A bearish reversal from a previously bullish move can indicate tops of a rally if the RSI moves from 0-40 to 60 (1)
A bullish reversal from a previously bearish move can indicate bottoms of a pullback if the RSI moves from 60-100 to 40 (2)
(USE THE LINEAR REGRESSION CHANNEL TO VALIDIFY THE RETRACEMENTS)
--------------------------------------------------------------------------------------------------------------------------------------------------------
(1)
--------------------------------------------------------------------------------------------------------------------------------------------------------
(2)
--------------------------------------------------------------------------------------------------------------------------------------------------------

RinarBottombuyRSI, VWMA, MA.
Altcon bottom signals.
buy
White background - bottom point
Yellow - Buy zone
White triangles - a signal to place orders
Sell
Red - sale
RU
RSI , VWMA , MA.
Сигналы дна альтконов.
Buy
Белый фон -точка дна
Желтый - Зона покупки
Белые треугольники - сигнал выставить ордера
Sell
Красный - продажа

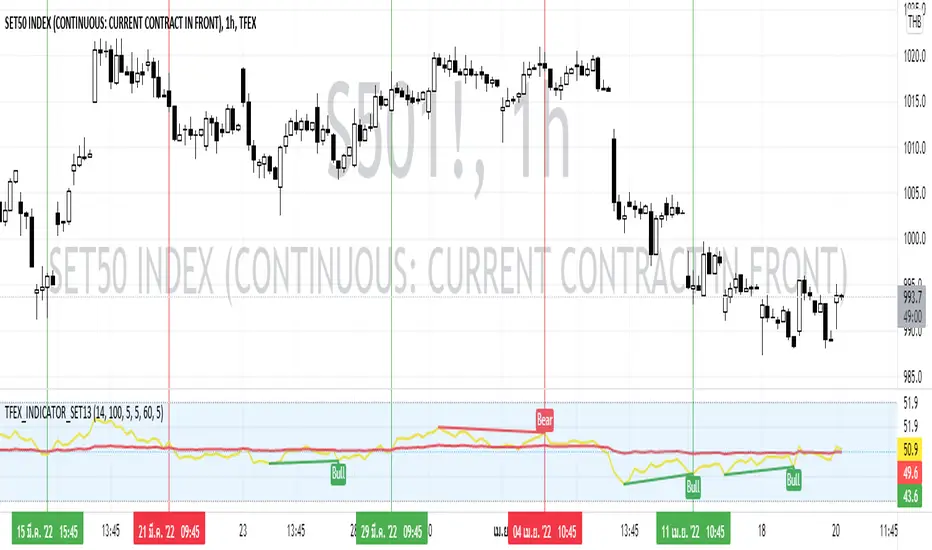
TFEX_INDICATOR_SET13This Indicator use the calculated RSI of the top 13 stocks that have the highest market capitalization in SET:SET50 where suitable for TFEX trading( TFEX:S501! ) .
Conducted with 2 RSI period as follow:
RSI Main (14)
RSI Average (100)
How to use:
1) Use this Indicator by Crossover
If the RSI Main Cross UP the RSI Average can assume as BUY SIGNAL
If the RSI Main Cross DOWN the RSI Average can assume as SELL SIGNAL
2) Use this Indicator by Divergence of RSI Main
If the RSI Main got any Regular Bullish or Hidden Bullish can assume as BUY SIGNAL
If the RSI Main got any Regular Bearish or Hidden Bearish can assume as SELL SIGNAL
3) The combination of Divergence and Crossover
If the RSI Main got any Regular Bullish or Hidden Bullish then pending for the RSI Main Cross UP the RSI Average which can assume as BUY SIGNAL
If the RSI Main got any Regular Bearish or Hidden Bearish then pending for the RSI Main Cross DOWN the RSI Average which can assume as SELL SIGNAL
Preferred Timeframe
4H
2H
1H
Bogdan Ciocoiu - CoordinatorDescription
The Coordinator is an indicator developed on the back of the RSI algorithm, modified substantially to form a cloud. In addition, the Coordinator uses EMA/SMA to compare the location of the RSI cloud with the chosen moving averages (EMA vs SMA).
This indicator is helpful as it confirms when a trader should enter a position or exit based on the proximity of the RSI cloud to the relevant MA.
Uniqueness
The Coordinator provides unique benefits, including:
It shows the strength of the RSI in the shape of the RSI cloud, using two sets of dimensions (one more long term and one more short-term oriented).
It indicates the positioning of the RSI cloud in conjunction with the relevant moving averages to help traders remain in positions for longer.
It shows the RSI 14 (useful when spotting divergences aligned with the price action).
Open-source
The Coordinator uses the following open-source scripts:
www.tradingview.com

Indicator Direction Table With Bullish & Bearish LabelsINDICATOR DIRECTION TABLE WITH BULLISH AND BEARISH LABELS
This is a table that shows the bullish, bearish or neutral trend for nine different popular indicators. Each indicator label will change color in real time to make you aware of each change in direction. This way you don’t have to read and analyze a bunch of different indicators constantly and you can focus on price action instead.
Look for the entire table to turn green or red before taking positions.
You can also set alerts for when the entire table of indicators is bullish or bearish.
The indicator settings allow customization of indicator lengths & values, table position and turning the indicator table on or off.
The length and other values for each indicator can be customized to suit your preferences, but by default all of them are set to the normal default settings that Tradingview supplies the indicators with. Typically 14 as the length.
The indicators used in this table are as follows:
MACD - Moving Average Convergence Divergence
Stochastic RSI - Stochastic Relative Strength Index
Vortex - Vortex Indicator
Momentum - Momentum Indicator
RSI - Relative Strength Index
PSAR - Parabolic Stop & Reverse
DMI - Directional Movement Index
MFI - Money Flow Index
Fisher - Fisher Transform Price Action
***MARKETS***
This indicator can be used as a signal on all markets, including stocks, crypto, futures and forex.
***TIMEFRAMES***
This indicator table can be used on all timeframes.
***TIPS***
Try using numerous indicators of ours on your chart so you can instantly see the bullish or bearish trend of multiple indicators in real time without having to analyze the data. Some of our favorites are our Auto Fibonacci, Directional Movement Index + Fisher Price Action, Volume Profile With Buy & Sell Pressure, Auto Support And Resistance and Money Flow Index in combination with this indicator direction table. They all have unique features to help you make better and faster trading decisions.

Relative Strength Index (OSC)Hello everyone, I'm sorry that the previous open-source version was hidden due to the house rules, I've re-edited the description and re-posted it
(1) Indicator introduction
This is RSI indicator with original divergence algorithm
This indicator is plotted on the RSI and can display the divergence locations and corresponding divergence intensity
The tolerance of N Klines at the top or bottom positions for price and indicator is supported, which is set by the "Tolerant Kline Number"
Support the display of divergence intensity, that is, the REG/HID value displayed on the label, which is less than 0. The smaller the intensity value, the more obvious divergence
Support the filtering of divergence intensity, which is set by "Cov Threshold". The divergence that REG/HID divergence intensity greater than this value will be ignored
In the label, REG indicates regular top/bottom divergence while HID indicates hidden top/bottom divergence
In the label, SRC(x-y) indicates a divergence occurred from the x-th kline to the y-th kline
In the label, OSC(x-y) indicates a divergence occurred from the indicator corresponding to the x-th kline to the y-th kline
(2) Parameter introduction
- RSI Settings
Source: The source to calculate RSI, close by default
RSI Length: The length of RSI, 14 by default
- RSI Divergence
Pivot Lookback Right: Number of K-line bars recalling the pivot top/bottom point to the right
Pivot Lookback Left: Number of K-line bars recalling the pivot top/bottom point to the left
Max of Lookback Range: Maximum number of retracing K-line bars to find the pivot top/bottom point
Min of Lookback Range: Minimum number of retracing K-line bars to find the pivot top/bottom point
Tolerant Kline Number: Maximum tolerance in indexing top/bottom points of Klines and indicators
Cov Threshold: Divergence intensity, which is less than 0. The smaller the intensity value, the more obvious divergence
Plot Bullish: Whether to draw regular bullish divergence label
Plot Hidden Bullish: Whether to draw hidden bullish divergence label
Plot Bearish: Whether to draw regular bearish divergence label
Plot Hidden Bearish: Whether to draw hidden bearish divergence label
Happy trading and enjoy your life!
————————————————————————————————————————
各位朋友大家好,很抱歉之前的开源版本因为规则原因被隐藏,我已经重新编辑了说明并重新发布
(1) 指标说明
该指标绘制于 RSI 上,并在对应位置显示背离点以及背离程度
支持顶底位置 N 根K线的容差,由 Tolerant Kline Number 参数设置
支持背离强度的显示,即标签上显示的 REG/HID 值,该值小于 0,且越小说明背离程度越大
支持背离强度的过滤,由 Cov Threshold 参数设置, REG/HID 值大于这个值的背离会被忽略
标签中,REG 表示常规顶/低背离,而 HID 表示隐藏顶/底背离
标签中,SRC(x-y) 表示从当前第 x 根 bar 开始到第 y 跟 bar 出现背离
标签中,OSC(x-y) 表示从当前第 x 根 bar 所对应的指标开始到第 y 跟 bar 所对应的指标出现背离
(2) 参数说明
- RSI Settings
Source: 计算 RSI 指标的 source,默认为 close
RSI Length: 计算 RSI 指标的长度,默认为 14
- RSI Divergence
Pivot Lookback Right: 枢纽顶/底点往右回顾的 K线 bar 数量
Pivot Lookback Left: 枢纽顶/底点往左回顾的 K线 bar 数量
Max of Lookback Range: 回寻找枢纽顶/底点的最大回溯 K线 bar 数量
Min of Lookback Range: 回寻找枢纽顶/底点的最小回溯 K线 bar 数量
Tolerant Kline Number: K线和指标的顶/底点索引的最大误差
Cov Threshold: 背离程度,该值小于 0,且越小说明背离程度越大
Plot Bullish: 是否绘制常规底背离提示
Plot Hidden Bullish: 是否绘制隐藏底背离提示
Plot Bearish: 是否绘制常规顶背离提示
Plot Hidden Bearish: 是否绘制隐藏顶背离提示
祝大家交易愉快

Relative Strength Index (SRC)Hello everyone, I'm sorry that the previous open-source version was hidden due to the house rules, I've re-edited the description and re-posted it
(1) Indicator introduction
This is RSI indicator with original divergence algorithm
This indicator is plotted on the klines and can display the divergence locations and corresponding divergence intensity
The tolerance of N Klines at the top or bottom positions for price and indicator is supported, which is set by the "Tolerant Kline Number"
Support the display of divergence intensity, that is, the REG/HID value displayed on the label, which is less than 0. The smaller the intensity value, the more obvious divergence
Support the filtering of divergence intensity, which is set by "Cov Threshold". The divergence that REG/HID divergence intensity greater than this value will be ignored
In the label, REG indicates regular top/bottom divergence while HID indicates hidden top/bottom divergence
In the label, SRC(x-y) indicates a divergence occurred from the x-th kline to the y-th kline
In the label, OSC(x-y) indicates a divergence occurred from the indicator corresponding to the x-th kline to the y-th kline
(2) Parameter introduction
- RSI Settings
Source: The source to calculate RSI, close by default
RSI Length: The length of RSI, 14 by default
- RSI Divergence
Pivot Lookback Right: Number of K-line bars recalling the pivot top/bottom point to the right
Pivot Lookback Left: Number of K-line bars recalling the pivot top/bottom point to the left
Max of Lookback Range: Maximum number of retracing K-line bars to find the pivot top/bottom point
Min of Lookback Range: Minimum number of retracing K-line bars to find the pivot top/bottom point
Tolerant Kline Number: Maximum tolerance in indexing top/bottom points of Klines and indicators
Cov Threshold: Divergence intensity, which is less than 0. The smaller the intensity value, the more obvious divergence
Plot Bullish: Whether to draw regular bullish divergence label
Plot Hidden Bullish: Whether to draw hidden bullish divergence label
Plot Bearish: Whether to draw regular bearish divergence label
Plot Hidden Bearish: Whether to draw hidden bearish divergence label
Happy trading and enjoy your life!
————————————————————————————————————————
各位朋友大家好,很抱歉之前的开源版本因为规则原因被隐藏,我已经重新编辑了说明并重新发布
(1) 指标说明
该指标绘制于 K线 上,并在对应位置显示背离点以及背离程度
支持顶底位置 N 根K线的容差,由 Tolerant Kline Number 参数设置
支持背离强度的显示,即标签上显示的 REG/HID 值,该值小于 0,且越小说明背离程度越大
支持背离强度的过滤,由 Cov Threshold 参数设置, REG/HID 值大于这个值的背离会被忽略
标签中,REG 表示常规顶/低背离,而 HID 表示隐藏顶/底背离
标签中,SRC(x-y) 表示从当前第 x 根 bar 开始到第 y 跟 bar 出现背离
标签中,OSC(x-y) 表示从当前第 x 根 bar 所对应的指标开始到第 y 跟 bar 所对应的指标出现背离
(2) 参数说明
- RSI Settings
Source: 计算 RSI 指标的 source,默认为 close
RSI Length: 计算 RSI 指标的长度,默认为 14
- RSI Divergence
Pivot Lookback Right: 枢纽顶/底点往右回顾的 K线 bar 数量
Pivot Lookback Left: 枢纽顶/底点往左回顾的 K线 bar 数量
Max of Lookback Range: 回寻找枢纽顶/底点的最大回溯 K线 bar 数量
Min of Lookback Range: 回寻找枢纽顶/底点的最小回溯 K线 bar 数量
Tolerant Kline Number: K线和指标的顶/底点索引的最大误差
Cov Threshold: 背离程度,该值小于 0,且越小说明背离程度越大
Plot Bullish: 是否绘制常规底背离提示
Plot Hidden Bullish: 是否绘制隐藏底背离提示
Plot Bearish: 是否绘制常规顶背离提示
Plot Hidden Bearish: 是否绘制隐藏顶背离提示
祝大家交易愉快
