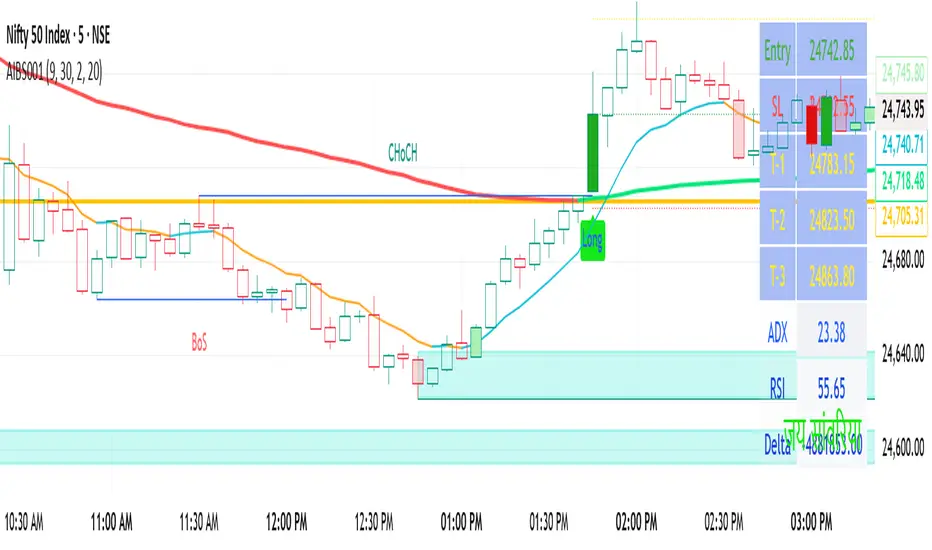
Wyichi AI 4.0Wyckoff logic : " Charles H. Dow and his colleague Edward Jones (Dow Jones & Company since 1882). The Dow Theory's final tenet is, "Trend Remains In Effect Until Clear Reversal Occurs." Dow Theorists look for "failure swings" and confirmations to give unambiguous signals of trend fatigue or trend reversal, according to this concept. Any pattern, whether it's a continuation pattern like a Flag Formation or a reversal pattern like Head & Shoulders , is designed to repeat itself over and over again."
Ichimoku : " An Ichimoku practitioner should be able to get a quick sense of sentiment, momentum, and trend strength by looking at an Ichimoku chart , Hosada was a fervent belief that market dynamics or behavior reflected human group dynamics. He felt that human conduct in their lives and relationships might be defined as a continual cyclical movement away from and back toward balance. "
Wyckoff + Ichimoku = Institutional Footprints ( Trade with the banks)
Indicator use Wyckoff pattern ( APD ) and Ichimoku pattern ( Phase ).... or Bermuda Triangle Pattern
Cerca negli script per "ai"
Combo 4+ KDJ STO RSI EMA3 Visual Trend Pine V5@RL! English !
Combo 4+ KDJ STO RSI EMA3 Visual Trend Pine V5 @ RL
Combo 4+ KDJ STO RSI EMA3 Visual Trend Pine V5 @ RL is a visual trend following indicator that groups and combines four trend following indicators. It is compiled in PINE Script Version V5 language.
• STOCH: Stochastic oscillator.
• RSI Divergence: Relative Strength Index Divergence. RSI Divergence is a difference between a fast and a slow RSI.
• KDJ: KDJ Indicator. (trend following indicator).
• EMA Triple: 3 exponential moving averages (Default display).
This indicator is intended to help beginners (and also the more experienced ones) to trade in the right direction of the market trend. It allows you to avoid the mistakes of always trading against the trend.
The calculation codes of the different indicators used are standard public codes used in the usual TradingView coding for these indicators.
The STO indicator calculation script is taken from TradingView's standard STOCH calculation.
The RSI indicator calculation script is a replica of the one created by @Shizaru.
The KDJ indicator calculation script is a replica of the one created by @iamaltcoin.
The Triple EMA indicator calculation script is a replica of the one created by @jwilcharts.
This indicator can be configured to your liking. It can even be used several times on the same graph (multi-instance), with different configurations or display of another indicator among the four that compose it, according to your needs or your tastes.
A single plot, among the 4 indicators that make it up, can be displayed at a time, but either with its own trend or with the trend of the 4 (3 by default) combined indicators (sell=green or buy=red, background color).
Trend indications (potential sell or buy areas) are displayed as a background color (bullish: green or bearish: red) when at least three of the four indicators (3 by default and configurable from 1 to 4) assume that the market is moving in the same direction. These trend indications can be configured and displayed, either only for the signal of the selected indicator and displayed, or for the signals of the four indicators together and combined (logical AND).
You can tune the input, style and visibility settings of each indicator to match your own preferences or habits.
A 'buy stop' or 'sell stop' signal is displayed (layouts) in the form of a colored square (green for 'stop buy' and red for 'stop sell'. These 'stop' signals can be configured and displayed, either only for the indicator chosen, or for the four indicators together and combined (logical OR).
Note that the presence of a Stop Long signal cancels the background color of the Long trend (green).
Likewise, the presence of a Stop Short signal cancels out the background color of the Short trend (red).
It is also made up of 3 labels:
• Trend Label
• signal Stop Label (signals Stop buy or sell )
• Info Label (Names of Long / Short / Stop Long / Stop Short indicators, and / Open / Close / High / Low ).
Each label is configurable (visibility and position on the graph).
• Trend label: indicates the number of indicators suggesting the same trend (Long or Short) as well as a strength index (PWR) of this trend: For example: 3 indicators in Short trend, 1 indicator in Long trend and 1 indicator in neutral trend will give: PWR SHORT = 2/4. (3 Short indicators - 1 Long indicator = 2 Pwr Short). And if PWR = 0 then the display is "Wait and See". It also indicates which current indicator is displayed and the display mode used (combined 1 to 4 indicators or not combined ).
• Signal Stop Label: Indicates a possible stop of the current trend.
• Label Info (Simple or Full) gives trend info for each of the 4 indicators and OHLC info for the chart (in “Full” mode).
It is possible to display this indicator several times on a chart (up to 3 indicators max with the Basic TradingView Plan and more with the paid plans), with different configurations: For example:
• 1-Stochastic - 2/4 Combined Signals - no Label displayed
• 1-RSI - Combined Signals 3/4 - Stop Label only displayed
• 1-KDJ - Combined Signals 4/4 - the 3 Labels displayed
• 1-EMA'3 - Non-combined signals (EMA only) - Trend Label displayed
Some indicators have filters / thresholds that can be configured according to your convenience and experience!
The choice of indicator colors is suitable for a graph with a "dark" theme, which you will probably need to modify for visual comfort, if you are using a "Light" mode or a custom mode.
This script is an indicator that you can run on standard chart types. It also works on non-standard chart types but the results will be skewed and different.
Non-standard charts are:
• Heikin Ashi (HA)
• Renko
• Kagi
• Point & Figure
• Range
As a reminder: No indicator is capable of providing accurate signals 100% of the time. Every now and then, even the best will fail, leaving you with a losing deal. Whichever indicator you base yourself on, remember to follow the basic rules of risk management and capital allocation.
BINANCE:BTCUSDT
**********************************************************************************************************************************************************************************************************************************************************************************
! Français !
Combo 4+ KDJ STO RSI EMA3 Visual Trend Pine V5@RL
Combo 4+ KDJ STO RSI EMA3 Visual Trend Pine V5@RL est un indicateur visuel de suivi de tendance qui regroupe et combine quatre indicateurs de suivi de tendance. Il est compilé en langage PINE Script Version V5.
• STOCH : Stochastique.
• RSI Divergence : Relative Strength Index Divergence. La Divergence RSI est une différence entre un RSI rapide et un RSI lent.
• KDJ : KDJ Indicateur. (indicateur de suivi de tendance).
• EMA Triple : 3 moyennes mobiles exponentielles (Affichage par défaut).
Cet indicateur est destiné à aider les débutants (et aussi les plus confirmé) à trader à dans le bon sens de la tendance du marché. Il permet d'éviter les erreurs qui consistent à toujours trader à contre tendance.
Les codes de calcul des différents indicateurs utilisés sont des codes publics standards utilisés dans le codage habituel de TradingView pour ces indicateurs !
Le script de calcul de l’indicateur STO est issu du calcul standard du STOCH de TradingView.
Le script de calcul de l’indicateur RSI Div est une réplique de celui créé par @Shizaru.
Le script de calcul de l’indicateur KDJ est une réplique de celui créé par @iamaltcoin.
Le script de calcul de l’indicateur Triple EMA est une réplique de celui créé par @jwilcharts
Cet indicateur peut être configuré à votre convenance. Il peut même être utilisé plusieurs fois sur le même graphique (multi-instance), avec des configurations différentes ou affichage d’un autre indicateur parmi les quatre qui le composent, selon vos besoins ou vos goûts.
Un seul tracé, parmi les 4 indicateurs qui le composent, peut être affiché à la fois mais, soit avec sa propre tendance soit avec la tendance des 4 (3 par défaut) indicateurs combinés (couleur de fond vente=vert ou achat=rouge).
Les indications de tendance (zones de vente ou d’achat potentielles) sont affichés sous la forme de couleur de fond (Haussier : vert ou baissier : rouge) lorsque au moins trois des quatre indicateurs (3 par défaut et configurable de 1 à 4) supposent que le marché évolue dans la même direction. Ces indications de tendance peuvent être configuré et affichés, soit uniquement pour le signal de l’indicateur choisi et affiché, soit pour les signaux des quatre indicateurs ensemble et combinés (ET logique).
Vous pouvez accorder les paramètres d’entrée, de style et de visibilité de chacun des indicateurs pour correspondre à vos propres préférences ou habitudes.
Un signal ‘stop achat’ ou ‘stop vente’ est affiché (layouts) sous la forme d’un carré de couleur (vert pour ‘stop achat’ et rouge pour ‘stop vente’. Ces signaux ‘stop’ peuvent être configuré et affichés, soit uniquement pour l’indicateur choisi, soit pour les quatre indicateurs ensemble et combinés (OU logique).
A noter que la présence d’un signal Stop Long annule la couleur de fond de la tendance Long (vert).
De même, la présence d’un signal Stop Short annule la couleur de fond de la tendance Short (rouge).
Il est aussi composé de 3 étiquettes (Labels) :
• Trend Label (infos de tendance)
• Signal Stop Label (signaux « Stop » achat ou vente)
• Infos Label (Noms des indicateurs Long/Short/Stop Long/Stop Short,
et /Open/Close/High/Low )
Chaque label est configurable (visibilité et position sur le graphique).
• Label Trend : indique le nombre d’indicateurs suggérant une même tendance (Long ou Short) ainsi qu’un indice de force (PWR) de cette tendance :
Par exemple : 3 indicateurs en tendance Short, 1 indicateur en tendance Long et 1 indicateur en tendance neutre donnera :
PWR SHORT = 2/4. (3 indicateurs Short – 1 indicateur Long=2 Pwr Short).
Et si PWR=0 alors l’affichage est « Wait and See » (Attendre et Observer).
Il indique aussi quel indicateur actuel est affiché et le mode d’affichage utilisé (combiné 1 à 4 indicateurs ou non combiné ).
• Signal Stop Label : Indique un possible arrêt de la tendance en cours.
• Infos Label (Simple ou complet) donne les infos de tendance de chacun des 4 indicateurs et les infos OHLC du graphique (en mode « Complet »).
Il est possible d’afficher ce même indicateur plusieurs fois sur un graphique (jusqu’à 3 indicateurs max avec le Plan Basic TradingView et plus avec les plans payants), avec des configurations différentes :
Par exemple :
• 1-Stochastique – Signaux Combinés 2/4 – aucun Label affiché
• 1-RSI – Signaux Combinés 3/4 – Label Stop uniquement affiché
• 1-KDJ – Signaux Combinés 4/4 – les 3 Labels affichés
• 1-EMA’3 - Signaux Non combinés (EMA seuls) – Trend Label affiché
Certains indicateurs ont des filtres/seuils (Thresholds) configurables selon votre convenance et votre expérience !
Le choix des couleurs de l’indicateur est adapté pour un graphique avec thème « sombre », qu’il vous faudra probablement modifier pour le confort visuel, si vous utilisez un mode « Clair » ou un mode personnalisé.
Ce script est un indicateur que vous pouvez exécuter sur des types de graphiques standard. Il fonctionne aussi sur des types de graphiques non-standard mais les résultats seront faussés et différents.
Les graphiques Non-standard sont :
• Heikin Ashi (HA)
• Renko
• Kagi
• Point & Figure
• Range
Pour rappel : Aucun indicateur n’est capable de fournir des signaux précis 100% du temps. De temps en temps, même les meilleurs échoueront, vous laissant avec une affaire perdante. Quel que soit l’indicateur sur lequel vous vous basez, n’oubliez pas de suivre les règles de base de gestion des risques et de répartition du capital.
BINANCE:BTCUSDT
neutronix community bot ML + Alerts 4h-daily (mod. capissimo)Gm traders,
i have been a python programmer for some years studying artificial intelligence for general purpose; after some time i finally decided to have a look at some finance related stuff and scripts.
Moved by curiosity i've decided to make some but decisive modifications to a script i tried to use initially but without success: the LVQ machine learning strategy.
So after studying the charts and indicators, i have rewritten this script made by Capissimo and added heavy filtering thanks to vwap and vwma, then fixed repaint and other issues.
I hope you enjoy it and that it could increase your possibilities of success in trading.
HOW TO USE THE SCRIPT
Add the script to 3h+ charts like for example BTC 4h, 6h, 8h, 12h, daily. (In order for it to work on shorter timeframes charts you can try to change to lookback window but i dont advise it).
Change only rsi and volfilter(volume filtering) settings to try to find the best winrate. Leave dataset to open. Fyi the winrate isn't 100% accurate but can give you a raw vision of final results.
Use alerts included for trading and and in options click on 'Once per bar'. If you have checked 'Reverse Signals' in the control panel you have got more 'risky' signals so be advised if trading futures and stocks.
Exit trade signals not provided, so it is recommended the use of take profits and stop loss (1.5:1 ratio)
As always, the script is for study purposes. Do not risk more than you can spend!
Original LVQ-based strategy made by capissimo
Modified by gravisxv 13/10/2021
The Cloud AIThis Script uses the DonChain + EMA and an Average to create a trend cloud.
* When the cloud crosses to red it will print a red triangle mean a potential pullback.
* In a Green cloud green dots are printed after small pullback for scalps or continuation.
* A green or red star is an entry for the strategy which is defined by the all the slow and fast parameters crossing.
Exits will happen when the red or green star is printed.
All these levels help traders see where the price could experience support or resistance, these support and resistance levels can be used by traders to determine entry and exit points.
Using Machine learning I optimised this to work with BTC you can optimise the settings to most markets.
CRYPTO TRADING BOT - 1min SCALPING LONG/SHORTHOW IT WORKS
The core concept behind the script is the determination of the current market mood in sense of creating a trendline indicator using EMA / SMA .
By using this trend indication alongside RSI / MACD value range, we are able to enter/exit the market in both directions: LONG and SHORT .
In case of confirmed false signals, we try to catch up the next good opportunity to minimise loss and to close the current trade.
If the chance for a good countertrade is given at this point, the market is going to be entered reversely.
Should the market move incredibly fast against our trade direction, we use proven Stop-loss targets, to bring our children into safety.
As many others, we could tell you now, that we used state-of-the-art machine learning algorithms
as well as highly sophisticated methods to gain our results.
As a fact, we started with an idea, using simple and common trading tools/indicators,
as a solid ground. We did not want to reinvent the wheel and it paid off.
GET A WORKING SCRIPT
The algorithm we are using has initially been created with a self-developed backtesting software.
To be able to deliver gas to our engine, we have bought a huge amount of OHLCV data for the 1min chart.
After many exhausting and frustrating weeks of our workflow-rotation (develop, fail, fix, test, repeat)
we finally got confirmation for all of our conditions/expectations, so we translated our algorithm into pine-code.
THE RESULTS
Since we have been using our Pine-Strategy alongside our backtesting software , we checked all the results provided by TradingView
and our tool to be 100% sure every outcome, every entry and every exit is exactly the same.
We did this for several months and since 2021 June we have been using it with real Alerts, coped to our binance account.
Below, you will find how the performance for the previous months looked like (every trade was made with 100% of the capital, of course using proper stop loss and take profit):
September 2020: 15.18%
October 2020: 36.17%
November 2020: 15.12%
December 2020: 48.58%
January 2021: 150.10%
February 2021: 45.96%
March 2021: 46.48%
April 2021: 4.96%
May 2021: 43.48%
June 2021: -28.99%
Juli 2021: 15.63%
August 2021 (so far): 11.57%
Accumulated Profit: 1,979.01%
To prove our results, we will link an excel sheet for every trade that was made within this timerange.
Link: docs.google.com
ABOUT US
We are two good friends, both incredibly interested in mathematics, software engineering, AI and algorithmics. After getting introduced into the crypto space
by a common friend, we started figuring out that there is a pattern behind every big or small move which happens in an asset.
This is where the passion for creating a CRYPTO TRADING BOT began. It was our goal, to create this script for the 1min Timeframe, so the software can react quickly when a
big or small move is happening - this is why it is called a SCALPING SCRIPT .
We are incredibly proud of this script and would like to share it with this amazing community - just hit us up on TradingView!
PriceCatch Euronext Paris Stocks Screener v1Hi,
Tradingview community. Warm Greetings.
Euronext Paris Stocks Screener
I am sharing a script that screens Euronext Paris stocks for Probable Breakout Buy signal and Stop-Reverse Buy Signal. This script may prove to be useful to traders who trade Euronext Paris listed stocks.
I have already shared the script "PriceCatch Signals Buy Signals" that marks the following levels on the chart.
Probable Breakout Buy Level
Stop-Reverse Buy Level
While the script "PriceCatch Signals Buy Signals" can be used independently, this script is intended to be used with the script "PriceCatch Signals Buy Signals".
Used together, these two scripts may help you identify probable buy opportunities. The purpose of this script is to help screen stocks quickly without manually going through every stock in your watchlist.
Please read the Notes of the script "PriceCatch Signals Buy Signals" for explanation of its functionality.
Stocks Set
As Tradingview limits the number of security function calls, to get around, you have to select Set1 to screen first set of 25 stocks and then select Set2 to screen next set of 25 stocks.
List of Euronext Paris stocks
ACA AI AIR ALCRB ALGAU ALO ALONC ALVTX ATO BN BNP CA CLA COFA CS DBG DG EDF
EL ELIOR EN ENGI ETL FDJ FR FTI GET GLE MCPHY OR ORA POXEL PUB RI
RNO RXL SAF SAN SGO SMCP STLA STM SU TE TTE VIE VIV VK VLA WLN
Chart resolution vs. Script resolution
I have noticed that if the chart resolution is set to 15 minutes time-frame and the screener resolution is selected as 2 Hours, then the results are correct. However, if the screener resolution is set to 5 minutes, then the results are not accurate. This is not an issue with script. So scanning higher time-frames from a lower time-frame chart works better. My advice however, is better to set the chart resolution to the same interval as screener resolution for sure results.
As usual with price action, longer time-frames produce more reliable signals.
SOME CHARTS
Chart set to Daily time-frame and shows Derichebourg stock. Screener shows a Stop-Reverse Buy Opportunity on GET.
s3.tradingview.com
Example 2
Chart set to 30 min. timeframe and shows Derichebourg stock. Screener shows a Stop-Reverse Buy Opportunity on VIV .
s3.tradingview.com
NOTE - PRIOR TO USING THIS SCRIPT
Please remember that the script is shared with absolutely no assurances about usability and any warranties whatsoever and as a responsible trader, please satisfy yourselves thoroughly and use it only if you are satisfied it works for you. Remember, you are 100% responsible for your actions. If you understand and accept that, you may use the script.
QUERIES/FEEDBACK
Please PM me.
Regards to all and wish everyone all the best with trading.
FOTSI - Open sourceI WOULD LIKE TO SPECIFY TWO THINGS:
- The indicator was absolutely not designed by me, I do not take any credit and much less I want them, I am just making this fantastic indicator open source and accessible to all
- The script code was not recycled from other indicators, but was created from 0 following the theory behind it to the letter, thus avoiding copyright infringement
- Advices and improvements are accepted, as having very little programming experience in Pine Script I consider this work still rough and slow
WHAT IS THE FOTSI?
The FOTSI is an oscillator that measures the relative strength of the individual currencies that make up the 28 major Forex exchanges.
By identifying the currencies that are in the overbought (+50) and oversold (-50) areas, it is possible to anticipate the correction of a currency pair following a strong trend.
THE THEORY BEHIND
1) At the base of everything is the 1-period momentum (close-open) of the single currency pairs that contain a certain currency. For example, the momentum of the USD currency is composed of all the exchange rates that contain the US dollar inside it: mom_usd = - mom_eurusd - mom_gbpusd + mom_usdchf + mom_usdjpy - mom_audusd + mom_usdcad - mom_nzdusd. Where the base currency is in second position, the momentum is subtracted instead of adding it.
2) The IST formula is applied to the momentum of the individual currencies obtained. In this way we get an oscillator that oscillates between 0 and its overbought and oversold areas. The area between +25 and -25 is an area in which we can consider the movements of individual currencies to be neutral.
3) The TSI is nothing more than a double smoothing on the momentum of individual currencies. This particularity makes the indicator very reactive, minimizing the delays of the trend reversal.
HOW TO USE
1) A currency is identified that is in the overbought (+50) or oversold (-50) area. Example GBP = 50
2) The second currency is identified as the one most opposite to the first. Example USD = -25
3) The currency pair consisting of the two currencies opens. So GBP / USD
4) Considering that GBP is oversold, we anticipate its future devaluation. So in this case we are short on GBP / SUD. Otherwise if GBP had been oversold (-50) we expect its future valuation and therefore we enter long.
5) It is used on the H1, H4 and D1 timeframes
6) Closing conditions: the position on the 50-period exponential moving average is split / the position at target on the 100-period exponential moving average is closed
7) Stoploss: it is recommended not to use it, if you want to use it it is equivalent to 5 times the ATR on the reference timeframe
8) Position sizing: go very slow! Being a counter-trend strategy, it is very risky to position yourself heavily. Use common sense in everything!
9) To insert the alerts that warn you of an overbought and oversold condition, it is necessary to enter the signals called "Overbought Signal" and "Oversold Signal" for each chart used, in the specific Trading View window. like me using multiple charts in the same window.
I hope you enjoy my work. For any questions write in the comments.
Thanks <3
//--------------------------------------------------------------------------------------------------------------------------------------------------------------------------------------------------------------
TENGO A PRECISARE DUE COSE:
- L'indicatore non è stato assolutamente ideato da me, non mi assumo nessun merito e tanto meno li voglio, io sto solo rendendo questo fantastico indicatore open source ed accessibile a tutti
- Il codice dello script non è stato riciclato da altri indicatori, ma è stato creato da 0 seguendo alla lettere la teoria che sta alla sua base, evitando così di violare il copyright
- Si accettano consigli e migliorie, visto che avendo pochissima esperienza di programmazione in Pine Script considero questo lavoro ancora grezzo e lento
COS'È IL FOTSI?
Il FOTSI è un oscillatore che misura la forza relativa delle singole valute che compongono i 28 cambi major del Forex.
Individuando le valute che si trovano nelle aree di ipercomprato (+50) ed ipervenduto (-50) , è possibile anticipare la correzione di una coppia valutaria al seguito di un forte trend.
LA TEORIA ALLA BASE
1) Alla base di tutto c'è il momentum ad 1 periodo (close-open) delle singole coppie valutarie che contengono una determinata valuta. Ad esempio il momentum della valuta USD è composto da tutti i cambi che contengono il dollaro americano al suo interno: mom_usd = - mom_eurusd - mom_gbpusd + mom_usdchf + mom_usdjpy - mom_audusd + mom_usdcad - mom_nzdusd . Ove la valuta base si trova in seconda posizione si sottrae il momentum al posto che sommarlo.
2) Si applica la formula del TSI ai momentum delle singole valute ottenute. In questo modo otteniamo un oscillatore che oscilla tra lo 0 e le sue aree di ipercomprato ed ipervenduto. L'area compresa tra +25 e -25 è un area in cui possiamo considerare neutri i movimenti delle singole valute.
3) Il TSI non è altro che un doppio smoothing sul momentum delle singole valute. Questa particolarità rende l'indicatore molto reattivo, minimizzando i ritardi dell'inversione del trend.
COME SI USA
1) Si individua una valuta che si trova nell'area di ipercomprato (+50) o ipervenduto (-50) . Esempio GBP = 50
2) Si individua come seconda valuta quella più opposta alla prima. Esempio USD = -25
3) Si apre la coppia di valuta composta dalle due valute. Quindi GBP/USD
4) Considerando che GBP è in fase di ipervenduto prevediamo una sua futura svalutazione. Quindi in questo caso entriamo short su GBP/SUD. Diversamente se GBP fosse stato in fase di ipervenduto (-50) ci aspettiamo una sua futura valutazione e quindi entriamo long.
5) Si usa sui timeframe H1, H4 e D1
6) Condizioni di chiusura: si smezza la posizione sulla media mobile esponenziale a 50 periodi / si chiude la posizione a target sulla media mobile esponenziale a 100 periodi
7) Stoploss: è consigliato non usarlo, nel caso lo si voglia utilizzare esso equivale a 5 volte l'ATR sul timeframe di riferimento
8) Position sizing: andateci molto piano! Essendo una strategia contro trend è molto rischioso posizionarsi in modo pesante. Usate il buonsenso in tutto!
9) Per inserire gli allert che ti avvertono di una condizione di ipercomprato ed ipervenduto, è necessario inserire dall'apposita finestra di Trading View i segnali denominati "Segnale di ipercomprato" ed "Segnale di ipervenduto" per ogni grafico che si usa, nel caso come me che si utilizzano più grafici nella stessa finestra.
Spero che possiate apprezzare il mio lavoro. Per qualsiasi domanda scrivete nei commenti.
Grazie<3
Quadratic Regression Trend ChannelIt's been a while since I have published anything meaningful for all members, but here is my next step in evolution of trend channel technology, my attempt at "Quadratic Regression Trend Channel" custom tailored for regression enthusiasts. I'm actually doing a lot more than my profile shall ever reveal. Many members may have heard of "polynomial regression channel"(PRC), but I wouldn't accurately label this as having the "poly-" capability in it with differing amounts of nth degrees/orders.
This indicator is derived from my "HLC Banded Quadratic Regression" indicator, the 3rd indicator I had ever published in my earliest days of tinkering around with Pine Script. It always had a destiny, and TV has graciously delivered on upgrading Pine with many new capabilities to run this algorithm with ease and in the manner that I wished to write it. Any subscribing TradingViewer has the freedom to use this indicator and as many as they shall desire.
Blessed is the "Immense Power of Pine" in 2021, as I utilized a multitude of new Pine features including extensive use of arrays for the quadratic regression formula, arrays of line.new(), input(group=), and input(inline=). I spent an incredible amount of time creating this, and it was no easy task to condense this amount of sophistication within less than 150 lines of code at the time of this original debut release. I have striven to achieve the indicator's computational efficiency potential to be as fast as possible with highly optimized code to handle the large amount of sampling it utilizes and is capable of. I hope you find it analytically favorable and beyond your expectations.
First of all, it has different sampling methods I haven't seen in any other PRC available, providing tightly snug and fit curvatures dependent on my optional choices not found in comparable indicators. This yields the best quality of fit I can provide by employing quadratic regression in order to provide a superb "visual analysis" of your price action in high noise environments. I also included my novel time warp feature to rewind the indicator regression into a previous state of time. If you're trading on really fast timeframes, I included an option to only calculate once per bar at it's closure. This will aid with computational efficiency of the TV servers, and it's intended to not to slow down your charting experience amongst a wide assortment of other indicators in your overlay chart.
I allowed a couple of variability methods for the confidence bands. A variety of coloring options, line thickness, and other perks are there to accommodate your distinct visual acuity. There is also a nifty option to color the regression by the slope of the curvatures. This is enabled by default, and I anticipate that you may find that color option uniquely useful. The amount of chords in the curvature are automatically calculated depending on the regression period selected to achieve a nice fluid arch for any setting.
Anyhow, I believe that sums up most of it's important characteristics in a brief explanation. It's potential is best personally discovered by simply using it with the myriad of control settings available. I published it with protected code, because I simply wanted to confine this monstrosity to my TradingView laboratory. I would rather not have this thing uncaged, rabidly running around the planet frothing out of the mouth on a Frankenstein AI later, unless it's mine on a short leash. Besides, I'm still trying to figure out the math behind "cubic regression". :)
Sorry in advance about not providing the source code, I hope you'll understand... We ALL know what devastation happens when things are "unleashed" from a BSL-4 lab to run amok. Countless billions have yet to learn a horrific lesson about the mania of evil at a future Geneva convention. If you don't know the mythical story about Pandora's box(a jar actually), look it up!
Features List Includes:
Calculation Throttling
Regression Period
Time Warp
Multiple Sampling Methods
Confidence Bands Variability Controls
Indicator Customization Options
When available time provides itself, I will consider your inquiries, thoughts, and concepts presented below in the comments section, should you have any questions or comments regarding this indicator. When my indicators achieve more prevalent use by TV members , I may implement more ideas when they present themselves as worthy additions. Have a profitable future everyone!
Monte Carlo Range Forecast [DW]This is an experimental study designed to forecast the range of price movement from a specified starting point using a Monte Carlo simulation.
Monte Carlo experiments are a broad class of computational algorithms that utilize random sampling to derive real world numerical results.
These types of algorithms have a number of applications in numerous fields of study including physics, engineering, behavioral sciences, climate forecasting, computer graphics, gaming AI, mathematics, and finance.
Although the applications vary, there is a typical process behind the majority of Monte Carlo methods:
-> First, a distribution of possible inputs is defined.
-> Next, values are generated randomly from the distribution.
-> The values are then fed through some form of deterministic algorithm.
-> And lastly, the results are aggregated over some number of iterations.
In this study, the Monte Carlo process used generates a distribution of aggregate pseudorandom linear price returns summed over a user defined period, then plots standard deviations of the outcomes from the mean outcome generate forecast regions.
The pseudorandom process used in this script relies on a modified Wichmann-Hill pseudorandom number generator (PRNG) algorithm.
Wichmann-Hill is a hybrid generator that uses three linear congruential generators (LCGs) with different prime moduli.
Each LCG within the generator produces an independent, uniformly distributed number between 0 and 1.
The three generated values are then summed and modulo 1 is taken to deliver the final uniformly distributed output.
Because of its long cycle length, Wichmann-Hill is a fantastic generator to use on TV since it's extremely unlikely that you'll ever see a cycle repeat.
The resulting pseudorandom output from this generator has a minimum repetition cycle length of 6,953,607,871,644.
Fun fact: Wichmann-Hill is a widely used PRNG in various software applications. For example, Excel 2003 and later uses this algorithm in its RAND function, and it was the default generator in Python up to v2.2.
The generation algorithm in this script takes the Wichmann-Hill algorithm, and uses a multi-stage transformation process to generate the results.
First, a parent seed is selected. This can either be a fixed value, or a dynamic value.
The dynamic parent value is produced by taking advantage of Pine's timenow variable behavior. It produces a variable parent seed by using a frozen ratio of timenow/time.
Because timenow always reflects the current real time when frozen and the time variable reflects the chart's beginning time when frozen, the ratio of these values produces a new number every time the cache updates.
After a parent seed is selected, its value is then fed through a uniformly distributed seed array generator, which generates multiple arrays of pseudorandom "children" seeds.
The seeds produced in this step are then fed through the main generators to produce arrays of pseudorandom simulated outcomes, and a pseudorandom series to compare with the real series.
The main generators within this script are designed to (at least somewhat) model the stochastic nature of financial time series data.
The first step in this process is to transform the uniform outputs of the Wichmann-Hill into outputs that are normally distributed.
In this script, the transformation is done using an estimate of the normal distribution quantile function.
Quantile functions, otherwise known as percent-point or inverse cumulative distribution functions, specify the value of a random variable such that the probability of the variable being within the value's boundary equals the input probability.
The quantile equation for a normal probability distribution is μ + σ(√2)erf^-1(2(p - 0.5)) where μ is the mean of the distribution, σ is the standard deviation, erf^-1 is the inverse Gauss error function, and p is the probability.
Because erf^-1() does not have a simple, closed form interpretation, it must be approximated.
To keep things lightweight in this approximation, I used a truncated Maclaurin Series expansion for this function with precomputed coefficients and rolled out operations to avoid nested looping.
This method provides a decent approximation of the error function without completely breaking floating point limits or sucking up runtime memory.
Note that there are plenty of more robust techniques to approximate this function, but their memory needs very. I chose this method specifically because of runtime favorability.
To generate a pseudorandom approximately normally distributed variable, the uniformly distributed variable from the Wichmann-Hill algorithm is used as the input probability for the quantile estimator.
Now from here, we get a pretty decent output that could be used itself in the simulation process. Many Monte Carlo simulations and random price generators utilize a normal variable.
However, if you compare the outputs of this normal variable with the actual returns of the real time series, you'll find that the variability in shocks (random changes) doesn't quite behave like it does in real data.
This is because most real financial time series data is more complex. Its distribution may be approximately normal at times, but the variability of its distribution changes over time due to various underlying factors.
In light of this, I believe that returns behave more like a convoluted product distribution rather than just a raw normal.
So the next step to get our procedurally generated returns to more closely emulate the behavior of real returns is to introduce more complexity into our model.
Through experimentation, I've found that a return series more closely emulating real returns can be generated in a three step process:
-> First, generate multiple independent, normally distributed variables simultaneously.
-> Next, apply pseudorandom weighting to each variable ranging from -1 to 1, or some limits within those bounds. This modulates each series to provide more variability in the shocks by producing product distributions.
-> Lastly, add the results together to generate the final pseudorandom output with a convoluted distribution. This adds variable amounts of constructive and destructive interference to produce a more "natural" looking output.
In this script, I use three independent normally distributed variables multiplied by uniform product distributed variables.
The first variable is generated by multiplying a normal variable by one uniformly distributed variable. This produces a bit more tailedness (kurtosis) than a normal distribution, but nothing too extreme.
The second variable is generated by multiplying a normal variable by two uniformly distributed variables. This produces moderately greater tails in the distribution.
The third variable is generated by multiplying a normal variable by three uniformly distributed variables. This produces a distribution with heavier tails.
For additional control of the output distributions, the uniform product distributions are given optional limits.
These limits control the boundaries for the absolute value of the uniform product variables, which affects the tails. In other words, they limit the weighting applied to the normally distributed variables in this transformation.
All three sets are then multiplied by user defined amplitude factors to adjust presence, then added together to produce our final pseudorandom return series with a convoluted product distribution.
Once we have the final, more "natural" looking pseudorandom series, the values are recursively summed over the forecast period to generate a simulated result.
This process of generation, weighting, addition, and summation is repeated over the user defined number of simulations with different seeds generated from the parent to produce our array of initial simulated outcomes.
After the initial simulation array is generated, the max, min, mean and standard deviation of this array are calculated, and the values are stored in holding arrays on each iteration to be called upon later.
Reference difference series and price values are also stored in holding arrays to be used in our comparison plots.
In this script, I use a linear model with simple returns rather than compounding log returns to generate the output.
The reason for this is that in generating outputs this way, we're able to run our simulations recursively from the beginning of the chart, then apply scaling and anchoring post-process.
This allows a greater conservation of runtime memory than the alternative, making it more suitable for doing longer forecasts with heavier amounts of simulations in TV's runtime environment.
From our starting time, the previous bar's price, volatility, and optional drift (expected return) are factored into our holding arrays to generate the final forecast parameters.
After these parameters are computed, the range forecast is produced.
The basis value for the ranges is the mean outcome of the simulations that were run.
Then, quarter standard deviations of the simulated outcomes are added to and subtracted from the basis up to 3σ to generate the forecast ranges.
All of these values are plotted and colorized based on their theoretical probability density. The most likely areas are the warmest colors, and least likely areas are the coolest colors.
An information panel is also displayed at the starting time which shows the starting time and price, forecast type, parent seed value, simulations run, forecast bars, total drift, mean, standard deviation, max outcome, min outcome, and bars remaining.
The interesting thing about simulated outcomes is that although the probability distribution of each simulation is not normal, the distribution of different outcomes converges to a normal one with enough steps.
In light of this, the probability density of outcomes is highest near the initial value + total drift, and decreases the further away from this point you go.
This makes logical sense since the central path is the easiest one to travel.
Given the ever changing state of markets, I find this tool to be best suited for shorter term forecasts.
However, if the movements of price are expected to remain relatively stable, longer term forecasts may be equally as valid.
There are many possible ways for users to apply this tool to their analysis setups. For example, the forecast ranges may be used as a guide to help users set risk targets.
Or, the generated levels could be used in conjunction with other indicators for meaningful confluence signals.
More advanced users could even extrapolate the functions used within this script for various purposes, such as generating pseudorandom data to test systems on, perform integration and approximations, etc.
These are just a few examples of potential uses of this script. How you choose to use it to benefit your trading, analysis, and coding is entirely up to you.
If nothing else, I think this is a pretty neat script simply for the novelty of it.
----------
How To Use:
When you first add the script to your chart, you will be prompted to confirm the starting date and time, number of bars to forecast, number of simulations to run, and whether to include drift assumption.
You will also be prompted to confirm the forecast type. There are two types to choose from:
-> End Result - This uses the values from the end of the simulation throughout the forecast interval.
-> Developing - This uses the values that develop from bar to bar, providing a real-time outlook.
You can always update these settings after confirmation as well.
Once these inputs are confirmed, the script will boot up and automatically generate the forecast in a separate pane.
Note that if there is no bar of data at the time you wish to start the forecast, the script will automatically detect use the next available bar after the specified start time.
From here, you can now control the rest of the settings.
The "Seeding Settings" section controls the initial seed value used to generate the children that produce the simulations.
In this section, you can control whether the seed is a fixed value, or a dynamic one.
Since selecting the dynamic parent option will change the seed value every time you change the settings or refresh your chart, there is a "Regenerate" input built into the script.
This input is a dummy input that isn't connected to any of the calculations. The purpose of this input is to force an update of the dynamic parent without affecting the generator or forecast settings.
Note that because we're running a limited number of simulations, different parent seeds will typically yield slightly different forecast ranges.
When using a small number of simulations, you will likely see a higher amount of variance between differently seeded results because smaller numbers of sampled simulations yield a heavier bias.
The more simulations you run, the smaller this variance will become since the outcomes become more convergent toward the same distribution, so the differences between differently seeded forecasts will become more marginal.
When using a dynamic parent, pay attention to the dispersion of ranges.
When you find a set of ranges that is dispersed how you like with your configuration, set your fixed parent value to the parent seed that shows in the info panel.
This will allow you to replicate that dispersion behavior again in the future.
An important thing to note when settings alerts on the plotted levels, or using them as components for signals in other scripts, is to decide on a fixed value for your parent seed to avoid minor repainting due to seed changes.
When the parent seed is fixed, no repainting occurs.
The "Amplitude Settings" section controls the amplitude coefficients for the three differently tailed generators.
These amplitude factors will change the difference series output for each simulation by controlling how aggressively each series moves.
When "Adjust Amplitude Coefficients" is disabled, all three coefficients are set to 1.
Note that if you expect volatility to significantly diverge from its historical values over the forecast interval, try experimenting with these factors to match your anticipation.
The "Weighting Settings" section controls the weighting boundaries for the three generators.
These weighting limits affect how tailed the distributions in each generator are, which in turn affects the final series outputs.
The maximum absolute value range for the weights is . When "Limit Generator Weights" is disabled, this is the range that is automatically used.
The last set of inputs is the "Display Settings", where you can control the visual outputs.
From here, you can select to display either "Forecast" or "Difference Comparison" via the "Output Display Type" dropdown tab.
"Forecast" is the type displayed by default. This plots the end result or developing forecast ranges.
There is an option with this display type to show the developing extremes of the simulations. This option is enabled by default.
There's also an option with this display type to show one of the simulated price series from the set alongside actual prices.
This allows you to visually compare simulated prices alongside the real prices.
"Difference Comparison" allows you to visually compare a synthetic difference series from the set alongside the actual difference series.
This display method is primarily useful for visually tuning the amplitude and weighting settings of the generators.
There are also info panel settings on the bottom, which allow you to control size, colors, and date format for the panel.
It's all pretty simple to use once you get the hang of it. So play around with the settings and see what kinds of forecasts you can generate!
----------
ADDITIONAL NOTES & DISCLAIMERS
Although I've done a number of things within this script to keep runtime demands as low as possible, the fact remains that this script is fairly computationally heavy.
Because of this, you may get random timeouts when using this script.
This could be due to either random drops in available runtime on the server, using too many simulations, or running the simulations over too many bars.
If it's just a random drop in runtime on the server, hide and unhide the script, re-add it to the chart, or simply refresh the page.
If the timeout persists after trying this, then you'll need to adjust your settings to a less demanding configuration.
Please note that no specific claims are being made in regards to this script's predictive accuracy.
It must be understood that this model is based on randomized price generation with assumed constant drift and dispersion from historical data before the starting point.
Models like these not consider the real world factors that may influence price movement (economic changes, seasonality, macro-trends, instrument hype, etc.), nor the changes in sample distribution that may occur.
In light of this, it's perfectly possible for price data to exceed even the most extreme simulated outcomes.
The future is uncertain, and becomes increasingly uncertain with each passing point in time.
Predictive models of any type can vary significantly in performance at any point in time, and nobody can guarantee any specific type of future performance.
When using forecasts in making decisions, DO NOT treat them as any form of guarantee that values will fall within the predicted range.
When basing your trading decisions on any trading methodology or utility, predictive or not, you do so at your own risk.
No guarantee is being issued regarding the accuracy of this forecast model.
Forecasting is very far from an exact science, and the results from any forecast are designed to be interpreted as potential outcomes rather than anything concrete.
With that being said, when applied prudently and treated as "general case scenarios", forecast models like these may very well be potentially beneficial tools to have in the arsenal.
Volume Spike RSIFollow up to Volume Spike Strategy.
This script calculates volume spikes (e.g. volume is 3 times greater than average volume) and signals them in overbought or oversold areas (RSI).
Credit to “Capitalize AI: Volume Spike Strategy" by Bitcoin Trading Challenge for the original idea.
Tested on XBTUSD 1 minute chart
Machine Learning: LVQ-based StrategyLVQ-based Strategy (FX and Crypto)
Description:
Learning Vector Quantization (LVQ) can be understood as a special case of an artificial neural network, more precisely, it applies a winner-take-all learning-based approach. It is based on prototype supervised learning classification task and trains its weights through a competitive learning algorithm.
Algorithm:
Initialize weights
Train for 1 to N number of epochs
- Select a training example
- Compute the winning vector
- Update the winning vector
Classify test sample
The LVQ algorithm offers a framework to test various indicators easily to see if they have got any *predictive value*. One can easily add cog, wpr and others.
Note: TradingViews's playback feature helps to see this strategy in action. The algo is tested with BTCUSD/1Hour.
Warning: This is a preliminary version! Signals ARE repainting.
***Warning***: Signals LARGELY depend on hyperparams (lrate and epochs).
Style tags: Trend Following, Trend Analysis
Asset class: Equities, Futures, ETFs, Currencies and Commodities
Dataset: FX Minutes/Hours+++/Days
Machine Learning: Logistic RegressionMulti-timeframe Strategy based on Logistic Regression algorithm
Description:
This strategy uses a classic machine learning algorithm that came from statistics - Logistic Regression (LR).
The first and most important thing about logistic regression is that it is not a 'Regression' but a 'Classification' algorithm. The name itself is somewhat misleading. Regression gives a continuous numeric output but most of the time we need the output in classes (i.e. categorical, discrete). For example, we want to classify emails into “spam” or 'not spam', classify treatment into “success” or 'failure', classify statement into “right” or 'wrong', classify election data into 'fraudulent vote' or 'non-fraudulent vote', classify market move into 'long' or 'short' and so on. These are the examples of logistic regression having a binary output (also called dichotomous).
You can also think of logistic regression as a special case of linear regression when the outcome variable is categorical, where we are using log of odds as dependent variable. In simple words, it predicts the probability of occurrence of an event by fitting data to a logit function.
Basically, the theory behind Logistic Regression is very similar to the one from Linear Regression, where we seek to draw a best-fitting line over data points, but in Logistic Regression, we don’t directly fit a straight line to our data like in linear regression. Instead, we fit a S shaped curve, called Sigmoid, to our observations, that best SEPARATES data points. Technically speaking, the main goal of building the model is to find the parameters (weights) using gradient descent.
In this script the LR algorithm is retrained on each new bar trying to classify it into one of the two categories. This is done via the logistic_regression function by updating the weights w in the loop that continues for iterations number of times. In the end the weights are passed through the sigmoid function, yielding a prediction.
Mind that some assets require to modify the script's input parameters. For instance, when used with BTCUSD and USDJPY, the 'Normalization Lookback' parameter should be set down to 4 (2,...,5..), and optionally the 'Use Price Data for Signal Generation?' parameter should be checked. The defaults were tested with EURUSD.
Note: TradingViews's playback feature helps to see this strategy in action.
Warning: Signals ARE repainting.
Style tags: Trend Following, Trend Analysis
Asset class: Equities, Futures, ETFs, Currencies and Commodities
Dataset: FX Minutes/Hours/Days
Machine Learning: Perceptron-based strategyPerceptron-based strategy
Description:
The Learning Perceptron is the simplest possible artificial neural network (ANN), consisting of just a single neuron and capable of learning a certain class of binary classification problems. The idea behind ANNs is that by selecting good values for the weight parameters (and the bias), the ANN can model the relationships between the inputs and some target.
Generally, ANN neurons receive a number of inputs, weight each of those inputs, sum the weights, and then transform that sum using a special function called an activation function. The output of that activation function is then either used as the prediction (in a single neuron model) or is combined with the outputs of other neurons for further use in more complex models.
The purpose of the activation function is to take the input signal (that’s the weighted sum of the inputs and the bias) and turn it into an output signal. Think of this activation function as firing (activating) the neuron when it returns 1, and doing nothing when it returns 0. This sort of computation is accomplished with a function called step function: f(z) = {1 if z > 0 else 0}. This function then transforms any weighted sum of the inputs and converts it into a binary output (either 1 or 0). The trick to making this useful is finding (learning) a set of weights that lead to good predictions using this activation function.
Training our perceptron is simply a matter of initializing the weights to zero (or random value) and then implementing the perceptron learning rule, which just updates the weights based on the error of each observation with the current weights. This has the effect of moving the classifier’s decision boundary in the direction that would have helped it classify the last observation correctly. This is achieved via a for loop which iterates over each observation, making a prediction of each observation, calculating the error of that prediction and then updating the weights accordingly. In this way, weights are gradually updated until they converge. Each sweep through the training data is called an epoch.
In this script the perceptron is retrained on each new bar trying to classify this bar by drawing the moving average curve above or below the bar.
This script was tested with BTCUSD, USDJPY, and EURUSD.
Note: TradingViews's playback feature helps to see this strategy in action.
Warning: Signals ARE repainting.
Style tags: Trend Following, Trend Analysis
Asset class: Equities, Futures, ETFs, Currencies and Commodities
Dataset: FX Minutes/Hours+/Days
Machine Learning: kNN-based Strategy (mtf)This is a multi-timeframe version of the kNN-based strategy.
GreenCrypto Swing Trade Indicator - GC02Overview: This is a swing trading Indictor works using support & resistance and market trend, it is designed for all type of markets (crypto, forex, stock etc.) and works on all commonly used timeframes (preferably on 1H, 4H Candles).
How it works:
Core logic behind this indicator is to finding the Support and Resistance, we find the Lower High (LH) and Higher Low (HL) to find the from where the price reversed(bounced back) and also we use a custom logic for figuring out the peak price in the last few candles (based on the input "Strength" ). Based on the multiple previous Support and Resistance (HH, HL, LL LH) we calculate a price level, this price level is used a major a factor for entering the trade. Once we have the price level we check if the current price crosses that price level, if it crossed then we consider that as a long/short entry (based on whether it crosses resistance or support line that we calculated). Once we have pre long/short signals we further filter it based on the market trend to prevent too early/late signals, this trend is calculated based on the value from the input field "Factor". Along with this if we don't see a clear trend we do the filtering by checking how many support or resistance level the price has bounced off.
Stop Loss and Take Profit : We have also added printing SL and TP levels on the chart to make the it easier for everyone to find the SL/TP values. Script calculates the SL value by checking the previous support level for LONG trade and previous resistance level for SHORT trades. Take profit are calculated in 1:1 ratio as of now.
Available Inputs:
Strength : Define the strength of the support resistance that we calculate. The lower value means less number of candles used for calculating the support & resistance and vice versa
Factor : Specify what level of trend to use. Using higher value will result script looking using the larger trend (zoomed out trend) and using lesser value will result in using the short trends
Note: For most of the charts you don’t need to change the default values. However, feel free to try it out.
How to use:
Add the script to the chart and once the indicator is load it will display the "long" and "short" entry points along with the stopLoss and takeProfit points.
How to get access:
Send a DM to us for getting access to the script.
COTBase iCOT (Scores)COTBase iCOT indicator is based on reverse-engineering the Commitments of Traders data and creating a proprietary algo, which mimics real COT data on any time-frame and chart type.
We advise to use it mainly on time-based charts, on smaller than 4 hr per bar time-frames. A multi-time-frame analysis is recommended where the smaller time-frame signals are confirmed by the higher time-frames.
This indicator is the Scores part of the COTBase iCOT package. If you apply it to your chart, you will see the pseudo-Commercials (red line), pseudo-Speculators (green line) and the Balance line (white line). To use in practice you may not need to add this indicator to your chart after you added the Signals indicator, since that already shows the most important signals when these lines are at important extremes and confluences. The Signal indicator does NOT require to add the Scores indicator to the chart to work properly.
Features:
Versatile
You can use the COTBase iCOT indicator on any chart type (eg. candlesticks , bar charts, renko, range bars, etc.) and time-frames (eg. 1-min, 5-min , 1-hr, 4-hr, etc.).
Proprietary algo
We used AI and various other methods to create a truly unique indicator that - we believe - descibes market forces the most efficient way.
We have found that this is possibly the closest we could get to a realistic estimation of the fundamental forces driving the market.
Data does not come from CFTC
The COTBase iCOT indicator does not source any of its data from the Commodity Futures Trading Commission.
Accurate signal logic
We mark "pseudo-Commercial" buy/sell setups with a yellow diamond below/above the price. We mark "pseudo-Speculator" buy/sell signals with blue bars.
The statistically best "3-fold confluence" setups are marked with green/red stripes (and/or other markers).
Key features:
Allow plotting pseudo-Commercials and Change, pseudo-Speculators and Change, Balance Line and Change.
Allow highlighting any of the above series if they cross above/below a user defined threshold
Allow configuring the strength and markings of "All Signal" confluences
Allow setting the logic for Change calculations and markings
Sound alerts
Compatibility:
Instruments: futures , cryptocurrencies, forex, stocks, CFDs, indices, options
Interval types: time and non-time-based, standard or custom
Chart styles: any
You can obtain this indicator by visiting the link below.
COTBase iCOT (Signals)COTBase iCOT indicator is based on reverse-engineering the Commitments of Traders data and creating a proprietary algo, which mimics real COT data on any time-frame and chart type.
We advise to use it mainly on time-based charts, on smaller than 4 hr per bar time-frames. A multi-time-frame analysis is recommended where the smaller time-frame signals are confirmed by the higher time-frames.
This indicator is the Signal part of the COTBase iCOT package. Please apply it to the price chart to see the yellow markers (Commercials extremes), blue bars (Speculators extremes) and 3-fold confluences (green and black background stripes).
Features:
Versatile
You can use the COTBase iCOT indicator on any chart type (eg. candlesticks , bar charts, renko, range bars, etc.) and time-frames (eg. 1-min, 5-min , 1-hr, 4-hr, etc.).
Proprietary algo
We used AI and various other methods to create a truly unique indicator that - we believe - descibes market forces the most efficient way.
We have found that this is possibly the closest we could get to a realistic estimation of the fundamental forces driving the market.
Data does not come from CFTC
The COTBase iCOT indicator does not source any of its data from the Commodity Futures Trading Commission.
Accurate signal logic
We mark "pseudo-Commercial" buy/sell setups with a yellow diamond below/above the price. We mark "pseudo-Speculator" buy/sell signals with blue bars.
The statistically best "3-fold confluence" setups are marked with green/red stripes (and/or other markers).
Key features:
Allow plotting pseudo-Commercials and Change, pseudo-Speculators and Change, Balance Line and Change.
Allow highlighting any of the above series if they cross above/below a user defined threshold
Allow configuring the strength and markings of "All Signal" confluences
Allow setting the logic for Change calculations and markings
Sound alerts
Compatibility:
Instruments: futures , cryptocurrencies, forex, stocks, CFDs, indices, options
Interval types: time and non-time-based, standard or custom
Chart styles: any
You can obtain this indicator by visiting the link below.
Machine Learning: kNN-based StrategykNN-based Strategy (FX and Crypto)
Description:
This strategy uses a classic machine learning algorithm - k Nearest Neighbours (kNN) - to let you find a prediction for the next (tomorrow's, next month's, etc.) market move. Being an unsupervised machine learning algorithm, kNN is one of the most simple learning algorithms.
To do a prediction of the next market move, the kNN algorithm uses the historic data, collected in 3 arrays - feature1, feature2 and directions, - and finds the k-nearest
neighbours of the current indicator(s) values.
The two dimensional kNN algorithm just has a look on what has happened in the past when the two indicators had a similar level. It then looks at the k nearest neighbours,
sees their state and thus classifies the current point.
The kNN algorithm offers a framework to test all kinds of indicators easily to see if they have got any *predictive value*. One can easily add cog, wpr and others.
Note: TradingViews's playback feature helps to see this strategy in action.
Warning: Signals ARE repainting.
Style tags: Trend Following, Trend Analysis
Asset class: Equities, Futures, ETFs, Currencies and Commodities
Dataset: FX Minutes/Hours+++/Days
Cyatophilum Scalper [ALERTSETUP]This indicator comes with a backtest and alert version. This is the alert version. Its purpose is to create low timeframe and scalping strategies, by choosing from a list of built-in entry points which are described in detail below, and by configuring a risk management system to your liking.
Before diving into the entry points, I will explain the strategy and risk management settings.
These 3 settings allow to choose your strategy direction, and main behavior.
- Go Long ↗: activate or deactivate long entry points.
- Go Short ↘: activate or deactivate short entry points.
- Reversal strategy ↗↘↗↘: Activate this option will allow trades to reverse position from an opposite entry point. Keep it deactivated and trades will either wait a TakeProfit(TP) or StopLoss(SL) to be closed. When neither SL nor TP or set, this option is automatically activated.
StopLoss settings:
Both Long and Short SL can be activated and configured.
The base % price is the starting point of the stoploss, in a percentage of current price.
Trailing stop, when activated, works with 2 settings:
- % Price to Trigger: a percentage of current price the price should move in a bar to trigger a trailing movement.
- % Price Movement: the stoploss variation in a percentage of current price that moves on each bar.
TakeProfit settings:
Both Long and Short TP can be activated and configured.
The base % price is the value of the TP, in a percentage of current price.
Trailing Profit Deviation %: Percent deviation for the trailing take profit.
DCA:
DCA stands for Dollar Cost Average. The idea is to open additional orders from the base order so as to improve risk management.
These additional orders are also called Safety Orders. The indicator can handle up to 9 safety orders.
The strategy will exit either from a take profit based on percentage from base order or from a total volume percentage (Configurable in the parameters).
The steps spacing (space between each step) and safety orders volume (order size) can both scale by adding a scale multiplier.
By choosing from the base strategy dropdown menu, the indicator will generate entry points.
1. BUY SELL:
-> Low timeframes spot trading, with simple buy and sell orders.
How it works:
The indicator used is a combination of QQE (Atr based trend following indicator) and RMA 100 trendline.
I think the QQE does a great job in low timeframes because it is not impacted by the noise.
The RMA which is the moving average used in the RSI, will help giving confirmation to the entry points.
How to use:
It is meant to be used as a reversal strategy, but you can add a TP or SL if you want.
When comparing to Buy & Hold, make sure to deactivate the "Short results in the backtest" setting.
2. TREND SCALPING
-> A strategy for low timeframes trading.
How it works:
The strategy creates high volatility entries filtered by a duo convergence of adaptive trendlines (Adaptive HULL MA using the chart's resolution, Adaptive Tilson T3 using 1H resolution) and a higher timeframe (1H) RSI filter (long threshold: 70, short threshold: 40, RSI length: 10).
How to use:
Must be used on charts with a resolution smaller than 1H. Recommended: from 1m to 30m.
Must NOT be used as reversal strategy. Use it with a take profit and stop loss, and DCA if you can.
Sample risk management settings:
3. Support/Resistance BREAKOUTS
-> Trade low timeframes pivot points breakouts.
How it works:
The indicator calculates the 100 previous bars swing high and low. Any break above high or below low will trigger an entry point.
The entry is however filtered by an Adaptive Tilson T3 Trendline, an ADX 30 minimum threshold and a minimum average volume threshold.
How to use:
I recommend to click "Reversal" Strategy and set a Takeprofit target.
Find the best timeframe between 1m and 30m using the backtest version.
Example here with BTCUSDTPERP on 15m:
4. AGGRESSIVE SCALPING
-> Lots of trades in low timeframes.
How it works:
Created using Cyato AI, Higher/Lower Highs and Lows and 2 HULLMA crosses as entries, and 2 Adaptive Tilson T3 as trendfilter, a 25 ADX threshold filter and a volume filter.
How to use:
Recommended Risk Management settings: Takeprofit, Stoploss and DCA (Safety orders).
Find which timeframe work the best from 30 min and below. Should not be used above 30 min since this is the resolution for the MTF Tilson.
How to create Alerts:
Click Add alert, then select the indicator, and choose the alert for your order.
Most used alerts are "LONG ENTRY", "SHORT ENTRY" and "ALL EXITS".
You will find a description of each alert in the default alert message.
To gain access to this paid indicator, please use the link below.
Cyatophilum Scalper [BACKTEST]This indicator comes with a backtest and alert version. This is the backtest version. Its purpose is to create low timeframe and scalping strategies, by choosing from a list of built-in entry points which are described in detail below, and by configuring a risk management system to your liking.
Before diving into the entry points, I will explain the strategy and risk management settings.
These 3 settings allow to choose your strategy direction, and main behavior.
- Go Long ↗: activate or deactivate long entry points.
- Go Short ↘: activate or deactivate short entry points.
- Reversal strategy ↗↘↗↘: Activate this option will allow trades to reverse position from an opposite entry point. Keep it deactivated and trades will either wait a TakeProfit(TP) or StopLoss(SL) to be closed. When neither SL nor TP or set, this option is automatically activated.
StopLoss settings:
Both Long and Short SL can be activated and configured.
The base % price is the starting point of the stoploss, in a percentage of current price.
Trailing stop, when activated, works with 2 settings:
- % Price to Trigger: a percentage of current price the price should move in a bar to trigger a trailing movement.
- % Price Movement: the stoploss variation in a percentage of current price that moves on each bar.
TakeProfit settings:
Both Long and Short TP can be activated and configured.
The base % price is the value of the TP, in a percentage of current price.
Trailing Profit Deviation %: Percent deviation for the trailing take profit.
DCA:
DCA stands for Dollar Cost Average. The idea is to open additional orders from the base order so as to improve risk management.
These additional orders are also called Safety Orders. The indicator can handle up to 9 safety orders.
The strategy will exit either from a take profit based on percentage from base order or from a total volume percentage (Configurable in the parameters).
The steps spacing (space between each step) and safety orders volume (order size) can both scale by adding a scale multiplier.
By choosing from the base strategy dropdown menu, the indicator will generate entry points.
1. BUY SELL:
-> Low timeframes spot trading, with simple buy and sell orders.
How it works:
The indicator used is a combination of QQE (Atr based trend following indicator) and RMA 100 trendline.
I think the QQE does a great job in low timeframes because it is not impacted by the noise.
The RMA which is the moving average used in the RSI, will help giving confirmation to the entry points.
How to use:
It is meant to be used as a reversal strategy, but you can add a TP or SL if you want.
When comparing to Buy & Hold, make sure to deactivate the "Short results in the backtest" setting.
2. TREND SCALPING
-> A strategy for low timeframes trading.
How it works:
The strategy creates high volatility entries filtered by a duo convergence of adaptive trendlines (Adaptive HULL MA using the chart's resolution, Adaptive Tilson T3 using 1H resolution) and a higher timeframe (1H) RSI filter (long threshold: 70, short threshold: 40, RSI length: 10).
How to use:
Must be used on charts with a resolution smaller than 1H. Recommended: from 1m to 30m.
Must NOT be used as reversal strategy. Use it with a take profit and stop loss, and DCA if you can.
Sample risk management settings:
3. Support/Resistance BREAKOUTS
-> Trade low timeframes pivot points breakouts.
How it works:
The indicator calculates the 100 previous bars swing high and low. Any break above high or below low will trigger an entry point.
The entry is however filtered by an Adaptive Tilson T3 Trendline, an ADX 30 minimum threshold and a minimum average volume threshold.
How to use:
I recommend to click "Reversal" Strategy and set a Takeprofit target.
Find the best timeframe between 1m and 30m using the backtest version.
Example here with BTCUSDTPERP on 15m:
4. AGGRESSIVE SCALPING
-> Lots of trades in low timeframes.
How it works:
Created using Cyato AI, Higher/Lower Highs and Lows and 2 HULLMA crosses as entries, and 2 Adaptive Tilson T3 as trendfilter, a 25 ADX threshold filter and a volume filter.
How to use:
Recommended Risk Management settings: Takeprofit, Stoploss and DCA (Safety orders).
Find which timeframe work the best from 30 min and below. Should not be used above 30 min since this is the resolution for the MTF Tilson.
How to create Strategy Alerts:
Write your alert messages for EXIT, LONG and SHORT orders in the settings (Backtest section).
Then click add alert, and in the alert message, write the following:
{{strategy.order.alert_message}}
BACKTEST PARAMETERS
- Inital capital: 10 000$
- Base order size: 0.1 contract (0.1 btc)
- Safety order size: 0.1 contract (0.1 btc)
- Commission: 0.1%
- Slippage: 100 ticks
Oldest trade: 2020-08-31
Backtest Period: From 2020-08-31 to 2020-11-12
Configuration used: see the live chart configuration panel at the top.
To gain access to this paid indicator, please use the link below.
MAMMON v-1EN :
welcome everyone to MAMMON.
I coded this indicator to allow you to quickly and easily identify a price trend, refer to the last color of a horizontal bar, you will have your trend.
if your last horizontal bar is red then the period is bearish, if this bar is green then the trend is bullish.
MAMMON also includes indications on candles (buy / sell arrow - blue and red) which allows you to find good entry prices in trends, these indications are calculated on 2 criteria, pivot point and reversal.
It is recommended to use MAMMON only on 4h - 1D -1W charts and to couple the MAMMON indicator to the MAM-MOM indicator.
The strategy tester shows 32% profit on btc / usd on a daily chart.
To access this indicator please contact me by private message on trading view, you will soon find a dedicated website in the "signature" of my profile and in "about me".
If you have a question contact me by private message please.
FR :
bienvenue a tous sur MAMMON.
j'ai codé cet indicateur pour vous permettre d'identifier simplement et rapidement une tendance de prix, prenez référence à la dernière couleur d'une barre horizontale, vous aurez votre tendance.
si votre dernière barre horizontale est rouge alors la période est baissière, si cette barre est verte alors la tendance est haussière.
MAMMON inclut aussi des indications sur des bougies (flèche buy/sell - bleu et rouge) ce qui vous permet de trouver de bons prix d'entrée dans des tendances, ces indications sont calculées sur 2 critères, point pivot et renversement.
Il est recommandé d'utiliser MAMMON uniquement sur des graphiques 4 h - 1D -1W et de couplé l'indicateur MAMMON à l'indicateur MAM-MOM.
Le testeur de stratégie indique 32% de profit sur btc/usd en graphique daily.
Pour accéder à cet indicateur veuillez me contact par message privé sur trading view, vous trouverez bientôt un site web dédié dans la "signature" de mon profil et dans "à propos de moi".
Si vous avez une question me contacté par message privé svp.
Cyatophilum Swing Trader [ALERTSETUP]This is an indicator for swing trading which allows you to build your own strategies, backtest and alert. This version is the alertsetup which allows to create automated alerts hosted on TradingView servers that will trigger in form of emails, SMS, webhooks, notifications, and more. The backtest version can be found in my profile scripts page.
The particularity of this indicator is that it contains several indicators, including a custom one, that you can choose in a drop down list, as well as a trailing stop loss and take profit system.
The current indicators are :
CYATO AI: a custom indicator inspired by Donchian Channels that will catch each big trend and important reversal points .
The indicator has two major "bands" or channels and two minor bands. The major bands are bigger and are always displayed.
When price reaches a major band, acting as a support/resistance, it will either bounce on it or break through it. This is how "tops" and "bottoms", and breakouts are caught.
The minor bands are used to catch smaller moves inside the major bands. A combination of volume, momentum and price action is used to calculate the signals.
Advantages of this indicator: it should catch top and bottoms better than other swing trade indicators.
Cons of this indicator: Some minor moves might be ignored. Sometimes the script will catch a fakeout due to the Bands design.
Best timeframes to use it : 2H~4H
Sample:
Other indicators available:
SARMA: A combination of Parabolic Stop and Reverse and Exponential Moving Average (20 and 40) .
SAR: Regular Parabolic Stop and Reverse .
QQE: An indicator based on Quantitative Qualitative Estimation .
SUPERTREND: A reversal indicator based on Average True Range .
CHANNELS: The classic Donchian Channels .
More indicators might be added in the future.
About the signals: each entry (long & short) is calculated at bar close to avoid repainting. Exits (SL & TP) can either be intra-bar or at bar close using the Exit alert type parameter.
STOP LOSS SYSTEM
The base indicators listed above can be used with or without TP/SL.
TP and SL can be both turned on and off and configured for both directions.
The system can be configured with 3 parameters as follows:
Stop Loss Base % Price: Starting Value for LONG/SHORT stop loss
Trailing Stop % Price to Trigger First parameter related to the trailing stop loss. Percentage of price movement in the right direction required to make the stop loss line move.
Trailing Stop % Price Movement: Second parameter related to the trailing stop loss. Percentage for the stop loss trailing movement.
Another option is the "Reverse order on Stop Loss". Use this if you want the strategy to trigger a reverse order when a stop loss is hit.
TAKE PROFIT SYSTEM
The system can be configured with 2 parameters as follows:
Take Profit %: Take profit value in percentage of price.
Trailing Profit Deviation %: Percent deviation for the trailing take profit.
Combining indicators and Take Profit/Stop Loss
One thing to note is that if a reversal signal triggers during a trade, the trade will be closed before SL or TP is reached.
Indeed, the base indicators are reversal indicators, they will trigger long/short signals to follow the trend.
It is possible to use a takeprofit without stop loss, like in this example, knowing that the signal will reverse if the trade goes badly.
The base indicators settings can be changed in the "Advanced Parameters" section.
Configuration used for this snapshot:
ALERTS DEFINITION
Each alert correspond to the labels on chart.
01. LONG ENTRY (BUY) : Long alert
02. LONG STOP LOSS : Long stop loss event
03. LONG TAKE PROFIT : Long take profit event
04. SHORT ENTRY (SELL) : Short alert
05. SHORT STOP LOSS : Short stop loss event
06. SHORT TAKE PROFIT : Short take profit event
07. LONG EXIT : Long exit alert. Triggers on both Stop loss and Take Profit
08. SHORT EXIT : Short exit alert. Triggers on both Stop loss and Take Profit
09. ALL TAKE PROFITS : Long and Short Take Profits. Both directions.
10. ALL STOP LOSSES : Long and Short Stop Losses. Both directions.
11. ALL EXITS : Long and Short exits alert. Stop Loss and Take Profit both Long and Short.
Use the link below to obtain access to this indicator.
Cyatophilum Swing Trader [BACKTEST]This is an indicator for swing trading which allows you to build your own strategies, backtest and alert. This version is the backtest which allows to use the Strategy Tester. The alert version can be found in my profile scripts page.
The particularity of this indicator is that it contains several indicators, including a custom one, that you can choose in a drop down list, as well as a trailing stop loss and take profit system.
The current indicators are :
CYATO AI: a custom indicator inspired by Donchian Channels that will catch each big trend and important reversal points .
The indicator has two major "bands" or channels and two minor bands. The major bands are bigger and are always displayed.
When price reaches a major band, acting as a support/resistance, it will either bounce on it or break through it. This is how "tops" and "bottoms", and breakouts are caught.
The minor bands are used to catch smaller moves inside the major bands. A combination of volume, momentum and price action is used to calculate the signals.
Advantages of this indicator: it should catch top and bottoms better than other swing trade indicators.
Cons of this indicator: Some minor moves might be ignored. Sometimes the script will catch a fakeout due to the Bands design.
Best timeframes to use it : 2H~4H
Sample:
Other indicators available:
SARMA: A combination of Parabolic Stop and Reverse and Exponential Moving Average (20 and 40) .
SAR: Regular Parabolic Stop and Reverse .
QQE: An indicator based on Quantitative Qualitative Estimation .
SUPERTREND: A reversal indicator based on Average True Range .
CHANNELS: The classic Donchian Channels .
More indicators might be added in the future.
About the signals: each entry (long & short) is calculated at bar close to avoid repainting. Exits (SL & TP) can either be intra-bar or at bar close using the Exit alert type parameter.
STOP LOSS SYSTEM
The base indicators listed above can be used with or without TP/SL.
TP and SL can be both turned on and off and configured for both directions.
The system can be configured with 3 parameters as follows:
Stop Loss Base % Price: Starting Value for LONG/SHORT stop loss
Trailing Stop % Price to Trigger First parameter related to the trailing stop loss. Percentage of price movement in the right direction required to make the stop loss line move.
Trailing Stop % Price Movement: Second parameter related to the trailing stop loss. Percentage for the stop loss trailing movement.
Another option is the "Reverse order on Stop Loss". Use this if you want the strategy to trigger a reverse order when a stop loss is hit.
TAKE PROFIT SYSTEM
The system can be configured with 2 parameters as follows:
Take Profit %: Take profit value in percentage of price.
Trailing Profit Deviation %: Percent deviation for the trailing take profit.
Combining indicators and Take Profit/Stop Loss
One thing to note is that if a reversal signal triggers during a trade, the trade will be closed before SL or TP is reached.
Indeed, the base indicators are reversal indicators, they will trigger long/short signals to follow the trend.
It is possible to use a takeprofit without stop loss, like in this example, knowing that the signal will reverse if the trade goes badly.
The base indicators settings can be changed in the "Advanced Parameters" section.
Configuration used for this snapshot:
BACKTEST SETTINGS
· Initial Capital: 10 000 $
· Order Size: 10% equity (to avoid compounding effect)
· Commission : 0.1% per order (total commission paid: 244.41 €)
· Slippage: 5 ticks
Oldest trade: 2014-04-01
Backtest Period: From 2014-04-01 to 2020-09-04
Use the link below to obtain access to this indicator.