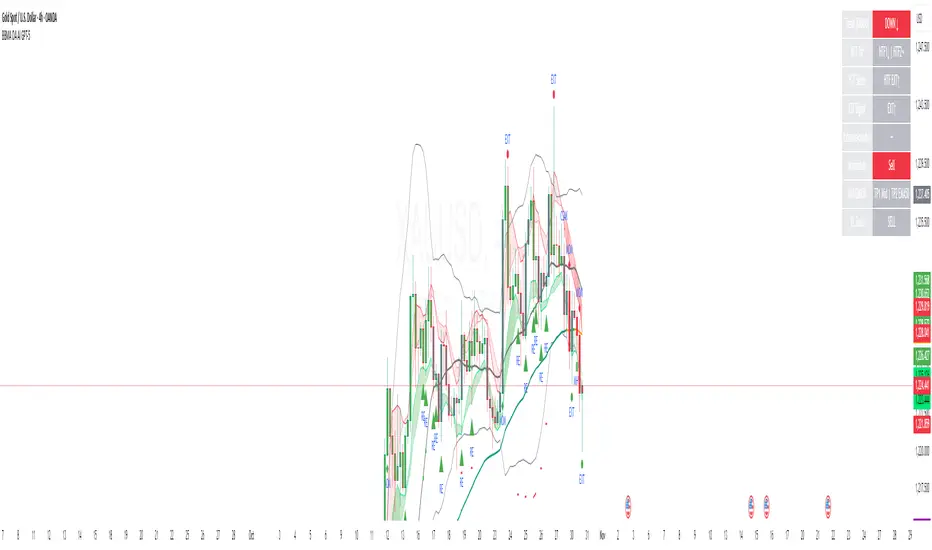
Serum Oscillator [ST]Serum Oscillator is an advanced technical indicator. This indicator combines several techniques and algorithms to provide traders with a robust tool for analyzing and predicting market movements. The indicator is not just an oscillator, but also includes functionalities for detecting divergences, mining flow, custom alerts, and more. Below is a detailed description of its features, components, and functionalities.
Characteristics
1. Oscillator and Signal: the indicator has a moving line that acts as a signal to determine the state of the market, whether bullish or bearish. In addition, this moving line can be switched between different types for greater accuracy, allowing it to better suit the trader's style.
2. Modes: the indicator has three modes to adapt to the market. Fast, Normal and Slow. The user can choose the mode that best suits his strategy. Fast mode generates very early signals, perfect for getting ahead of the market; however, it can also generate a greater number of false crosses. Slow mode generates fewer signals, perfect for filtering range zones.
3. Overbought and Oversold Levels: the indicator generates signals between values 0 and 100, for this reason it can be speculated that values 70 and 30 are overbought and oversold levels respectively; however, these levels can vary according to the modes. For this reason we designed the dynamic bands.
4. Multi Timeframe: Can observe data from a different time frame than the current chart. You will be able to observe the state of the oscillator and the direction.
5. Trend Catcher: tool to detect the market trend according to the indicator. Ideal for filtering false crossovers and trading in favor of the trend.
6. Smart Flow: Money flow optimized with AI to detect the overall money flow. Ideal for detecting trends. Additionally, you will be able to visualize the convergences between smart flow and the oscillator to operate in favor of the price trend. You can also activate thresholds, to detect when there is really a large monetary flow.
7. Divergences: Real-time detection of divergences to identify possible reversal zones. The user can adjust the sensitivity.
8. Alerts: Programmable alerts to automate the detection of various price conditions according to the indicator.
> This indicator is a comprehensive technical tool that provides traders with multiple capabilities to analyze market trends and reversals. Its combination of different types of smoothing and adaptive functions, along with the detection of divergences, trend lines, and custom alerts, makes it a powerful and versatile indicator for trading decision-making. The customization of its parameters and the depth of its calculations offer users a significant advantage in interpreting market data, facilitating more precise understanding and timely action in their trading operations.
Cerca negli script per "ai"
Smart Adaptive Signal SystemSmart Adaptive Signal System
Description: The Smart Adaptive Signal System is a sophisticated indicator that generates intelligent buy/sell signals by dynamically adapting to market conditions. It predicts target prices based on momentum and volatility, providing more accurate and reliable trading opportunities.
How It Works:
Dynamic Signal Generation: The system predicts target prices by considering factors such as volatility and momentum. This allows it to react instantly to trend changes and market fluctuations.
Adaptive Thresholds: Buy and sell signals are triggered with adaptive thresholds, adjusting according to market volatility. This ensures flexibility in the face of sudden market changes.
Trend-Based Reset: Users can choose to reset threshold values based on a time interval or trend change. This feature helps the system re-adapt to current market conditions for greater accuracy.
Target Price Prediction: Target prices are calculated using momentum and volatility, helping the system predict future price movements.
How to Use:
Buy/Sell Signals: The indicator generates buy and sell signals based on market conditions. Look for a "down arrow" for a buy signal and an "up arrow" for a sell signal on the chart.
Target Price Lines: Along with buy and sell signals, the system draws target price lines. This helps you visualize potential future price levels.
Flexible Settings: Users can customize analysis periods, minimum change percentages, and other parameters to fit their needs.
Features:
Dynamic buy and sell signals
Target price predictions
Volatility and momentum-based analysis
User-friendly and flexible settings
Trend-based adaptive resetting
Alerts: The Smart Adaptive Signal System responds quickly to sudden market changes, but always use it in conjunction with other indicators like support and resistance levels. Signal accuracy may vary depending on market conditions.
Flux Charts - SFX Automation💎 GENERAL OVERVIEW
The SFX Automation is a powerful and versatile tool designed to help traders rigorously test their trading strategies against historical market data. With various advanced settings, traders can fine-tune their strategies, assess performance, and identify key improvements before deploying in live trading environments. This tool offers a wide range of configurable settings, explained within this write-up.
Features of the new SFX Automation :
Step By Step : Configure your strategy step by step, which will allow you to have OR & AND logic in your strategies.
Highly Configurable : Offers multiple parameters for fine-tuning trade entry and exit conditions.
Multi-Timeframe Analysis : Allows traders to analyze multiple timeframes simultaneously for enhanced accuracy.
Provides advanced stop-loss, take-profit, and break-even settings.
Incorporates Buy & Sell signals, with settings like Signal Sensitivity, Strength, Time Weighting, Dynamic TP & SL Methods and more for refined strategy execution.
🚩 UNIQUENESS
The SFX Automation stands out from conventional backtesting tools due to its unparalleled flexibility, precision, and advanced trading logic integration. Key factors that make it unique include:
✅ Comprehensive Strategy Customization – Unlike traditional backtesters that offer basic entry and exit conditions, SFX Automation provides a highly detailed parameter set, allowing traders to fine-tune their strategies with precision.
✅ Multi-Timeframe Signals – This is the first-ever tool that allows traders to backtest Buy & Sell Signals on multiple timeframes.
✅ Customizable Take-Profit Conditions – Offers various methods to set take-profit exits, including using core features from SFX Algo, and dynamic exits like signal rating upgrades/downgrades, enabling traders to tailor their exit strategies to specific market behaviors.
✅ Customizable Stop-Loss Conditions – Provides several ways to set up stop losses, including using concepts from SFX Algo and trailing stops or dynamic exits like signal rating upgrades/downgrades, allowing for dynamic risk management tailored to individual strategies.
✅ Integration of External Indicators – Allows the inclusion of other indicators or data sources from TradingView for creating strategy conditions, enabling traders to enhance their strategies with additional insights and data points.
By integrating these advanced features, SFX Automation ensures that traders can rigorously test and optimize their strategies with great accuracy and efficiency.
📌 HOW DOES IT WORK ?
The first setting you will want to set it the pyramiding setting. This setting controls the number of simultaneous trades in the same direction allowed in the strategy. For example, if you set it to 1, only one trade can be active in any time, and the second trade will not be entered unless the first one is exited. If it is set to 2, the script will handle both of them at the same time. Note that you should enter the same value to this pyramiding setting, and the pyramiding setting in the "Properties" tab of the script for this to work.
You can enable and set a backtesting window that will limit the entries to between the start date & end date.
Entry Conditions
From the "Long Conditions" or the "Short Conditions" groups, you can set your position entry conditions. For settings like "initial capital" or "order size", you can open the "Properties" tab, where these are handled.
The SFX Algo can use the following conditions for entry conditions :
1. Buy Signal (Any, or 1-5 ☆)
This condition is triggered when a Buy Signal occurs. Other timeframes are supported with this condition.
2. Buy | TP (1, 2 or 3)
This condition is triggered when a TP signal of any Buy signal occurs.
3. Buy | SL
This condition is triggered when a SL signal of any Buy signal occurs.
4. Buy | Rating Upgrade
This condition is triggered when the rating of a buy signal is increased.
5. Buy | Rating Downgrade
This condition is triggered when the rating of a buy signal is decreased.
6. Sell Signal (Any, or 1-5 ☆)
This condition is triggered when a Sell Signal occurs. Other timeframes are supported with this condition.
7. Sell | TP (1, 2 or 3)
This condition is triggered when a TP signal of any Sell signal occurs.
8. Sell | SL
This condition is triggered when a SL signal of any Sell signal occurs.
9. Sell | Rating Upgrade
This condition is triggered when the rating of a sell signal is increased.
10. Sell | Rating Downgrade
This condition is triggered when the rating of a sell signal is decreased.
11. Retracement Wave Retest (Bullish or Bearish)
A retest on the Retracement Wave occurs when the price temporarily moves against the prevailing trend, touching or entering the wave before continuing in the original trend direction. This retest serves as a confirmation that the wave is acting as dynamic support or resistance.
12. Retracement Wave Retracement (Bullish or Bearish)
A retracement on the Retracement Wave occurs when the price touches the wave, the condition is triggered immediately.
13. Volatility Bands Retest (Bullish or Bearish)
A retest of Volatility Bands occurs when the price initially moves beyond the bands, then pulls back to "retest" the band it just broke through before continuing its move. This can provide traders with confirmation of a breakout or signal a potential reversal.
14. Volatility Bands Retracement (Bullish or Bearish)
A retracement on the Volatility Bands occur when the price touches the band, the condition is triggered immediately.
🕒 TIMEFRAME CONDITIONS
The SFX Automation supports Multi-Timeframe (MTF) features for Buy & Sell signals. When setting an entry condition, you can also choose the timeframe.
External Conditions
Users can use external indicators on the chart to set entry conditions.
The second dropdown in the external condition settings allows you to choose a conditional operator to compare external outputs. Available options include:
Less Than or Equal To: <=
Less Than: <
Equal To: =
Greater Than: >
Greater Than or Equal To: >=
The position entry conditions work like this ;
Each side has 3 SFX Algo conditions and 2 Source conditions. Each condition can be enabled or disabled using the checkbox on the left side of them.
You can select which timeframe this condition should work on for Buy & Sell signals. If you select "Chart", the condition will work for the chart's current timeframe.
Lastly select the step of this condition from 1 to 6.
The Source Condition
The last condition on each side is a source condition that is different from the others. Using this condition, you can create your own logic using other indicators' outputs on your chart. For example, suppose that you have an EMA indicator in your chart. You can have the source condition to something like "EMA > high".
The Step System
Each condition has a step number, and conditions are in topological order based on them.
The conditions are executed step by step. This means the condition with step 2 cannot be executed before the condition with step 1 is executed.
Conditions with the same step numbers have "OR" logic. This means that if you have 2 conditions with step 3, the condition with step 4 can trigger after only one of the step 3 conditions is executed.
➕ OTHER ENTRY FEATURES
The SFX Automation allows traders to choose when to execute trades and when not to execute trades.
1. Only Take Trades
This setting lets users specify the time period when their strategy can open or execute trades.
2. Don't Take Trades
This setting lets users specify time periods when their strategy can't open or execute trades.
↩️ EXIT CONDITIONS
1. Exit on Opposite Signal
When enabled, a long position will close when short entry conditions are met, and a short position will close when long entry conditions are met.
2. Exit on Session End
When enabled, positions will be closed at the end of the trading session.
📈 TAKE PROFIT CONDITIONS
There are several methods available for setting take profit exits and conditions.
1. Entry Condition TP
Users can use entry conditions as triggers for take profit exits. This setting can be found under the long and short exit conditions.
2. Fixed TP
Users can set a fixed TP for exits. This setting can be found under the long and short exit conditions. Users can choose between the following:
Price: This method triggers a TP exit when price reaches a specified level. For example, if you set the Price TP to 10 and buy NASDAQ:TSLA at $190, the trade will automatically exit when the price reaches $200 ($190 + $10).
Ticks: This method triggers a TP exit when price moves a specified number of ticks.
Percentage (%): This method triggers a TP exit when price moves a specified percentage.
ATR: This method triggers a TP exit based on a specified multiple of the Average True Range (ATR).
🧩EXIT PERCENTAGES
For each 3 dynamic take-profit conditions, you can set the amount of the position to exit in terms of percentage. It's important to make sure that the total of the exit percentages are 100%.
📉 STOP LOSS CONDITIONS
There are several methods available for setting stop-loss exits and conditions.
1. Entry Condition SL
Users can use entry conditions as triggers for stop-loss exits. This setting can be found under the long and short exit conditions.
2. Fixed SL
Users can set a fixed SL for exits. This setting can be found under the long and short exit conditions. Users can choose between the following:
Price: This method triggers a SL exit when price reaches a specified level. For example, if you set the Price SL to 10 and buy NASDAQ:TSLA at $200, the trade will automatically exit when the price reaches $190 ($200 - $10).
Ticks: This method triggers a SL exit when price moves a specified number of ticks.
Percentage (%): This method triggers a SL exit when price moves a specified percentage.
ATR: This method triggers a SL exit based on a specified multiple of the Average True Range (ATR).
3. Trailing Stop
An explanation & example for the trailing stop feature is present on the write-up within the next section.
Exit conditions have the same logic of constructing conditions like the entry ones. You can construct a Take-Profit Condition & a Stop-Loss Condition. Note that the Take-Profit condition will only work if the position is in profit, regardless of if it's triggered or not. The same applies for the Stop-Loss condition, meaning that it will only work if the position is in loss.
You can also set a Fixed TP & Fixed SL based on the price movement after the position is entered. You have options like "Price", "Ticks", "%", or "Average True Range". For example, you can set a Fixed TP like "5%", and the position will be entered once it moves 5% up in a long position.
Trailing Stop
For the Fixed SL, you also have a "Trailing" stop option, which you can set it's activation level as well. The Trailing stop activation level and it's value are expressed in ticks. Check this scenerio for an example :
We have a ticker with a tick value of $1. Our Trailing Stop is set to 10 ticks, and the activation level is set to 30 ticks.
We buy 1 contract when the price is $100.
When the price becomes $110, we are in $10 (10 ticks) profit and the trailing stop is now activated.
The current price our stop's on is $110 - $30 (30 ticks), which is the level of $80.
The trailing stop will only move if the price moves up the highest high the price has been after we entered the position.
Let's suppose that price moves up $40 right after our trailing stop is activated. The price will now be $150, and our trailing stop will sit on $150 - $30 (30 ticks) = $120.
If the price is down the $120 level, our stop loss will be triggered.
There is also a "Hard SL" option designed for a backup stop-loss when trailing stops are enabled. You can enable & set this option and if the price goes down before our trailing stop even activates, the position will be exited.
You can also move stop-loss to the break-even (entry price of the position) after a certain profit is achieved using the last setting of the exit conditions. Note that for this to work, you will need to have a Fixed SL setup.
➕ OTHER EXIT FEATURES
1. Move Stop Loss to Breakeven
This setting allows the strategy to automatically move the SL to Breakeven (BE) when the position is in profit by a certain amount. Users can choose between the following:
Price: This method moves the SL to BE when price reaches a specified level.
Ticks: This method moves the SL to BE when price moves a specified number of ticks.
Percentage (%): This method moves the SL to BE when price moves a specified percentage.
ATR: This method moves the SL to BE when price moves a specified multiple of the Average True Range (ATR).
Example Entry Scenario
To give an example , check this scenario; out conditions are :
LONG CONDITIONS
Buy Signal Any☆, Step 1
Bullish R. Wave Retest, Step 2
Bullish V. Bands Retest, Step 2
open > close, Step 3
First, the strategy needs to detect a Buy Signal with any star rating in order to start working.
After it's detected, now it's looking for either a Bullish R. Wave Retest, or a Bullish V. Bands Retest to proceed to the next step, the reason for this is that they both have the same step number.
After one of them is detected, the strategy will consistently check candlesticks for the condition open > close. If a bullish candlestick occurs, a long position will be entered.
⏰ ALERTS
This indicator uses TradingView's strategy alert system. All entries and exits will be sent as an alert if configured. It's possible to further customize these alerts to your liking. For more information, check TradingView's strategy alert customization page: www.tradingview.com
⚙️ SETTINGS
1. Backtesting Settings
Pyramiding: Controls the number of simultaneous trades allowed in the strategy. This setting must have the same value that is entered on the script's properties tab on the settings pane.
Enable Custom Backtesting Period: Restricts backtesting to a specific date range.
Start & End Time Configuration: Define precise start and end dates for historical analysis.
2. Algorithm Settings
Sensitivity: The sensitivity setting is a key parameter that influences the number of signals the SFX Algo generates. By adjusting this parameter, you can control the frequency of signals produced by the algorithm.
Signal Strength: The Signal Strength setting filters signals based on their quality, allowing traders to focus on the most reliable opportunities. This feature helps traders balance the quantity and reliability of the algorithm’s signals to suit their trading strategy.
Time Weighting: The Time Weighting setting determines how the SFX Algo evaluates historical market data to generate signals.
a) Recent Trends
Focuses on the most recent movements for short-term analysis. This setting is good for scalpers and intraday traders who need to react quickly to market changes.
b) Mixed Trends
Balances recent and historical price movements for a comprehensive market view. This setting is well-suited for swing traders and those who want to capture medium-term opportunities by combining the benefits of short-term responsiveness with the reliability of long-term trends.
c) Long-term Trends
Relies on extended historical market data to identify broader market trends, making it an excellent choice for traders focused on long-term strategies.
Minimum Star Rating: The Minimum Star Rating setting allows you to filter signals based on their strength, showing only those that meet or exceed your chosen threshold. For instance, setting the minimum star rating to 3 ensures you only receive signals with a rating of 3 stars or higher.
3. Take Profit / Stop Loss Methods
Key Levels
The Key Levels method uses pivot points to set take profit and stop-loss levels. The TP and SL levels are shown when a new signal is generated.
Volatility Bands
This TP/SL method uses the Volatility Bands overlay to set dynamic TP and SL levels. These levels are not predetermined so they will not be shown in advance when a signal is generated.
Signal Rating
Sets take profit and stop-loss levels based on changes in a signal's rating strength. These levels are not predetermined so they will not be shown in advance when a signal is generated.
Auto Stop-Loss
The auto method can only be applied to the SL. The auto method allows the algorithm to detect SL automatically when a momentum shift is detected. You can adjust the risk tolerance of the Auto SL by adjusting the ‘Auto Risk Tolerance’ setting. You can choose between Low, Medium, and High. A high-risk tolerance will result in stop losses being triggered less often.
4. Entry Conditions for Long & Short Trades
Multiple Conditions (1-6): Configure up to six independent conditions per trade direction.
Timeframe Specification: Choose between timeframes for Buy & Sell signals.
Trade Execution Filters: Restrict trades within specific trading sessions.
5. Exit Conditions for Long & Short Trades
Exit on Opposite Signal: Automatically exit trades upon opposite trade conditions.
Exit on Session End: Closes all positions at the end of the trading session.
Multiple Take-Profit (TP) and Stop-Loss (SL) Configurations:
TP/SL based on % move, ATR, Ticks, or Fixed Price.
Hard SL option for additional risk control.
Move SL to BE (Break Even) after a certain profit threshold.
[Excalibur] Advanced Polynomial Regression Trend ChannelIt's been a long time coming... Regression channel enthusiasts, it's 'ultimately' here! Welcome to my Apophis page. But first, let me explain the origins of its attributed name blending both descriptive & engaging content with concise & technical topics...
EGYPTIAN ROOTED TALES:
Apophis (Greek) or Apep (Egyptian) was known by many cultures to be a mighty Egyptian archetype of chaos, darkness, and destruction. In ancient Egyptian mythology, Apophis was often depicted in the form of a fearsome menacing serpent, in those days, with an insatiable appetite for relentless malevolence. This dreaded entity was considered a formidable enemy and was also believed to appear as a giant serpent arising from the underworld.
Forever engaging in eternal battle, according to lore, Apophis' adversarial attributes represented the forces of disorder and anarchy clashing with the forces of order and harmony. This serpent's wickedly described figure was significantly symbolic of the disruptive, treacherous powers that Apophis embodied, those which threatened to plunge the perceivable archaic world into darkness. To the ancients, the legendary cyclical struggles against Apophis served as allegory reflecting on the macrocosm of the larger conflict between good and evil disparities that shaped early ancient civilization, much like the tree serpent.
One of Apophis’ mythological roots was immortally depicted on tomb stone. On one particular hieroglyphic wall tableau, in the second chamber of Inherkau’s tomb at Deir el-Medina, within the Theban Necropolis, portrays a mural of a serpent (Apep) under an edible fruit tree being slain in defeat. The species of snake depicted on various locations of tomb walls appears to me to bear a striking resemblance to the big eyed Echis pyramidum (Egyptian saw-scaled viper) native to regions of North Africa and the Middle East. It's a species of viper notoriously contributing to the most snake bite fatalities in the world still to this day; talk about a true harbinger of chaos incarnate. You do NOT want to cross paths with this asp in the dark of night, ever! Nor the other species of Echis found around Echid trees in the garden.
As we all know, fabled archaic storytelling can be misconstruing. Yet, these archaic serpent narratives still have echoes of significant notions and wisdom to learn from, especially in a modern technological society still rife with miscalculating deep snakes slithering about with intent to specifically plot disorder on national scales, and then profitably capitalize on it. Many deep black snakes are hiding in plain sight and under rocks. They do indeed speak and spell with forked tongues and malfeasance to the masses. I have great news. Tools now exist in the realms of AI combined with fractal programming circles to uncover these venomous viper mesh networks and investigatively monitor their subversive activities, so their days are surely numbered for... GAME OVER. Prepare to meet the doom you vain vipers have sought!
The arrival of the great and powerful international storm of the century has come, clothed in vindication. It's the only just way for the globe to clean house and move forward economically into the evolving herafter unobstructed by rampant evils and corruption. The foundations of future architectures are being established, and these nefarious obstacles MUST NOT hinder that path ahead.
With my former days of serpent wrangling being behind me, I now explore avenues of history, philosophy, programming, and mathematics, weaving them all into my daily routine. Now is the time to make some mathematical history unfold and get to the good and spicy stuff that you as the reader seek...
CALCULATING ON CHAOS:
Perhaps frightful characteristics of serpents (their maneuverability to adapt to any swervy situation) could be harnessed and channeled into a powerful tool for navigating the treacherous waters of data chaos. What if taming a monstrous beast of mayhem was not only possible, but fully achievable? Well, I think I have improved upon an approach to better tackle fractal chaos handling and observation within a modest PSv6 float environment without doubles. Finally, I've successfully turned my pet anaconda, Apophis, into a docile form of mathematical charting resilience beyond anything I have ever visually witnessed before. This novel work clearly deprecates ALL of my prior regression works by performing everything those delivered AND more, but it doesn't necessarily eliminate them into extinction.
INTRODUCTION:
Allow me to introduce Apophis! What you see showcased above is also referred to as 'Advanced Polynomial Regression Trend Channel' (APRTC) for technical minds. I would describe it as an avant-garde trend channel obtaining accurate polynomial approximations on market data with Pine v6.0. APRTC is a fractal following demystifier that I can only describe as being a signal trajectory tracking stalker manifesting as a data devouring demon. My full-fledged 'Excalibur' version of poly-regression swiftly captures undulating patterns present in market data with ease and at warp speed faster than you can blink. Now unchained, this is my rendering of polynomial wrath employing the "Immense Power of Pine".
By pushing techniques of regression to extremes, I am able to trace the serpentine trajectory of chaos up to a 50th order with 100s or 1000s of samples via "advanced polynomial regression" (APR), aka Apophis. This uniquely reactive trend channel method is designed to enhance the way we engage with the complex challenge of observably interpreting chaotic price behavior. While this is the end of the road for my revolutionary trend channel technology, that doesn't imply that future polynomial regression upgrades won't/might occur... There are a number of other supplementary concepts I have in my mind that could potentially prove useful eventually, who knows. However, for the moment, I feel it's wisest to monitor how accommodating APRTC is towards servers for the present time.
HISTORICAL ENDEAVORS:
Having wrangled countless wild serpents in my youth by the handfuls, tackling this was one multi-headed regression challenge temptation I couldn't resist. Besides, serpents in reality are more than often scared of us in the wild, so I assumed this shouldn't be too terribly hard. Wrong! It's been a complex struggle indeed. APRTC gave me many stinging bites for a LONG time. I had unknowingly opened Pandora's box of polynomials unprepared for what was to follow.
Long have I wrestled with Apophis throughout many nights for years with adversity, at last having arrived at a current grand solution and ultimately emerging victorious. Now, does the significance of the entitled name Apophis become more apparent at this point of reading? What you can now witness above is a very powerful blend of precision combined with maneuverability, concluding my dreamy expectations of a maximal experience with polynomial regression in TV charts. With all of my wizardry components finally assembled, Apophis genuinely is the most phenomenal indicator I ever devised in my life... as of yet.
How was this accomplished? By unlocking a deep understanding of the mathematical principles that govern regression, combined with an arsenal of mathemagical trickeries through sheer determination. I also spent an incredible amount of time flexing the unbendable 64bit float numerics to obtain a feasible order/degree of up to 50 polynomials or up to 4000 bars of regression (never simultaneously) on a labyrinth of samples. Lastly, what was needed was a pinch of mathematical pixie dust with a pleasant dose of Pine upgrades (lots of line re-drawings) that millions of other members can also utilize. Thank you so much, Pine developers, for once again turning meager proposed visions into materialized reality by leveraging the "Power of Pine" for the many!
DESCRIBING POLYNOMIAL REGRESSION:
APRTC is a visual guide for navigating noisy markets, providing both trajectory and structure through the power of mathematical modeling. Polynomial regression, especially at higher orders, exhibits obvious sidewinder/serpentine like characteristics. Even the channel extremities, on swift one second charts, resemble scales in motion with a pair of dashed exterior lines. This poly version presently yields the best quality of fit, providing an extreme "visual analysis" of your price action in high noise environments. The greater the order of the polynomial, the more pronounced the meandering regression characteristics become, as the algorithm strives to visually capture the fundamental fractal patterns most effectively.
Polynomial Regression in Action:
The medial line displays the core polynomial regression approximation in similarity to spinal backbones of serpents when following the movements of market data. Encasing the central structure, the channel's skin consists of enveloping lines having upper and lower extremes. To further enhance visualization, background fill colors distinguish the breadth between positive and negative territories of potential movement.
Additional internal dotted variability lines are available with multiple customizable settings to adjust dynamic dispersion, color, etc. One other exciting feature I added is the the ability to see the polynomial values with up to 50 (adjustable) decimal places if available. Witnessing Xⁿ values tapering near to 0.0 may indicate overfitting. Linear regression is available at order=1 and quadratic regression is invoked using order=2.
Information Criterion:
A toggleable label provides a multitude of information such as Bayesian Information Criterion (BIC), order, period, etc. BIC serves as an polynomial regression fit metric, with lesser values indicating a better balance between polynomial order adjustments, reflecting a more accurate fit in relation to the channel's girth. One downside of BIC values is their often large numerical values, making visual comparisons challenging, and then also their rare occurrence as negative values.
Furthermore, I formulated my own "EXPERIMENTAL" Simpler Information Criterion (SIC) fit metric, which seems to offer better visual interpretability when adjusting order settings on a selected regression period, especially on minuscule price numerics. Positive valued SIC numerics with lesser digits also reflect a preferred better fit during order adjustment, same as applying BIC principles of the minimum having a superior calulation tendency. I'll let members be the judge of deciding whether my SIC is actually a superior information criterion compared to BIC.
TECHNICAL INTERPRETATION and APPLICATION:
The Apophis indicator utilizes high-order polynomial regression, up to a maximum 50th order ability to deliver a nuanced, visual representation of complex market dynamics. I would caution against using upwards toward a 50th order, because opting for a 50th order polynomial is categorically speaking "wildly unsane" in real-world practice. As the polynomial degree increases from lesser orders, the regression line exhibits more pronounced curvature and undulations.
Visually analyzing the regression curve can provide insights into prevailing trends, as well as volatility regimes. For example, a gently sloping line may signal a steady directional trend, while a tightly curled oscillating curve may indicate heightened volatility and range-bound trading. Settings are rather straight forward, and comparable to my former "Quadratic Regression Trend Channel" efforts, although one torturous feature from QRTC is omitted due too computational complexity concerns.
Notice: Trial invite only access will not be granted for this indicator. Those who are familiar with recognizing what APRTC is, you will either want it or not, to add to your arsenal of trading approaches.
When available time provides itself, I will consider your inquiries, thoughts, and concepts presented below in the comments section, should you have any questions or comments regarding this indicator. When my indicators achieve more prevalent use by TV members , I may implement more ideas when they present themselves as worthy additions. Have a profitable future everyone!
RISK DISCLAIMER:
My scripts and indicators are specifically intended for informational and educational use only. This script uses historical data points to perform calculations to derive real-time calculations. They do not infer, indicate, or guarantee future results or performance.
By utilizing this script/indicator or any portion of it, you agree to accept 100% responsibly and liability for your investment or financial decisions, and I will not be held liable for your subjective analytic interpretations incurring sustained monetary losses. The opinions and information visual or otherwise provided by this script/indicator is not investment advice, nor does it constitute recommendation.
Machine Learning SupertrendThe Machine Learning Supertrend is an advanced trend-following indicator that enhances the traditional Supertrend with Gaussian Process Regression (GPR) and kernel-based learning. Unlike conventional methods that rely purely on historical ATR values, this indicator integrates machine learning techniques to dynamically estimate volatility and forecast future price movements, resulting in a more adaptive and robust trend detection system.
At the core of this indicator lies Gaussian Process Regression (GPR), which utilizes a Radial Basis Function (RBF) kernel to model price distributions and anticipate future trends. Instead of simply looking at past price action, it constructs a kernel matrix, enabling a probabilistic approach to price forecasting. This allows the indicator to not only detect current trends but also project potential trend reversals with greater accuracy.
By applying machine learning to ATR estimation, the ML Supertrend dynamically adjusts its thresholds based on predicted values rather than a fixed multiplier. This makes the trend signals more responsive to market conditions, reducing false signals and minimizing whipsaws often seen with traditional Supertrend indicators. The upper and lower bands are no longer static but evolve based on the underlying price structure, improving the reliability of trend shifts.
When the price crosses these adaptive levels, the indicator detects a trend change and plots it accordingly. Green signifies a bullish trend, while red indicates a bearish one. Alerts can also be triggered when the trend shifts, allowing traders to react quickly to potential reversals.
What makes this approach powerful is its ability to adapt to different market conditions. Traditional ATR-based methods use fixed parameters that might not always be optimal, whereas this ML-driven Supertrend continuously refines its estimations based on real-time data. The result is a more intelligent, less lagging, and highly adaptive trend-following tool.
This indicator is particularly useful for traders looking to enhance trend-following strategies with AI-driven insights. It reduces noise, improves signal reliability, and even offers a degree of trend forecasting, making it ideal for those who want a more advanced and dynamic alternative to standard Supertrend indicators.
This indicator is provided for educational and informational purposes only. It does not constitute financial advice, and past performance is not indicative of future results. Trading involves risk, and users should conduct their own research and use proper risk management before making investment decisions.
Johnny's Volatility-Driven Trend Identifier w/ Reversal SignalsJohnny's Volatility-Driven Trend Identifier w/ Reversal Signals is designed to identify high-probability trend shifts and reversals by incorporating volatility, momentum, and impulse-based filtering. It is specifically built for traders who want to capture strong trend movements while minimizing false signals caused by low volatility noise.
By leveraging Rate of Change (ROC), Relative Strength Index (RSI), and Average True Range (ATR)-based volatility detection, the indicator dynamically adapts to market conditions. It highlights breakout trends, reversals, and early signs of momentum shifts using strategically placed labels and color-coded trend visualization.
Inspiration taken from Top G indicator .
What This Indicator Does
The Volatility-Driven Trend Identifier works by:
Measuring Market Extremes & Momentum:
Uses ROC normalization with standard deviation to identify impulse moves in price action.
Implements RSI filtering to determine overbought/oversold conditions that validate trend strength.
Utilizes ATR-based volatility tracking to ensure signals only appear when meaningful market movements are occurring.
Identifying Key Trend Events:
Power Peak (🔥): Marks a confirmed strong downtrend, ideal for shorting opportunities.
Surge (🚀): Indicates a confirmed strong uptrend, signaling a potential long entry.
Soft Surge (↗): Highlights a mild bullish reentry or early uptrend formation.
Soft Peak (↘): Shows a mild bearish reentry or early downtrend formation.
Providing Adaptive Filtering for Reliable Signals:
Filters out weak trends with a volatility check, ensuring signals appear only in strong market conditions.
Implements multi-level confirmation by combining trend strength metrics, preventing false breakouts.
Uses gradient-based visualization to color-code market sentiment for quick interpretation.
What This Indicator Signals
Breakouts & Impulse Moves: 🚀🔥
The Surge (🚀) and Power Peak (🔥) labels indicate confirmed momentum breakouts, where the trend has been validated by a combination of ROC impulse, RSI confirmation, and ATR volatility filtering.
These signals suggest that the market is entering a strong trend, and traders can align their entries accordingly.
Early Trend Formation & Reentries: ↗ ↘
The Soft Surge (↗) and Soft Peak (↘) labels indicate areas where a trend might be forming, but is not yet fully confirmed.
These signals help traders anticipate potential entries before the trend gains full strength.
Volatility-Adaptive Trend Filtering: 📊
Since the indicator only activates in volatile conditions, it avoids the pitfalls of low-range choppy markets where false signals frequently occur.
ATR-driven adaptive windowing allows the indicator to dynamically adjust its sensitivity based on real-time volatility conditions.
How to Use This Indicator
1. Identifying High-Probability Entries
Bullish Entries (Long Trades)
Look for 🚀 Surge signals in an uptrend.
Confirm with RSI (should be above 50 for momentum).
Ensure volatility is increasing to validate the breakout.
Use ↗ Soft Surge signals for early entries before the trend fully confirms.
Bearish Entries (Short Trades)
Look for 🔥 Power Peak signals in a downtrend.
RSI should be below 50, indicating downward momentum.
Volatility should be rising, ensuring market momentum is strong.
Use ↘ Soft Peak signals for early entries before a full bearish confirmation.
2. Avoiding False Signals
Ignore signals when the market is ranging (low ATR).
Check RSI and ROC alignment to ensure trend confirmation.
Use additional confluences (e.g., price action, support/resistance levels, moving averages) for enhanced accuracy.
3. Trend Confirmation & Filtering
The stronger the trend, the higher the likelihood that Surge (🚀) and Power Peak (🔥) signals will continue in their direction.
Soft Surge (↗) and Soft Peak (↘) act as early warning signals before major breakouts occur.
What Makes This a Machine Learning-Inspired Moving Average?
While this indicator is not a direct implementation of machine learning (as Pine Script lacks AI/ML capabilities), it mimics machine learning principles by adapting dynamically to market conditions using the following techniques:
Adaptive Trend Selection:
It does not rely on fixed moving averages but instead adapts dynamically based on volatility expansion and momentum detection.
ATR-based filtering adjusts the indicator’s sensitivity to real-time conditions.
Multi-Factor Confirmation (Feature Engineering Equivalent in ML):
Combines ROC, RSI, and ATR in a structured way, similar to how ML models use multiple inputs to filter and classify data.
Implements conditional trend recognition, ensuring that only valid signals pass through the filter.
Noise Reduction with Data Smoothing:
The algorithm avoids false signals by incorporating trend intensity thresholds, much like how ML models remove outliers to refine predictions.
Adaptive filtering ensures that low-volatility environments do not produce misleading signals.
Why Use This Indicator?
✔ Reduces False Signals: Multi-factor validation ensures only high-confidence signals are triggered.
✔ Works in All Market Conditions: Volatility-adaptive nature allows the indicator to perform well in both trending and ranging markets.
✔ Great for Swing & Intraday Trading: It helps spot momentum shifts early and allows traders to catch major market moves before they fully develop.
✔ Visually Intuitive: Color-coded trends and clear signal markers make it easy to interpret.
Price in BTC (x1000)I'm not a coder. I just knocked this together with AI
Shows how the current asset performed relative to BTC (COINBASE:BTCUSD) on the current timeframe
Works with assets priced in USD, USDT and USDC but you can easily add more
Had to multiply the price by 1000 to mitigate leading zeros and improve compatibility with low-denomination assets (e.g. PEPE)
MAs and crossovers included
Feel free to use it however you want
TOL LANGIT ATR v7 - AI EnhancedThe TOL LANGIT ATR v7 is an adaptive technical indicator designed to identify market trends, support and resistance levels, and breakout points. It uses the Average True Range (ATR) and volatility to dynamically adjust trend bands, with visual markers for buy and sell signals. The indicator also highlights key support (blue) and resistance (orange) levels, and alerts users when these levels are broken. It’s perfect for trend following, breakout trading, and reversal strategies, and includes easy-to-set alerts for key market changes.
Market Cycles
The Market Cycles indicator transforms market price data into a stochastic wave, offering a unique perspective on market cycles. The wave is bounded between positive and negative values, providing clear visual cues for potential bullish and bearish trends. When the wave turns green, it signals a bullish cycle, while red indicates a bearish cycle.
Designed to show clarity and precision, this tool helps identify market momentum and cyclical behavior in an intuitive way. Ideal for fine-tuning entries or analyzing broader trends, this indicator aims to enhance the decision-making process with simplicity and elegance.
Inside Bar Breakout/Fakeout with AI Scenarios [Yosiet]Inside Bar Breakout/Fakeout Indicator with Scenarios
The Indicator is a powerful tool for traders looking to identify potential breakout and fakeout opportunities based on inside bar patterns. This indicator combines multiple technical analysis concepts to provide a comprehensive view of market behavior, helping traders make more informed decisions.
Key Features
Inside bar detection with filtering
Breakout and fakeout identification
Three distinct scenario detections
Customizable moving average calculations
Flexible visualization options
Alert conditions for various events
How It Works
The indicator identifies inside bars and filters them based on a maximum number of consecutive inside bars. It then detects breakouts and fakeouts using user-defined parameters. The script also calculates moving averages to determine trend direction.
Three specific scenarios are detected:
Strong breakout followed by a strong reversal
Weak breakout with multiple doji/weak candles
Strong breakout without reversal
These scenarios are visually represented on the chart, allowing traders to quickly identify potential trading opportunities.
How to Use
Apply the indicator to your chart
Adjust the input parameters to suit your trading style
Look for inside bar patterns and subsequent breakouts/fakeouts
Pay attention to the three scenario markers for additional context
Use the alert conditions to stay informed of potential opportunities
EMD Oscillator (Zeiierman)█ Overview
The Empirical Mode Decomposition (EMD) Oscillator is an advanced indicator designed to analyze market trends and cycles with high precision. It breaks down complex price data into simpler parts called Intrinsic Mode Functions (IMFs), allowing traders to see underlying patterns and trends that aren’t visible with traditional indicators. The result is a dynamic oscillator that provides insights into overbought and oversold conditions, as well as trend direction and strength. This indicator is suitable for all types of traders, from beginners to advanced, looking to gain deeper insights into market behavior.
█ How It Works
The core of this indicator is the Empirical Mode Decomposition (EMD) process, a method typically used in signal processing and advanced scientific fields. It works by breaking down price data into various “layers,” each representing different frequencies in the market’s movement. Imagine peeling layers off an onion: each layer (or IMF) reveals a different aspect of the price action.
⚪ Data Decomposition (Sifting): The indicator “sifts” through historical price data to detect natural oscillations within it. Each oscillation (or IMF) highlights a unique rhythm in price behavior, from rapid fluctuations to broader, slower trends.
⚪ Adaptive Signal Reconstruction: The EMD Oscillator allows traders to select specific IMFs for a custom signal reconstruction. This reconstructed signal provides a composite view of market behavior, showing both short-term cycles and long-term trends based on which IMFs are included.
⚪ Normalization: To make the oscillator easy to interpret, the reconstructed signal is scaled between -1 and 1. This normalization lets traders quickly spot overbought and oversold conditions, as well as trend direction, without worrying about the raw magnitude of price changes.
The indicator adapts to changing market conditions, making it effective for identifying real-time market cycles and potential turning points.
█ Key Calculations: The Math Behind the EMD Oscillator
The EMD Oscillator’s advanced nature lies in its high-level mathematical operations:
⚪ Intrinsic Mode Functions (IMFs)
IMFs are extracted from the data and act as the building blocks of this indicator. Each IMF is a unique oscillation within the price data, similar to how a band might be divided into treble, mid, and bass frequencies. In the EMD Oscillator:
Higher-Frequency IMFs: Represent short-term market “noise” and quick fluctuations.
Lower-Frequency IMFs: Capture broader market trends, showing more stable and long-term patterns.
⚪ Sifting Process: The Heart of EMD
The sifting process isolates each IMF by repeatedly separating and refining the data. Think of this as filtering water through finer and finer mesh sieves until only the clearest parts remain. Mathematically, it involves:
Extrema Detection: Finding all peaks and troughs (local maxima and minima) in the data.
Envelope Calculation: Smoothing these peaks and troughs into upper and lower envelopes using cubic spline interpolation (a method for creating smooth curves between data points).
Mean Removal: Calculating the average between these envelopes and subtracting it from the data to isolate one IMF. This process repeats until the IMF criteria are met, resulting in a clean oscillation without trend influences.
⚪ Spline Interpolation
The cubic spline interpolation is an advanced mathematical technique that allows smooth curves between points, which is essential for creating the upper and lower envelopes around each IMF. This interpolation solves a tridiagonal matrix (a specialized mathematical problem) to ensure that the envelopes align smoothly with the data’s natural oscillations.
To give a relatable example: imagine drawing a smooth line that passes through each peak and trough of a mountain range on a map. Spline interpolation ensures that line is as smooth and close to reality as possible. Achieving this in Pine Script is technically demanding and demonstrates a high level of mathematical coding.
⚪ Amplitude Normalization
To make the oscillator more readable, the final signal is scaled by its maximum amplitude. This amplitude normalization brings the oscillator into a range of -1 to 1, creating consistent signals regardless of price level or volatility.
█ Comparison with Other Signal Processing Methods
Unlike standard technical indicators that often rely on fixed parameters or pre-defined mathematical functions, the EMD adapts to the data itself, capturing natural cycles and irregularities in real-time. For example, if the market becomes more volatile, EMD adjusts automatically to reflect this without requiring parameter changes from the trader. In this way, it behaves more like a “smart” indicator, intuitively adapting to the market, unlike most traditional methods. EMD’s adaptive approach is akin to AI’s ability to learn from data, making it both resilient and robust in non-linear markets. This makes it a great alternative to methods that struggle in volatile environments, such as fixed-parameter oscillators or moving averages.
█ How to Use
Identify Market Cycles and Trends: Use the EMD Oscillator to spot market cycles that represent phases of buying or selling pressure. The smoothed version of the oscillator can help highlight broader trends, while the main oscillator reveals immediate cycles.
Spot Overbought and Oversold Levels: When the oscillator approaches +1 or -1, it may indicate that the market is overbought or oversold, signaling potential entry or exit points.
Confirm Divergences: If the price movement diverges from the oscillator's direction, it may indicate a potential reversal. For example, if prices make higher highs while the oscillator makes lower highs, it could be a sign of weakening trend strength.
█ Settings
Window Length (N): Defines the number of historical bars used for EMD analysis. A larger window captures more data but may slow down performance.
Number of IMFs (M): Sets how many IMFs to extract. Higher values allow for a more detailed decomposition, isolating smaller cycles within the data.
Amplitude Window (L): Controls the length of the window used for amplitude calculation, affecting the smoothness of the normalized oscillator.
Extraction Range (IMF Start and End): Allows you to select which IMFs to include in the reconstructed signal. Starting with lower IMFs captures faster cycles, while ending with higher IMFs includes slower, trend-based components.
Sifting Stopping Criterion (S-number): Sets how precisely each IMF should be refined. Higher values yield more accurate IMFs but take longer to compute.
Max Sifting Iterations (num_siftings): Limits the number of sifting iterations for each IMF extraction, balancing between performance and accuracy.
Source: The price data used for the analysis, such as close or open prices. This determines which price movements are decomposed by the indicator.
-----------------
Disclaimer
The information contained in my Scripts/Indicators/Ideas/Algos/Systems does not constitute financial advice or a solicitation to buy or sell any securities of any type. I will not accept liability for any loss or damage, including without limitation any loss of profit, which may arise directly or indirectly from the use of or reliance on such information.
All investments involve risk, and the past performance of a security, industry, sector, market, financial product, trading strategy, backtest, or individual's trading does not guarantee future results or returns. Investors are fully responsible for any investment decisions they make. Such decisions should be based solely on an evaluation of their financial circumstances, investment objectives, risk tolerance, and liquidity needs.
My Scripts/Indicators/Ideas/Algos/Systems are only for educational purposes!
Option Delta Candles [Luxmi AI]Introduction
In the world of options trading, understanding how an option’s price changes with various factors is crucial. One of the key metrics traders use is **Delta**, which measures the sensitivity of an option’s price to changes in the price of the underlying asset. This blog explores an Option Delta Indicator with an Exponential Moving Average (EMA), including its uses, how it works, and its potential limitations.
What is the Option Delta Indicator?
Delta is one of the "Greeks" used in options trading to gauge the risk and behavior of options. It indicates how much an option's price is expected to change for a one-point move in the underlying asset's price. Specifically:
- Call Option Delta: A positive value indicating that the option's price increases as the underlying price increases.
- Put Option Delta: A negative value indicating that the option's price decreases as the underlying price increases.
Key Features of the Indicator
Delta Calculation
The Option Delta Indicator calculates the delta of a call option using the Black-Scholes model, a widely accepted method for pricing European-style options. The formula for delta in the context of a call option is:
Delta = N(d1)
Where:
d1 is calculated as:
d1 = (ln(S / K) + (r + (σ^2 / 2)) * T) / (σ * sqrt(T))
Here, S is the current market price of the option (used as the strike price in this case), K is the strike price, r is the risk-free interest rate, σ is the volatility, and T is the time to expiry in years.
EMA of Delta
The Exponential Moving Average (EMA) of the delta is also plotted. The EMA is a smoothing function that helps identify trends by giving more weight to recent data points. It is calculated as:
EMA = ta.ema(delta_call, emaLength)
Where `emaLength` is the user-defined period for the EMA.
Uses of the Option Delta Indicator
Trend Analysis
The EMA helps smooth out delta values, making it easier to identify trends in the delta over time. This can be useful for traders looking to understand whether the delta is increasing or decreasing, which may indicate how the option’s sensitivity to price changes is evolving.
Decision-Making Tool
By observing both delta and its EMA, traders can make more informed decisions. For instance, if the delta is rising and the EMA confirms this trend, it might indicate bullish momentum in the underlying asset. Conversely, a declining delta with a falling EMA could suggest bearish trends.
Risk Management
Understanding the delta can help traders manage their risk by assessing how sensitive their options positions are to movements in the underlying asset. By using the EMA of delta, traders can better gauge changes in sensitivity and adjust their positions accordingly.
Limitations and Disadvantages
Dependence on Model Assumptions
The Black-Scholes model, which is used to calculate delta, relies on several assumptions including constant volatility and interest rates, and the absence of dividends. These assumptions may not hold in real-world markets, potentially affecting the accuracy of delta calculations.
No Consideration of Market Conditions
The indicator does not account for broader market conditions or liquidity factors. Delta and its EMA are calculated based purely on price and time to expiry, without incorporating market news or events that might impact the option's price.
Lag in EMA
The EMA, while smoothing data, introduces a lag because it is based on past prices. This means that the EMA may not react immediately to sudden price changes, potentially causing delayed signals.
Simplified Strike Price
In this indicator, the strike price is set to the current market price of the option. This simplification might not be suitable for all trading strategies, particularly if a different strike price is more relevant to the trader's strategy.
Limited Scope
This indicator focuses solely on delta and its EMA. While useful, it does not provide a comprehensive view of an option’s overall risk profile. Traders should consider using additional indicators and analyses for a more complete understanding.
Conclusion
The Option Delta Indicator with EMA offers a useful tool for traders to analyze how the sensitivity of an option’s price to changes in the underlying asset’s price evolves over time. The inclusion of an EMA helps to smooth out the delta values and identify trends. However, traders should be aware of the limitations, including the model’s assumptions, potential lag in EMA signals, and the simplified approach to the strike price.
As with any trading tool, it's crucial to use this indicator as part of a broader trading strategy that includes other analyses and risk management practices. Understanding its strengths and limitations will help traders make more informed decisions and enhance their overall trading effectiveness.
Spaghetti - Custom Cryptocurrency Index IndicatorDescription:
Spaghetti is a highly customizable cryptocurrency index indicator designed to let you track an average price of up to 15 different cryptocurrencies in one convenient line. Whether you're interested in a mix of meme coins, AI projects, or any other specific subset of coins, Spaghetti allows you to create your own personalized index.
Features:
Customizable Coin List: Input up to 15 different cryptocurrencies of your choice, allowing you to tailor the indicator to your preferred assets and strategies.
Dynamic Labeling: Features a label on the chart that displays a user-defined name, so you can personalize the indicator's label to match your theme or trading strategy.
Color Customization: The line color is fully customizable, enabling better visual integration with your charts.
Average Calculation: Calculates and plots the average price of all selected coins, providing an easy way to visualize overall market movement for your customized selection.
How to Use Spaghetti:
In the indicator settings, enter the tickers for up to 15 coins you want to include (e.g., BINANCE:BTCUSDT).
Customize the line color and the label text to match your style or preferences.
The indicator will plot the average price of all selected coins, with a dynamic label that follows the price for easy reference.
Spaghetti makes it easy to create and track custom crypto indices, providing a broader perspective of your selected market segments. Perfect for traders who want to stay on top of multiple assets without the clutter!
Backside Bubble ScalpingFrom LIHKG
Pine from Perplexity AI
以下是Backside Bubble Scalping策略的使用說明,旨在幫助交易者理解如何在美股交易中應用這一策略。
使用說明:Backside Bubble Scalping 策略
1. 前提條件
交易時間:此策略適用於香港時間晚上9:30 PM至12:00 AM。
圖表類型:使用1分鐘圖表進行交易。
2. 策略概述
Backside Bubble Scalping策略包含兩種主要的設置:尖backside和鈍backside。這些設置通常在10:00 PM至12:00 AM之間出現。
3. 指標設定
VWAP(粉紅色):成交量加權平均價格,用於識別市場趨勢。
9 EMA(綠色):9期指數移動平均線,用於捕捉短期價格變化。
4. 識別 Backside 設置
尖backside
特徵:
當市場趨勢為純紅色下跌,並形成尖尖的V形底部。
入場條件:
當價格突破9 EMA並經過小幅盤整後,進場做多。
鈍backside
特徵:
在混合顏色的趨勢中,形成鈍鈍的V形底部。
入場條件:
在盤整期間進場做多。
5. 止損和止盈設置
止損位置:
尖backside:設置在9 EMA上方的盤整範圍底部加上0.2。
鈍backside:設置在V底部的最低點加上0.2。
止盈位置:
尖backside:當價格跌破VWAP或出現一根K線沒有跟隨時出場。
鈍backside:當一根K線的三分之二身體向下突破9 EMA時出場。
6. 操作步驟
監控市場動態:在指定的交易時間內,觀察VWAP和9 EMA的變化。
識別入場信號:根據尖backside或鈍backside的條件進行判斷,確定何時進場。
設置止損和止盈:根據上述條件設置止損和止盈位,以管理風險。
執行交易:根據信號執行交易,並持續監控市場情況以調整策略。
7. 注意事項
避免在VWAP附近進行交易,以減少失敗風險。
如果出現影線(wick bar),建議不要進行交易,因為這可能表示該設置失敗。
Simple Price Action [Luxmi AI]Introducing the Simple Price Action Indicator
The Simple Price Action Indicator is designed to help traders quickly identify market trends and make informed decisions. This custom-built Pine Script tool changes candle colors on your chart based on price movement:
- Lime Green Candles indicate bullish momentum when the current price closes above the previous candle’s high.
- Red Candles signal bearish momentum when the price closes below the previous candle’s low.
Alongside these visual cues, the indicator generates Buy and Sell signals based on color changes:
- A buy signal appears when a red candle turns green.
- A sell signal shows up when a green candle turns red.
These signals are displayed directly on the chart as small labels ("B" for buy and "S" for sell), helping you easily spot trading opportunities. You can also set up alerts to notify you whenever a new signal is triggered, ensuring you never miss a trade.
The Simple Price Action Indicator is a straightforward yet effective tool for traders looking to enhance their price action analysis.
How It Works: Under the Hood
The script begins by defining two key colors—lime green for bullish candles and red for bearish candles. It then determines the candle color based on the closing price relative to the previous candle's high and low. If a bullish or bearish condition is met, the candle is colored accordingly.
Next, the script checks for a change in candle color to generate buy and sell signals. If a candle turns green after being red, a buy signal is plotted below the candle. If a candle turns red after being green, a sell signal is plotted above the candle.
Finally, the script includes alert conditions that correspond to these buy and sell signals, ensuring you can react quickly to potential trades.
Machine Learning Signal FilterIntroducing the "Machine Learning Signal Filter," an innovative trading indicator designed to leverage the power of machine learning to enhance trading strategies. This tool combines advanced data processing capabilities with user-friendly customization options, offering traders a sophisticated yet accessible means to optimize their market analysis and decision-making processes. Importantly, this indicator does not repaint, ensuring that signals remain consistent and reliable after they are generated.
Machine Learning Integration
The "Machine Learning Signal Filter" employs machine learning algorithms to analyze historical price data and identify patterns that may not be immediately apparent through traditional technical analysis. By utilizing techniques such as regression analysis and neural networks, the indicator continuously learns from new data, refining its predictive capabilities over time. This dynamic adaptability allows the indicator to adjust to changing market conditions, potentially improving the accuracy of trading signals.
Key Features and Benefits
Dynamic Signal Generation: The indicator uses machine learning to generate buy and sell signals based on complex data patterns. This approach enables it to adapt to evolving market trends, offering traders timely and relevant insights. Crucially, the indicator does not repaint, providing reliable signals that traders can trust.
Customizable Parameters: Users can fine-tune the indicator to suit their specific trading styles by adjusting settings such as the temporal synchronization and neural pulse rate. This flexibility ensures that the indicator can be tailored to different market environments.
Visual Clarity and Usability: The indicator provides clear visual cues on the chart, including color-coded signals and optional display of signal curves. Users can also customize the table's position and text size, enhancing readability and ease of use.
Comprehensive Performance Metrics: The indicator includes a detailed metrics table that displays key performance indicators such as return rates, trade counts, and win/loss ratios. This feature helps traders assess the effectiveness of their strategies and make data-driven decisions.
How It Works
The core of the "Machine Learning Signal Filter" is its ability to process and learn from large datasets. By applying machine learning models, the indicator identifies potential trading opportunities based on historical data patterns. It uses regression techniques to predict future price movements and neural networks to enhance pattern recognition. As new data is introduced, the indicator refines its algorithms, improving its accuracy and reliability over time.
Use Cases
Trend Following: Ideal for traders seeking to capitalize on market trends, the indicator helps identify the direction and strength of price movements.
Scalping: With its ability to provide quick signals, the indicator is suitable for scalpers aiming for rapid profits in volatile markets.
Risk Management: By offering insights into trade performance, the indicator aids in managing risk and optimizing trade setups.
In summary, the "Machine Learning Signal Filter" is a powerful tool that combines the analytical strength of machine learning with the practical needs of traders. Its ability to adapt and provide actionable insights makes it an invaluable asset for navigating the complexities of financial markets.
The "Machine Learning Signal Filter" is a tool designed to assist traders by providing insights based on historical data and machine learning techniques. It does not guarantee profitable trades and should be used as part of a comprehensive trading strategy. Users are encouraged to conduct their own research and consider their financial situation before making trading decisions. Trading involves significant risk, and it is possible to lose more than the initial investment. Always trade responsibly and be aware of the risks involved.
MACD Screener [Luxmi AI] MTFMulti-Timeframe Stock Screener with MACD
Introduction
In the world of trading, having a reliable stock screener is crucial for identifying potential trading opportunities. One of the most effective tools for this purpose is the Moving Average Convergence Divergence (MACD) indicator. By using MACD crossovers and crossunders with the signal line as trend change indicators, traders can make informed decisions. This guide explores how to utilize a multi-timeframe stock screener built in Pine Script v5 that leverages the MACD indicator to its fullest potential.
Understanding the MACD Indicator
The MACD is a momentum indicator that shows the relationship between two moving averages of a security’s price. It consists of three main components:
MACD Line - The difference between the 12-period EMA (Exponential Moving Average) and the 26-period EMA.
Signal Line - A 9-period EMA of the MACD line.
Histogram - The difference between the MACD line and the signal line.
A crossover occurs when the MACD line crosses above the signal line, indicating a potential bullish trend. Conversely, a crossunder occurs when the MACD line crosses below the signal line, signaling a potential bearish trend.
Why Multi-Timeframe Analysis Matters
A multi-timeframe approach provides a more comprehensive view of the market by analyzing trends across different timeframes. This method enhances the reliability of trading signals, as it reduces the likelihood of false signals. For instance, a MACD crossover on both daily and weekly charts offers a stronger indication of a trend change than a single timeframe signal.
Using Your Multi-Timeframe Stock Screener
Here’s how to effectively use it:
1. Setting Up Your Screener
Ensure that your stock screener is configured correctly to analyze multiple timeframes. You should be able to input the desired timeframes (e.g., daily and weekly) and set the conditions for MACD crossovers and crossunders.
2. Selecting Stocks for Analysis
Start by choosing a universe of stocks to analyze. This can be a list of stocks from major indices like the S&P 500, Nifty50 or specific sectors you are interested in. The screener will then apply the MACD criteria to these stocks.
3. Interpreting the Signals
- Bullish Signal (UP): A MACD crossover on both the daily and weekly charts suggests a strong bullish trend. This indicates that the stock is likely to move upward in the near future.
- Bearish Signal (DOWN): A MACD crossunder on both the daily and weekly charts signals a strong bearish trend. This indicates that the stock is likely to decline.
4. Confirming Signals with Other Indicators
While the MACD is a powerful indicator, it’s always a good idea to confirm its signals with other technical indicators such as the Relative Strength Index (RSI) or moving averages. This multi-indicator approach can help you make more informed decisions and reduce the risk of false signals.
5. Monitoring and Adjusting
Regularly monitor the performance of the stocks' trend identified by your screener. Adjust the screener settings if necessary to improve its accuracy. Market conditions can change, and it’s important to ensure your screener adapts to these changes.
6. Backtesting and Validation
Before fully relying on the signals from your screener, backtest it using historical data. This will help you validate its effectiveness and fine-tune the parameters to achieve the best results.
Conclusion
Your multi-timeframe stock screener with MACD crossover and crossunder as trend change indicators is a powerful tool for identifying potential trading opportunities. By analyzing trends across different timeframes, you can gain a comprehensive view of the market and make more informed trading decisions. Remember to confirm signals with other indicators and regularly monitor the screener’s performance to ensure it remains effective in different market conditions. Happy trading!
CVD with Moving Average (Trend Colors) [SYNC & TRADE]Yesterday I wrote a simple and easy code for the indicator "Cumulative Delta Volume with a moving average" using AI.
Introduction:
Delta is the difference between buys and sells. If there are more purchases, the delta is positive, if there are more sales, the delta is negative. We look at each candle separately on a particular time frame, which does not give us an overall picture over time.
Cumulative volume delta is in many ways an extension of volume delta, but it covers longer periods of time and provides different trading signals. Like the volume delta indicator, the Cumulative Volume Delta (CVD) indicator measures the relationship between buying and selling pressure, but does not focus on one specific candle (or other chart element), but rather gives a picture over time.
What did you want to get?
I have often seen that they tried to attach RSI and the Ichimoku cloud to the cumulative delta of volume, but I have never seen a cumulative delta of volume with a moving average. A moving average that takes data from the cumulative volume delta will be different from the moving average of the underlying asset. It has been noted that often at the intersection of the cumulative volume delta and the moving average, this is a more accurate signal to buy or sell than the same intersections for the underlying asset.
Initially, 5 moving averages were made with values of 21, 55, 89, 144 and 233, but I realized that this overloads the chart. It is easier to change the length of the moving average depending on the time frame you are using than to overload the chart. The final version with one moving SMA, EMA, RMA, WMA, HMA.
The logic for applying a moving average to a cumulative volume delta:
You choose a moving average, just like you would on your underlying asset. Use the moving average you like and the period you are used to working with. Each TF has its own settings.
What we see on the graph:
This is not an oscillator, but an adapted version for a candlestick chart (line only). Using it, you can clearly see where the market is moving based on the cumulative volume delta. The cool thing is that you can include your moving average applied to the cumulative volume delta. Thanks to this, you can see a trend movement, a return to the moving average to continue the trend.
Opportunities not lost:
The most interesting thing is that it remains possible to observe the divergence of the asset and the cumulative delta of the volume. This gives a great advantage. Those who have not worked with divergence do not rush into it right away. There may be 3 peaks in divergence (as with oversold/overbought), but it works many times more clearly than RSI and MACD.
Here's a good example on the daily chart. The moment we were all waiting for 75,000. The cumulative Delta Volume fell with each peak, while the price chart (tops) were approximately level.
Usually they throw (allow to buy) without volume for sales (delta down, price up) in order to merge at a more interesting price. And they also drain without the volume of purchases for a squeeze (price down / delta up) and again I buy back at a more interesting price. There are more complex estimation options; you can read about the divergence of the cumulative delta of the CVD volume. I just recommend doing a backtest.
Recommendations:
One more moment. Use the indicator on the stock exchange, where there is the most money, by turnover and by asset. Choose Binance, not Bybit. Those. choose the BTC asset, for example, but on the Binance exchange. Not futures, but spot.
The greater the turnover on the exchange for an asset, and the fewer opportunities to enter with leverage, the less volatile the price and the more beautiful and accurate the chart.
Works on all assets. There is a subscription limit (the number of calculated bars) that has little effect on anything. Can be applied to any asset where there is volume (not SPX, but ES1, not MOEX, but MX1!).
Перевод на русский.
Вчера написал с помощью AI простой и легкий код индикатора "Кумулятивная Дельта Объема со скользящей средней".
Введение:
Дельта (Delta) — это разница между покупками и продажами. Если покупок больше — дельта положительная, если больше продаж — дельта отрицательная. Мы смотрим на каждую свечу отдельно на том или ином таймфрейме, что не дает нам общей картины во времени.
Кумулятивная дельта объема — во многом продолжение дельты объёмов, но она включает более длительные периоды времени и дает другие торговые сигналы. Как и индикатор дельты объёма, индикатор кумулятивной дельты объема (Cumulative Volume Delta, CVD) измеряет связь между давлением покупателей и продавцов, но при этом не фокусируется на одной конкретной свече (или другом элементе графика), а дает картину во времени.
Что хотел получить?
Часто видел, что к кумулятивной детьте объема пытались прикрепить RSI и облако ишимоку, но никогда не видел кумулятивную дельту объема со скользящей средней. Скользящая средняя которая берет данные от кумулятивной дельты объема будет отличатся от скользящей средней основного актива. Было замечено, что часто в местах пересечения кумулятивной дельты объема и скользящей средней - это более точный сигнал к покупке или продаже, чем такие же пересечения по основному активу.
Изначально было сделанно 5 скользящих со значениями 21, 55, 89, 144 и 233, но я понял, что это перегружает график. Проще менять длину скользящей средней от используемого таймфрейма, чем перегружать график. Финальный вариант с одной скользящей SMA, EMA, RMA, WMA, HMA.
Логика применения скользящей средней к кумулятивной дельте объема:
Вы выбираете скользящую среднюю, так же как и на основном активе. Применяйте ту скользящую среднюю, которая вам нравится и период, с которым привыкли работать. На каждом TF свои настройки.
Что мы видим на графике:
Это не осциллятор, а адаптированная версия к свечному графику (только линия). С помощью него вы можете наглядно посмотреть куда движется рынок по кумулятивной дельте объема. Самое интересное, что вы можете включить свою скользящую среднюю, применимую к кумулятивной дельте объема. Благодаря этому вы можете видеть трендовое движение, возврат к средней скользящей для продолжения тренда.
Не потерянные возможности:
Самое интересное, что осталась возможность наблюдать за дивергенцией актива и кумулятивной дельтой объема. Это дает большое преимущество. Те кто не работал с дивергенцией не бросайтесь на нее сразу. Может быть и 3 пика в дивергенции (как с перепроданностью / перекупленностью), но работает в разы четче чем RSI и MACD.
Вот хороший пример на дневном графике. Момент когда мы все ждали 75000. Кумулятивная Дельта Объема падала с каждым пиком, в то время как ценовой график (вершины) были примерно на уровне.
Обычно закидывают (разрешают покупать) без объема на продажи (дельта вниз цена вверх), чтобы слить по более интересной цене. И также сливают без объема покупок для сквиза (цена вниз / дельта вверх) и опять откупаю по более интересной цене. Существуют более сложные варианты оценки, можете почитать про дивергенцию кумулятивной дельты объема CVD. Только рекомендую сделать бэктест.
Рекомендации:
Еще момент. Используйте индикатор, на бирже, там где больше всего денег, по обороту и по активу. Выбирайте не Bybit, а Binance. Т.е. выбираете актив BTC, к примеру, но на бирже Binance. Не фьючерс, а спот.
Чем более большие обороты на бирже, по активу, и меньше возможностей заходить с плечами, тем менее волатильная цена и более красивый и точный график.
Работает на всех активах. Есть ограничение по подписке (количество рассчитываемых баров) мало влияет на что. Можно применить к любому активу где есть объем (не SPX, а ES1, не MOEX, а MX1!).
Support/Resistance v2 (ML) KmeanKmean with Standard Deviation Channel
1. Description of Kmean
Kmean (or K-means) is a popular clustering algorithm used to divide data into K groups based on their similarity. In the context of financial markets, Kmean can be applied to find the average price values over a specific period, allowing the identification of major trends and levels of support and resistance.
2. Application in Trading
In trading, Kmean is used to smooth out the price series and determine long-term trends. This helps traders make more informed decisions by avoiding noise and short-term fluctuations. Kmean can serve as a baseline around which other analytical tools, such as channels and bands, are constructed.
3. Description of Standard Deviation (stdev)
Standard deviation (stdev) is a statistical measure that indicates how much the values of data deviate from their mean value. In finance, standard deviation is often used to assess price volatility. A high standard deviation indicates strong price fluctuations, while a low standard deviation indicates stable movements.
4. Combining Kmean and Standard Deviation to Predict Short-Term Price Behavior
Combining Kmean and standard deviation creates a powerful tool for analyzing market conditions. Kmean shows the average price trend, while the standard deviation channels demonstrate the boundaries within which the price can fluctuate. This combination helps traders to:
Identify support and resistance levels.
Predict potential price reversals.
Assess risks and set stop-losses and take-profits.
Should you have any questions about code, please reach me at Tradingview directly.
Hope you find this script helpful!
Moving Average Crossover Strategy by AI and Anton ThomasDescription:
Indicator Name: Moving Average Crossover Strategy
Overview:
The "Moving Average Crossover Strategy" is a technical analysis indicator that combines moving averages and the Relative Strength Index (RSI) to identify potential buy and sell signals. It aims to capture trend reversals and momentum shifts in the market.
Key Components:
Moving Averages:
The indicator calculates two moving averages:
Fast Moving Average (10-period SMA): This average reacts more quickly to price changes.
Slow Moving Average (30-period SMA): This average provides a smoother trend indication.
A bullish signal occurs when the fast moving average crosses above the slow moving average (golden cross), indicating a potential uptrend.
A bearish signal occurs when the fast moving average crosses below the slow moving average (death cross), indicating a potential downtrend.
Relative Strength Index (RSI):
The RSI measures the strength and momentum of price movements on a scale of 0 to 100.
A reading above 70 indicates overbought conditions, suggesting a potential reversal to the downside.
A reading below 30 indicates oversold conditions, suggesting a potential reversal to the upside.
Trading Signals:
Buy Signal:
Generated when the fast moving average crosses above the slow moving average (longCondition).
Additionally, a buy signal is identified when the RSI is oversold (below 30) and then crosses above the oversold threshold.
The indicator plots a green triangle above the bar to indicate the buy signal.
Sell Signal:
Generated when the fast moving average crosses below the slow moving average (shortCondition).
Additionally, a sell signal is identified when the RSI is overbought (above 70) and then crosses below the overbought threshold.
The indicator plots a red triangle below the bar to indicate the sell signal.
Additional Features:
Bullish Engulfing Pattern:
Detects bullish engulfing candlestick patterns, indicating potential bullish reversals.
Plots a green triangle below the bar to highlight the bullish engulfing pattern.
Bearish Engulfing Pattern:
Detects bearish engulfing candlestick patterns, indicating potential bearish reversals.
Plots a red triangle above the bar to highlight the bearish engulfing pattern.
Oversold and Overbought Levels:
Plots horizontal dashed lines at 30 (oversold) and 70 (overbought) on the RSI indicator.
Usage:
Traders can use this indicator to identify potential entry and exit points in the market based on moving average crossovers, RSI conditions, and candlestick patterns. It provides a comprehensive view of trend direction and momentum.
Considerations:
Always confirm signals with other technical analysis tools and market conditions.
Implement proper risk management strategies to minimize potential losses.
Example:
A buy signal is generated when the fast moving average crosses above the slow moving average, and the RSI is below 30 but crosses above it.
A sell signal is generated when the fast moving average crosses below the slow moving average, and the RSI is above 70 but crosses below it.
If you find this indicator profitable, please support by gifting some USDT (BSC NETWORK): 0x2c5c2dd39bbcc9453dd1428d881da37dacd9bf47
or just a thank you email at antonthomasfull(at)gmail.com
Luxmi AI Directional Option Buying (Long Only)Introduction:
"Option premium charts typically exhibit a predisposition towards bearish sentiment in higher timeframes"
In the dynamic world of options trading, navigating through the complexities of market trends and price movements is essential for making informed decisions. Among the arsenal of tools available to traders, option premium charts stand out as a pivotal source of insight, particularly in higher timeframes. However, their inherent bearish inclination in such timeframes necessitates a keen eye for identifying bullish pullbacks, especially in lower timeframes, to optimize buying strategies effectively.
Understanding the interplay between different data points becomes paramount in this endeavor. Traders embark on a journey of analysis, delving into metrics such as Implementation Shortfall, the performance of underlying index constituents, and bullish trends observed in lower timeframes like the 1-minute and 3-minute charts. These data points serve as guiding beacons, illuminating potential opportunities amidst the market's ever-shifting landscape.
Using this indicator, we will dissect the significance of option premium charts and their nuanced portrayal of market sentiment. Furthermore, we will unveil the art of discerning bullish pullbacks in lower timeframes, leveraging a multifaceted approach that amalgamates quantitative analysis with qualitative insights. Through this holistic perspective, traders can refine their decision-making processes, striving towards efficiency and efficacy in their options trading endeavors.
Major Features:
Implementation Shortfall (IS) Candles:
Working Principle:
TWAP (Time-Weighted Average Price) and EMA (Exponential Moving Average) are both commonly used in calculating Implementation Shortfall, a metric that measures the difference between the actual execution price of a trade and the benchmark price.
TWAP calculates the average price of a security over a specified time period, giving equal weight to each interval. On the other hand, EMA places more weight on recent prices, making it more responsive to current market conditions.
To calculate Implementation Shortfall using TWAP, the difference between the average execution price and the benchmark price is determined over the trading period. Similarly, with EMA, the difference is calculated using the exponential moving average price instead of a simple average.
By employing TWAP and EMA, traders can gauge the effectiveness of their trading strategies and identify areas for improvement in executing trades relative to a benchmark.
Benefits of using Implementation Shortfall:
By visualizing the implementation shortfall and its comparison with the EMA on the chart, traders can quickly assess whether current trading activity is deviating from recent trends.
Green bars suggest potential buying opportunities or bullish sentiment, while red bars suggest potential selling opportunities or bearish sentiment.
Traders can use this visualization to make more informed decisions about their trading strategies, such as adjusting position sizes, entering or exiting trades, or managing risk based on the observed deviations from the moving average.
How to use this feature:
This feature calculates Implementation Shortfall (IS) and visually represents it by coloring the candles in either bullish (green) or bearish (red) hues. This color-coding system provides traders with a quick and intuitive way to assess market sentiment and potential entry points. Specifically, a long entry is signaled when both the candle color and the trend cloud color align as green, indicating a bullish market outlook. This integrated approach enables traders to make informed decisions, leveraging IS insights alongside visual cues for more effective trading strategies.
Micro Trend Candles:
Working Principle:
This feature begins by initializing variables to determine trend channel width and track price movements. Average True Range (ATR) is then calculated to measure market volatility, influencing the channel's size. Highs and lows are identified within a specified range, and trends are assessed based on price breaches, with potential changes signaled accordingly. The price channel is continually updated to adapt to market shifts, and arrows are placed to indicate potential entry points. Colors are assigned to represent bullish and bearish trends, dynamically adjusting based on current market conditions. Finally, candles on the chart are colored to visually depict the identified micro trend, offering traders an intuitive way to interpret market sentiment and potential entry opportunities.
Benefits of using Micro Trend Candles:
Traders can use these identified micro trends to spot potential short-term trading opportunities. For example:
Trend Following: Traders may decide to enter trades aligned with the prevailing micro trend. If the candles are consistently colored in a certain direction, traders may consider entering positions in that direction.
Reversals: Conversely, if the script signals a potential reversal by changing the candle colors, traders may anticipate trend reversals and adjust their trading strategies accordingly. For instance, they might close existing positions or enter new positions in anticipation of a trend reversal.
It's important to note that these micro trends are short-term in nature and may not always align with broader market trends. Therefore, traders utilizing this script should consider their trading timeframes and adjust their strategies accordingly.
How to use this feature:
This feature assigns colors to candles to represent bullish and bearish trends, with adjustments made based on current market conditions. Green candles accompanied by a green trend cloud signal a potential long entry, while red candles suggest caution, indicating a bearish trend. This visual representation allows traders to interpret market sentiment intuitively, identifying optimal entry points and exercising caution during potential downtrends.
Scalping Candles (Inspired by Elliott Wave):
Working Principle:
This feature draws inspiration from the Elliot Wave method, utilizing technical analysis techniques to discern potential market trends and sentiment shifts. It begins by calculating the variance between two Exponential Moving Averages (EMAs) of closing prices, mimicking Elliot Wave's focus on wave and trend analysis. The shorter-term EMA captures immediate price momentum, while the longer-term EMA reflects broader market trends. A smoother Exponential Moving Average (EMA) line, derived from the difference between these EMAs, aids in identifying short-term trend shifts or momentum reversals.
Benefits of using Scalping Candles Inspired by Elliott Wave:
The Elliott Wave principle is a form of technical analysis that attempts to predict future price movements by identifying patterns in market charts. It suggests that markets move in repetitive waves or cycles, and traders can potentially profit by recognizing these patterns.
While this script does not explicitly analyze Elliot Wave patterns, it is inspired by the principle's emphasis on trend analysis and market sentiment. By calculating and visualizing the difference between EMAs and assigning colors to candles based on this analysis, the script aims to provide traders with insights into potential market sentiment shifts, which can align with the broader philosophy of Elliott Wave analysis.
How to use this feature:
Candlestick colors are assigned based on the relationship between the EMA line and the variance. When the variance is below or equal to the EMA line, candles are colored red, suggesting a bearish sentiment. Conversely, when the variance is above the EMA line, candles are tinted green, indicating a bullish outlook. Though not explicitly analyzing Elliot Wave patterns, the script aligns with its principles of trend analysis and market sentiment interpretation. By offering visual cues on sentiment shifts, it provides traders with insights into potential trading opportunities, echoing Elliot Wave's emphasis on pattern recognition and trend analysis.
Volume Candles:
Working Principle:
This feature introduces a custom volume calculation method tailored for bullish and bearish bars, enabling a granular analysis of volume dynamics specific to different price movements. By summing volumes over specified periods for bullish and bearish bars, traders gain insights into the intensity of buying and selling pressures during these periods, facilitating a deeper understanding of market sentiment. Subsequently, the script computes the net volume, revealing the overall balance between buying and selling pressures. Positive net volume signifies prevailing bullish sentiment, while negative net volume indicates bearish sentiment.
Benefits of Using Volume candles:
Enhanced Volume Analysis: Traders gain a deeper understanding of volume dynamics specific to bullish and bearish price movements, allowing them to assess the intensity of buying and selling pressures with greater precision.
Insight into Market Sentiment: By computing net volume and analyzing its relationship with the Exponential Moving Average (EMA), traders obtain valuable insights into prevailing market sentiment. This helps in identifying potential shifts in sentiment and anticipating market movements.
Visual Representation of Sentiment: The color-coded candle bodies based on volume dynamics provide traders with a visual representation of market sentiment. This intuitive visualization helps in quickly interpreting sentiment shifts and making timely trading decisions.
How to use this feature:
This visual representation allows traders to quickly interpret market sentiment based on volume dynamics. Green candles indicate potential bullish sentiment, while red candles suggest bearish sentiment. The color-coded candle bodies help traders identify shifts in market sentiment and make informed trading decisions.
Smart Sentimeter Candles:
Working Principle:
The "Smart Sentimeter Candles" feature is a tool designed for market sentiment analysis using technical indicators. It begins by defining stock symbols from various sectors, allowing traders to select specific indices for sentiment analysis. The script then calculates the difference between two Exponential Moving Averages (EMAs) of the High-Low midpoint, capturing short-term momentum changes in the market. It computes the difference between current and previous values to capture momentum shifts over time.
Additionally, it calculates the Exponential Moving Average (EMA) of this difference to provide a smoothed representation of the prevailing trend in market momentum. Another EMA of this difference is calculated to offer an alternative perspective on longer-term momentum trends. Bar colors are determined based on the difference between current and previous values, with bullish and bearish sentiment represented by custom colors. Finally, sentiment candles are visualized on the chart, providing traders with a clear representation of market sentiment changes.
Benefits of Using Sentimeter Candles:
By analyzing index constituents, traders gain insights into the individual stocks that collectively influence the index's performance. This understanding is crucial for trading options as it helps traders tailor their strategies to specific sectors or stocks within the index.
Sector-Specific Analysis: Traders can focus on specific sectors by selecting relevant indices for sentiment analysis.
Momentum Identification: The script identifies short-term momentum changes in the market, aiding traders in spotting potential trend reversals or continuations.
Clear Visualization: Sentiment candles visually represent market sentiment changes, making it easier for traders to interpret and act upon sentiment trends.
How to use this feature:
Select Indices: Toggle the inputs to choose which indices (e.g., NIFTY, BANKNIFTY, FINNIFTY) to analyze.
Interpret Sentiment Candles: Monitor the color of sentiment candles on the chart. Green candles indicate bullish sentiment, while red candles suggest bearish sentiment.
Observe Momentum Changes: Pay attention to momentum changes identified by the difference between EMAs and their respective EMAs. Increasing bullish momentum may present buying opportunities, while increasing bearish momentum could signal potential sell-offs.
Trend Cloud:
Working Principle:
The script utilizes the Relative Strength Index (RSI) to assess market momentum, identifying bullish and bearish phases based on RSI readings. It calculates two boolean variables, bullmove and bearmove, which signal shifts in momentum direction by considering changes in the Exponential Moving Average (EMA) of the closing price. When RSI indicates bullish momentum and the closing price's EMA exhibits positive changes, bullmove is triggered, signifying the start of a bullish phase. Conversely, when RSI suggests bearish momentum and the closing price's EMA shows negative changes, bearmove is activated, marking the beginning of a bearish phase. This systematic approach helps in understanding the current trend of the price. The script visually emphasizes these phases on the chart using plot shape markers, providing traders with clear indications of trend shifts.
Benefits of Using Trend Cloud:
Comprehensive Momentum Assessment: The script offers a holistic view of market momentum by incorporating RSI readings and changes in the closing price's EMA, enabling traders to identify both bullish and bearish phases effectively.
Structured Trend Recognition: With the calculation of boolean variables, the script provides a structured approach to recognizing shifts in momentum direction, enhancing traders' ability to interpret market dynamics.
Visual Clarity: Plotshape markers visually highlight the start and end of bullish and bearish phases on the chart, facilitating easy identification of trend shifts and helping traders to stay informed.
Prompt Response: Traders can promptly react to changing market conditions as the script triggers alerts when bullish or bearish phases begin, allowing them to seize potential trading opportunities swiftly.
Informed Decision-Making: By integrating various indicators and visual cues, the script enables traders to make well-informed decisions and adapt their strategies according to prevailing market sentiment, ultimately enhancing their trading performance.
How to use this feature:
The most effective way to maximize the benefits of this feature is to use it in conjunction with other key indicators and visual cues. By combining the color-coded clouds, which indicate bullish and bearish sentiment, with other features such as IS candles, microtrend candles, volume candles, and sentimeter candles, traders can gain a comprehensive understanding of market dynamics. For instance, aligning the color of the clouds with the trend direction indicated by IS candles, microtrend candles, and sentimeter candles can provide confirmation of trend strength or potential reversals.
Furthermore, traders can leverage the trend cloud as a trailing stop-loss tool for long entries, enhancing risk management strategies. By adjusting the stop-loss level based on the color of the cloud, traders can trail their positions to capture potential profits while minimizing losses. For long entries, maintaining the position as long as the cloud remains green can help traders stay aligned with the prevailing bullish sentiment. Conversely, a shift in color from green to red serves as a signal to exit the position, indicating a potential reversal in market sentiment and minimizing potential losses. This integration of the trend cloud as a trailing stop-loss mechanism adds an additional layer of risk management to trading strategies, increasing the likelihood of successful trades while reducing exposure to adverse market movements.
Moreover, the red cloud serves as an indicator of decay in option premiums and potential theta effect, particularly relevant for options traders. When the cloud turns red, it suggests a decline in option prices and an increase in theta decay, highlighting the importance of managing options positions accordingly. Traders may consider adjusting their options strategies, such as rolling positions or closing out contracts, to mitigate the impact of theta decay and preserve capital. By incorporating this insight into options pricing dynamics, traders can make more informed decisions about their options trades.
Scalping Opportunities (UpArrow and DownArrow):
Working Principle:
The feature calculates candlestick values based on the open, high, low, and close prices of each bar. By comparing these derived candlestick values, it determines whether the current candlestick is bullish or bearish. Additionally, it signals when there is a change in the color (bullish or bearish) of the derived candlesticks compared to the previous bar, enabling traders to identify potential shifts in market sentiment. This is a long only strategy, hence the signals are plotted only when the Trend Cloud is Green (Bullish).
Benefits of using UpArrow and DownArrow:
Clear Visualization: By employing color-coded candlesticks, the script offers traders a visually intuitive representation of market sentiment, enabling quick interpretation of prevailing conditions.
Signal Identification: Its capability to detect shifts in market sentiment serves as a valuable tool for identifying potential trading opportunities, facilitating timely decision-making and execution.
Long-Only Strategy: The script selectively plots signals only when the trend cloud is green, aligning with a bullish bias and enabling traders to focus on long positions during favorable market conditions.
Up arrows indicate potential long entry points, complementing the bullish bias of the trend cloud. Conversely, down arrows signify an active pullback in progress, signaling caution and prompting traders to refrain from entering long positions during such periods.
How to use this feature:
Confirmation: Confirm bullish market conditions with the Trend Cloud indicator. Ensure alignment between trend cloud signals, candlestick colors, and arrow indicators for confident trading decisions.
Entry Signals: Look for buy signals within a green trend cloud, indicated by bullish candlestick color changes and up arrows, suggesting potential long entry points aligned with the prevailing bullish sentiment.
Wait Signals: Exercise caution when encountering down arrows, which signify wait signals or active pullbacks in progress. Avoid entering long positions during these periods to avoid potential losses.
Exit Strategy: Use trend cloud color changes as signals to exit long positions. When the trend cloud shifts color, consider closing out long positions to lock in profits or minimize losses.
Profit Management: It's important to book or lock in some profits early on in option buying. Consider taking partial profits when the trade is in your favor and trail the remaining position to maximize gains on favorable trades.
Risk Management: Implement stop-loss orders or trailing stops to manage risk effectively. Exit positions promptly if sentiment shifts or if price movements deviate from the established trend, safeguarding capital.
Up and Down Signals:
Working Principle:
This feature calculates Trailing Stoploss (TSL) using the Average True Range (ATR) to dynamically adjust the stop level based on price movements. It generates buy signals when the price crosses above the trailing stop and sell signals when it crosses below. These signals are plotted on the chart and trigger alerts, signaling potential trading opportunities. Additionally, the script selectively plots Up and Down signals only when the Implementation Shortfall Calculation identifies scalp opportunities, independent of the prevailing price trend.
Benefits of using Up and Down Signals:
Trailing Stoploss: The script employs an ATR-based trailing stop, allowing traders to adjust stop levels dynamically in response to changing market conditions, thereby maximizing profit potential and minimizing losses.
Clear Signal Generation: Buy and sell signals are generated based on price interactions with the trailing stop, providing clear indications of entry and exit points for traders to act upon.
Alert Notifications: The script triggers alerts when buy or sell signals are generated, ensuring traders remain informed of potential trading opportunities even when not actively monitoring the charts.
Scalping Opportunities: By incorporating Implementation Shortfall Calculation, the script identifies scalp opportunities, enabling traders to capitalize on short-term price movements irrespective of the prevailing trend.
How to use this feature:
Signal Interpretation: Interpret Up signals as opportunities to enter long positions when the price crosses above the trailing stop, and Down signals as cues to exit.
Alert Monitoring: Pay attention to alert notifications triggered by the script, indicating potential trading opportunities based on signal generation.
Scalping Strategy: When Up and Down signals are plotted alongside scalp opportunities identified by the Implementation Shortfall Calculation, consider scalping trades aligned with these signals for short-term profit-taking, regardless of the overall market trend.
Consideration of Trend Cloud: Remember that this feature does not account for the underlying trend provided by the Trend Cloud feature. Consequently, the take profit levels generated by the trailing stop may be smaller than those derived from trend-following strategies. It's advisable to supplement this feature with additional trend analysis to optimize profit-taking levels and enhance overall trading performance.
Chart Timeframe Support and Resistance:
Working Principle:
This feature serves to identify and visualize support and resistance levels on the chart, primarily based on the chosen Chart Timeframe (CTF). It allows users to specify parameters such as the number of bars considered on the left and right sides of each pivot point, as well as line width and label color. Moreover, users have the option to enable or disable the display of these levels. By utilizing functions to calculate pivot highs and lows within the specified timeframe, the script determines the highest high and lowest low surrounding each pivot point.
Additionally, it defines functions to create lines and labels for each detected support and resistance level. Notably, this feature incorporates a trading method that emphasizes the concept of resistance turning into support after breakouts, thereby providing valuable insights for traders employing such strategies. These lines are drawn on the chart, with colors indicating whether the level is above or below the current close price, aiding traders in visualizing key levels and making informed trading decisions.
Benefits of Chart Timeframe Support and Resistance:
Identification of Price Levels: Support and resistance levels help traders identify significant price levels where buying (support) and selling (resistance) pressure may intensify. These levels are often formed based on historical price movements and are regarded as areas of interest for traders.
Decision Making: Support and resistance levels assist traders in making informed trading decisions. By observing price reactions near these levels, traders can gauge market sentiment and adjust their strategies accordingly. For example, traders may choose to enter or exit positions, set stop-loss orders, or take profit targets based on price behavior around these levels.
Risk Management: Support and resistance levels aid in risk management by providing reference points for setting stop-loss orders. Traders often place stop-loss orders below support levels for long positions and above resistance levels for short positions to limit potential losses if the market moves against them.
How to use this feature:
Planning Long Positions: When considering long positions, it's advantageous to strategize when the price is in proximity to a support level identified by the script. This suggests a potential area of buying interest where traders may expect a bounce or reversal in price. Additionally, confirm the bullish bias by ensuring that the trend cloud is green, indicating favorable market conditions for long trades.
Waiting for Breakout: If long signals are generated near resistance levels detected by the script, exercise patience and wait for a breakout above the resistance. A breakout above resistance signifies potential strength in the upward momentum and may present a more opportune moment to enter long positions. This approach aligns with trading methodologies that emphasize confirmation of bullish momentum before initiating trades.
Settings:
The Index Constituent Analysis setting empowers users to input the constituents of a specific index, facilitating the analysis of market sentiments based on the performance of these individual components. An index serves as a statistical measure of changes in a portfolio of securities representing a particular market or sector, with constituents representing the individual assets or securities comprising the index.
By providing the constituent list, users gain insights into market sentiments by observing how each constituent performs within the broader index. This analysis aids traders and investors in understanding the underlying dynamics driving the index's movements, identifying trends or anomalies, and making informed decisions regarding their investment strategies.
This setting empowers users to customize their analysis based on specific indexes relevant to their trading or investment objectives, whether tracking a benchmark index, sector-specific index, or custom index. Analyzing constituent performance offers a valuable tool for market assessment and decision-making.
Example: BankNifty Index and Its Constituents
Illustratively, the BankNifty index represents the performance of the banking sector in India and includes major banks and financial institutions listed on the National Stock Exchange of India (NSE). Prominent constituents of the BankNifty index include:
State Bank of India (SBIN)
HDFC Bank
ICICI Bank
Kotak Mahindra Bank
Axis Bank
IndusInd Bank
Punjab National Bank (PNB)
Yes Bank
Federal Bank
IDFC First Bank
By utilizing the Index Constituent Analysis setting and inputting these constituent stocks of the BankNifty index, traders and investors can assess the individual performance of these banking stocks within the broader banking sector index. This analysis enables them to gauge market sentiments, identify trends, and make well-informed decisions regarding their trading or investment strategies in the banking sector.
Example: NAS100 Index and Its Constituents
Similarly, the NAS100 index, known as the NASDAQ-100, tracks the performance of the largest non-financial companies listed on the NASDAQ stock exchange. Prominent constituents of the NAS100 index include technology and consumer discretionary stocks such as:
Apple Inc. (AAPL)
Microsoft Corporation (MSFT)
Amazon.com Inc. (AMZN)
Alphabet Inc. (GOOGL)
Facebook Inc. (FB)
Tesla Inc. (TSLA)
NVIDIA Corporation (NVDA)
PayPal Holdings Inc. (PYPL)
Netflix Inc. (NFLX)
Adobe Inc. (ADBE)
By inputting these constituent stocks of the NAS100 index into the Index Constituent Analysis setting, traders and investors can analyze the individual performance of these technology and consumer discretionary stocks within the broader NASDAQ-100 index. This analysis facilitates the evaluation of market sentiments, identification of trends, and informed decision-making regarding trading or investment strategies in the technology and consumer sectors.
Example: FTSE 100 Index and Its Constituents
The FTSE 100 index represents the performance of the 100 largest companies listed on the London Stock Exchange (LSE) by market capitalization. Some notable constituents of the FTSE 100 index include:
HSBC Holdings plc
BP plc
GlaxoSmithKline plc
Unilever plc
Royal Dutch Shell plc
AstraZeneca plc
Diageo plc
Rio Tinto plc
British American Tobacco plc
Reckitt Benckiser Group plc
By inputting these constituent stocks of the FTSE 100 index into the Index Constituent Analysis setting, traders and investors can analyze the individual performance of these diverse companies within the broader UK market index. This analysis facilitates the evaluation of market sentiments, identification of trends, and informed decision-making regarding trading or investment strategies in the UK market.
This comprehensive approach enables users to dissect index performance effectively, providing valuable insights for investors and traders across different markets and sectors.
Index Selection - Index Selection allows traders to specify the index for Sentimeter calculations, enabling customization for Call and Put Option charts corresponding to the chosen index.
Support and Resistance Levels - Set the left and right bars to consider pivot high and low to draw Support and resistance lines. Linewidth setting to help increase the width of the Support and Resistance lines. Label Color to change the color of the labels.
Style Section Colors to allow users to customize the color scheme to their liking.
Crypto Narratives: Relative StrengthThis indicator offers a unique perspective on the crypto market by focusing on the relative strength of different narratives. It aggregates RSI data from multiple tokens associated with each narrative, providing a comprehensive view of the sentiment and momentum behind these themes. You can use it to take profit, find W bottoms or M tops to enter and exit narratives. and generally see what hot at the moment with lots of pretty colours.
This indicator tracks the relative strength of various crypto narratives using the Relative Strength Index (RSI) of representative tokens. It allows users to gauge the momentum and sentiment behind different themes in the cryptocurrency market.
Functionality:
The indicator calculates the average RSI values for the current leading tokens associated with ten different crypto narratives:
- AI (Artificial Intelligence)
- Ordinals
- DeFi (Decentralized Finance)
- Memes
- Gaming
- Level 1 (Layer 1 Protocols)
- Sol Betas (Solana Ecosystem)
- Storage/DePin
- RWA (Real-World Assets)
- ReStaking
he average RSI values for each narrative are calculated by summing the RSI values of the associated tokens and dividing by the number of tokens. The indicator plots the 3-period simple moving average (SMA) of each narrative's RSI using different colors and line styles.
Users can customize the RSI length, line width, and label offset through the input options. If the "Show Labels" option is enabled, the indicator displays labels for each narrative's RSI value on the most recent bar.
The indicator also includes horizontal lines representing overbought and oversold levels, which can be adjusted through the input options. Alerts are triggered when a narrative's RSI crosses above the overbought level or below the oversold level. The alerts include the narrative name, RSI value, and a suggestion to consider selling or buying.
Machine Learning: Multiple Logistic Regression
Multiple Logistic Regression Indicator
The Logistic Regression Indicator for TradingView is a versatile tool that employs multiple logistic regression based on various technical indicators to generate potential buy and sell signals. By utilizing key indicators such as RSI, CCI, DMI, Aroon, EMA, and SuperTrend, the indicator aims to provide a systematic approach to decision-making in financial markets.
How It Works:
Technical Indicators:
The script uses multiple technical indicators such as RSI, CCI, DMI, Aroon, EMA, and SuperTrend as input variables for the logistic regression model.
These indicators are normalized to create categorical variables, providing a consistent scale for the model.
Logistic Regression:
The logistic regression function is applied to the normalized input variables (x1 to x6) with user-defined coefficients (b0 to b6).
The logistic regression model predicts the probability of a binary outcome, with values closer to 1 indicating a bullish signal and values closer to 0 indicating a bearish signal.
Loss Function (Cross-Entropy Loss):
The cross-entropy loss function is calculated to quantify the difference between the predicted probability and the actual outcome.
The goal is to minimize this loss, which essentially measures the model's accuracy.
// Error Function (cross-entropy loss)
loss(y, p) =>
-y * math.log(p) - (1 - y) * math.log(1 - p)
// y - depended variable
// p - multiple logistic regression
Gradient Descent:
Gradient descent is an optimization algorithm used to minimize the loss function by adjusting the weights of the logistic regression model.
The script iteratively updates the weights (b1 to b6) based on the negative gradient of the loss function with respect to each weight.
// Adjusting model weights using gradient descent
b1 -= lr * (p + loss) * x1
b2 -= lr * (p + loss) * x2
b3 -= lr * (p + loss) * x3
b4 -= lr * (p + loss) * x4
b5 -= lr * (p + loss) * x5
b6 -= lr * (p + loss) * x6
// lr - learning rate or step of learning
// p - multiple logistic regression
// x_n - variables
Learning Rate:
The learning rate (lr) determines the step size in the weight adjustment process. It prevents the algorithm from overshooting the minimum of the loss function.
Users can set the learning rate to control the speed and stability of the optimization process.
Visualization:
The script visualizes the output of the logistic regression model by coloring the SMA.
Arrows are plotted at crossover and crossunder points, indicating potential buy and sell signals.
Lables are showing logistic regression values from 1 to 0 above and below bars
Table Display:
A table is displayed on the chart, providing real-time information about the input variables, their values, and the learned coefficients.
This allows traders to monitor the model's interpretation of the technical indicators and observe how the coefficients change over time.
How to Use:
Parameter Adjustment:
Users can adjust the length of technical indicators (rsi_length, cci_length, etc.) and the Z score length based on their preference and market characteristics.
Set the initial values for the regression coefficients (b0 to b6) and the learning rate (lr) according to your trading strategy.
Signal Interpretation:
Buy signals are indicated by an upward arrow (▲), and sell signals are indicated by a downward arrow (▼).
The color-coded SMA provides a visual representation of the logistic regression output by color.
Table Information:
Monitor the table for real-time information on the input variables, their values, and the learned coefficients.
Keep an eye on the learning rate to ensure a balance between model adjustment speed and stability.
Backtesting and Validation:
Before using the script in live trading, conduct thorough backtesting to evaluate its performance under different market conditions.
Validate the model against historical data to ensure its reliability.